VWAP + Order Flow VWAP + Order Flow Pro — Institutional Bias, Volume Delta & High-Conviction Signals
Most VWAP indicators just draw a line. This one reads the market behind the line.
VWAP + Order Flow Pro combines volume-weighted average price with approximated order flow (bar delta + cumulative volume delta) to identify three specific setups where institutional activity is most likely to drive the next move.
THREE SIGNALS — ALL REQUIRE CONFLUENCE
▲▼ Signal A — Institutional Reclaim
Price spends 3+ bars on the wrong side of VWAP, then reclaims it with a decisive body (≥50% of range), strong delta (>0.6× average volume), and CVD that is both positive and accelerating. Not every VWAP cross — only ones with real buying or selling behind them.
▲▼ Signal B — Band Absorption
Price wicks beyond the ±2σ band by a configurable minimum extension, then closes back inside ±1.5σ. The bar must be wick-dominant (wick/body ratio >1.5), with opposing delta >0.5× average volume and expanding participation. Designed to catch institutional absorption of retail breakout attempts.
◆ Signal C — CVD Pivot Divergence
Price prints a new high or low at a pivot, but cumulative volume delta does not confirm. Hidden buying or distribution. Only fires within ±1.5σ of VWAP with CVD accelerating in the divergence direction.
WHAT MAKES THIS DIFFERENT
No repaint. All signals are gated by barstate.isconfirmed. Divergence signals use pivot lag by design — the delay is the protection.
Adaptive lengths. CVD slope, volume average, and cooldown periods auto-tune to your chart timeframe (1m through 1H+). No manual adjustment needed when switching TFs.
Signal cooldown. Prevents signal spam during chop. Configurable.
Volume filter. Signals require volume above a user-defined multiple of average. Default 1.5×.
Session filter. Optional restriction to high-probability windows: open 90 minutes + close 60 minutes. Built for equities and futures. Leave off for crypto and FX.
WHAT'S ON THE CHART
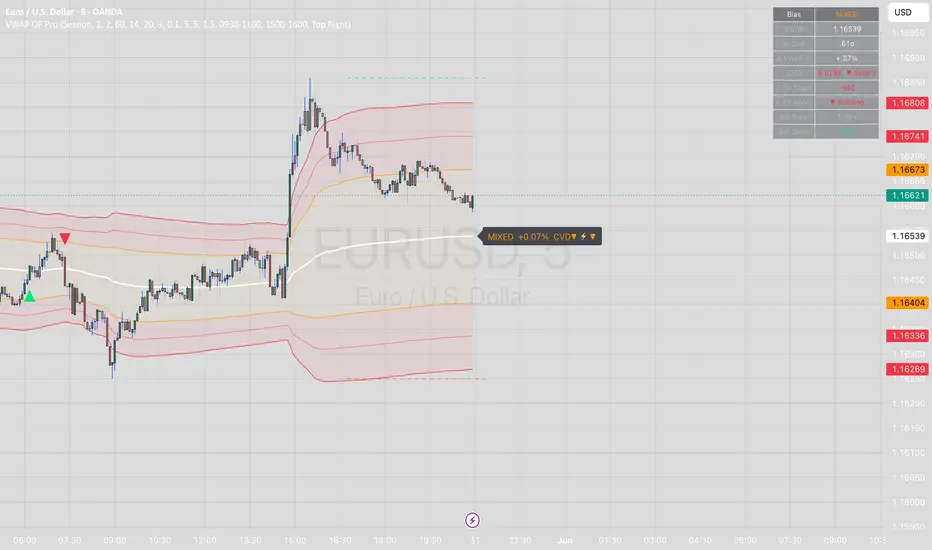
VWAP with ±1σ, ±1.5σ, ±2σ bands (all toggleable)
Optional HTF VWAP overlay (user-defined timeframe, no repaint)
Bar coloring by delta intensity — teal = buy-dominant, red = sell-dominant
Session high/low dashed lines
Floating bias label: BULL / BEAR / MIXED + CVD direction + acceleration indicator
Stats table: Bias, VWAP price, σ-distance, % from VWAP, CVD, CVD slope, CVD acceleration, volume ratio, bar delta
ALERTS
Five alert conditions built in: Long Signal, Short Signal, Bullish CVD Divergence, Bearish CVD Divergence, VWAP Cross (any direction).
HONEST DISCLOSURE
The order flow in this indicator is approximated, not real. TradingView does not provide bid/ask tape or Level 2 data. Bar delta is calculated from where the close sits within the bar's range — a widely used proxy, but not a substitute for a true footprint chart. Signals are designed to be high-probability, not high-frequency. Fewer signals, better quality.
This indicator is for educational and analytical purposes. Past signals do not guarantee future results. Always use proper risk management.
Works on: Equities · Futures · Crypto · FX
Best timeframes: 1m · 3m · 5m · 15m · 30m · 1H
Chỉ báo