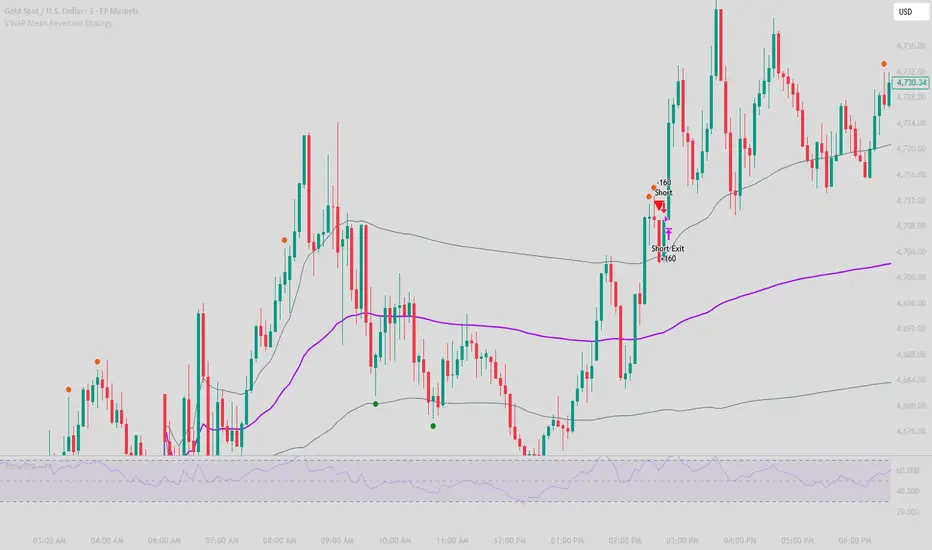
THE BIONIC TRADER - Daily VWAPTHE BIONIC TRADER – Daily VWAP is a long-term Volume-Weighted Average Price indicator that calculates a rolling VWAP across up to 200 daily bars, overlaid on any intraday or daily chart. Unlike session-based VWAP indicators that reset at the start of each trading day, this indicator maintains a continuous rolling window — giving you a macro-level view of where the "fair value" price sits relative to actual traded volume over weeks and months.
How It Works
The indicator fetches daily close prices and daily volume via request.security() and maintains a rolling array of price×volume products. On each new daily bar, the oldest entry is dropped and the newest is added, keeping the calculation window at the user-defined length (default: 200 days). The VWAP is then computed as:
VWAP = Σ(Price × Volume) / Σ(Volume)
Standard deviation bands are calculated using a volume-weighted variance, meaning price deviations are weighted by their respective daily volume — giving higher-volume days a proportionally larger influence on the band width.
Features
Rolling Daily VWAP — configurable from 5 to 200 days
Volume-Weighted Standard Deviation Bands — 1σ and 2σ levels above and below VWAP
Multiple Price Sources — Close, Typical (HLC/3), or HLC3
Dynamic Info Label — displays the current VWAP value, dollar distance, percentage distance, and the active number of days in the calculation window
Color-coded Label — green when price is above VWAP, red when below
Band Fill Zones — subtle shading for the 1σ and 2σ regions
Built-in Alert Conditions — fires on VWAP crossovers, crossunders, and 2σ extensions in both directions
Practical Use Cases
Identify whether a stock is trading at a discount or premium relative to its long-term volume-weighted fair value
Use the 2σ bands as mean reversion zones — extended moves beyond ±2σ historically tend to revert toward the mean
Use the VWAP line as a dynamic support/resistance level on daily and weekly timeframes
Combine with intraday RVOL or gap analysis to assess whether a stock is approaching a significant long-term level
Inputs
Parameter / Default / Description
VWAP Length / 200 / Number of daily bars in the rolling window
Show Bands / true / Toggle standard deviation bands on/off
Band 1 Multiplier / 1.0 / Width of the inner band (1σ)
Band 2 Multiplier / 2.0 / Width of the outer band (2σ)
Price Source / Close / Daily price used for VWAP calculation
Show Info Label / true / Toggle the info label at the last bar
Disclaimer
This indicator is provided for informational and educational purposes only. While every effort has been made to ensure the accuracy of the calculations, the author makes no guarantee of correctness, completeness, or fitness for any particular purpose. The results produced by this script depend on the data provided by your broker/data feed and may differ from other VWAP implementations. This indicator does not constitute financial advice and should not be used as the sole basis for any trading decision. Trading involves substantial risk of loss. Always do your own research and consult a qualified financial advisor before making investment decisions. Past performance is not indicative of future results.
Chỉ báo