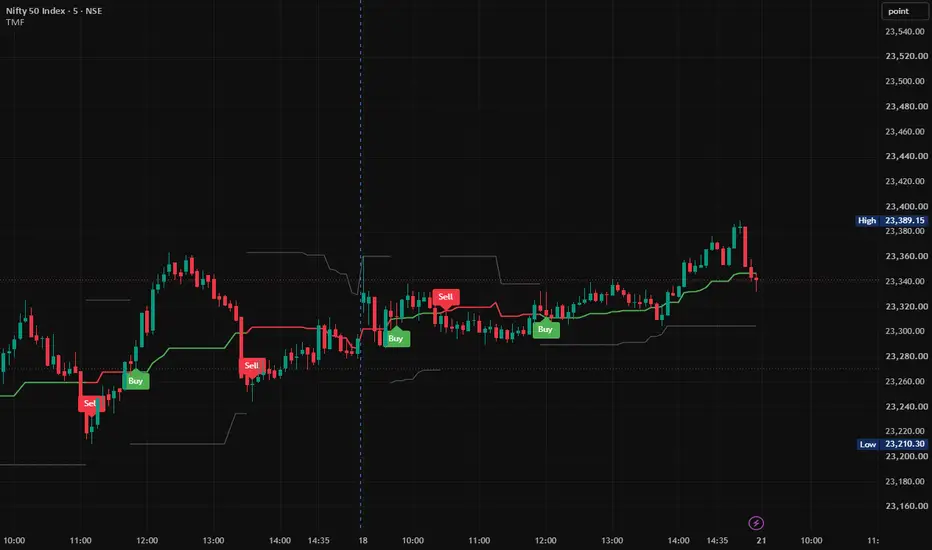
Trend My Friend🚀 Trend My Friend (TMF)
Dynamic Midrange Breakout & Multi-Candle Confirmation System
Trend My Friend (TMF) is a Pine Script® v6 trend and momentum indicator designed to identify bullish and bearish market regimes using a Dynamic Price Range, Equilibrium Midrange, and Multi-Candle Confirmation methodology.
Rather than relying on a single candle crossing the midrange, TMF evaluates consecutive candle closes relative to the dynamically calculated equilibrium level. This provides a structured framework for monitoring directional momentum, trend transitions, and dynamic market structure.
________________________________________
📊 Core Concept
TMF is built around three primary components:
Dynamic Range → Midrange Equilibrium → Multi-Candle Confirmation
The indicator continuously calculates the recent high and low of the selected lookback period, determines the midpoint between those extremes, and then evaluates consecutive candle closes around that midpoint.
This creates a simple framework for identifying whether the current market structure is developing above or below its dynamic equilibrium.
________________________________________
⚙️ How Trend My Friend Works
1. Dynamic Range Calculation
TMF first calculates the current market range using the Range Sensitivity Set.
With the default setting of 25, the indicator calculates:
• Upper Range = Highest High of the selected lookback period
• Lower Range = Lowest Low of the selected lookback period
These boundaries update dynamically as new candles are formed.
Upper Range
Represents the highest price recorded during the selected lookback period.
Lower Range
Represents the lowest price recorded during the selected lookback period.
Together, they form the indicator's dynamic structural range.
________________________________________
2. Equilibrium Midrange
After calculating the Upper Range and Lower Range, TMF calculates their midpoint:
Midrange = Lower Range + (Upper Range − Lower Range) ÷ 2
The midrange represents the central equilibrium level of the current range.
It provides the primary directional reference:
Price above Midrange → Bullish Zone
Price below Midrange → Bearish Zone
________________________________________
3. Multi-Candle Confirmation
The key feature of TMF is its Multi-Candle Confirmation mechanism.
The indicator does not confirm a directional regime simply because one candle crosses the midrange.
Instead, TMF checks the number of consecutive candles specified by the Signal Confirmation setting.
The default setting is 3 candles.
🟢 Bullish Confirmation
A bullish regime is confirmed when the required number of consecutive candles close strictly above the midrange.
For the default setting of 3:
Candle 1 → Above Midrange ✓
Candle 2 → Above Midrange ✓
Candle 3 → Above Midrange ✓
Once all required candles satisfy the condition, the bullish regime becomes active.
🔴 Bearish Confirmation
A bearish regime is confirmed when the required number of consecutive candles close strictly below the midrange.
For the default setting of 3:
Candle 1 → Below Midrange ✓
Candle 2 → Below Midrange ✓
Candle 3 → Below Midrange ✓
Once all required candles satisfy the condition, the bearish regime becomes active.
________________________________________
4. Directional Regime
Once the confirmation condition is satisfied, TMF establishes the corresponding market regime.
🟢 Bullish Regime
When the required consecutive closes are above the midrange:
• Trend state becomes Bullish
• Midrange is displayed in Green
• Lower Range becomes the active downside structural reference
• A new Buy signal can be generated
🔴 Bearish Regime
When the required consecutive closes are below the midrange:
• Trend state becomes Bearish
• Midrange is displayed in Red
• Upper Range becomes the active upside structural reference
• A new Sell signal can be generated
________________________________________
🎯 Buy & Sell Signal Generation
TMF is designed to generate signals when a new directional regime is established, rather than repeatedly printing the same signal while the regime remains active.
🟢 Buy Signal
A Buy signal is generated when the bullish regime changes from inactive to active.
Previous State → Not Bullish
Current State → Bullish
→ BUY
This means the Buy label represents the newly established bullish condition according to the indicator's confirmation rules.
🔴 Sell Signal
A Sell signal is generated when the bearish regime changes from inactive to active.
Previous State → Not Bearish
Current State → Bearish
→ SELL
Once the bearish regime remains active, TMF does not repeatedly print Sell labels on every candle.
________________________________________
📈 Visual Interpretation
TMF uses three primary structural lines:
Upper Range
Midrange — Directional Equilibrium
Lower Range
The Midrange changes color according to the confirmed directional state:
🟢 Green Midrange → Bullish Regime
🔴 Red Midrange → Bearish Regime
⚪ Gray Midrange → No Confirmed Directional Regime
The selected SL Line Color is used for the appropriate structural range boundary according to the active trend state.
________________________________________
🔄 TMF Logic — Complete Process
The complete methodology can be summarized as:
1. Highest High + Lowest Low
2. Dynamic Price Range
3. Calculate Equilibrium Midrange
4. Check Consecutive Candle Closes
5. Confirm Bullish or Bearish Regime
6. Detect New Directional Transition
7. Generate Buy / Sell Signal
8. Continue Monitoring the Dynamic Range
This creates a straightforward process for reading directional market structure.
________________________________________
🎛️ Input Parameters
Parameter Default Function
Range Sensitivity Set 25 Number of bars used to calculate the Upper and Lower Range.
Signal Confirmation 3 Number of consecutive candle closes required above or below the Midrange.
SL Line Color Gray Controls the color used for the structural range boundary.
Range Sensitivity Set
This controls the lookback period used to calculate the dynamic range.
Lower value
• More responsive to recent price movements
• Faster structural changes
• More sensitive to short-term market movement
Higher value
• Broader range
• Slower structural changes
• More focused on larger market movements
Signal Confirmation
This controls how many consecutive closes are required to establish a directional regime.
Lower value
• Earlier confirmation
• More responsive to price changes
Higher value
• Requires more sustained movement
• Later confirmation
The appropriate setting depends on the instrument, timeframe, volatility, and trading methodology.
________________________________________
🧭 Trading Framework
TMF can be incorporated into a broader trading methodology as a trend-confirmation and market-structure tool.
🟢 Bullish Framework
After a Buy signal, traders may evaluate:
• Price structure above the Midrange
• Higher highs and higher lows
• Momentum continuation
• Breakout or retest conditions
• Volume confirmation
• Broader market trend
🔴 Bearish Framework
After a Sell signal, traders may evaluate:
• Price structure below the Midrange
• Lower highs and lower lows
• Momentum continuation
• Breakdown or retest conditions
• Volume confirmation
• Broader market trend
TMF is therefore best understood as a technical confirmation tool, rather than a complete standalone trading system.
________________________________________
🛡️ Risk Management
The dynamic range boundaries can be monitored as structural reference levels when developing a risk-management plan.
Long Positions
The Lower Range can be monitored as a potential downside structural reference.
Short Positions
The Upper Range can be monitored as a potential upside structural reference.
Stop-loss placement should be determined according to the trader's individual strategy, volatility, position sizing, market structure, and risk tolerance.
________________________________________
🎯 Trade Management
TMF does not prescribe a mandatory profit-taking method.
Traders can combine TMF signals with their preferred trade-management techniques, such as:
• Fixed risk-to-reward targets
• Previous swing highs/lows
• Trailing stops
• Structural support/resistance
• Opposite TMF regime signals
• Volatility-based exits
An opposing TMF signal may also be monitored as an indication that the current directional regime has changed.
________________________________________
🌐 Suitable Markets
TMF can be applied across a variety of actively traded markets, including:
• Equities
• Index Futures
• Forex
• Cryptocurrencies
• Commodities
• Other liquid instruments
Signal behavior can vary depending on the instrument, timeframe, volatility, liquidity, and selected parameters.
________________________________________
⏱️ Timeframe Considerations
TMF can be used across multiple timeframes, including:
Intraday
• 5-Minute
• 15-Minute
• 1-Hour
Swing / Higher Timeframes
• 4-Hour
• Daily
• Weekly
There is no single parameter configuration that is optimal for every market. Traders should evaluate the settings according to their specific instrument, timeframe, and methodology.
________________________________________
🔔 TradingView Alerts
TMF includes built-in TradingView alert conditions for directional regime transitions.
TMF Long
Triggered when a new bullish regime is established.
TMF Short
Triggered when a new bearish regime is established.
These alerts can be used for chart monitoring and compatible TradingView automation workflows.
________________________________________
💡 Why Multi-Candle Confirmation?
A single candle can temporarily move above or below an important price level before quickly reversing.
TMF therefore requires consecutive candle closes for directional confirmation.
For example, with:
Signal Confirmation = 3
One isolated close above the Midrange is not enough to establish a bullish regime.
The required three consecutive closes must remain above the Midrange.
Likewise, three consecutive closes below the Midrange are required for bearish confirmation.
This makes the methodology focused on confirmed directional movement rather than a single-candle price crossing.
________________________________________
⚠️ Important Considerations
TMF is a technical-analysis and market-structure indicator. It does not predict future prices and does not guarantee profitable trades.
No indicator can completely eliminate market noise, false breakouts, or losing trades under all market conditions.
Signal behavior may differ during:
• Sideways markets
• Low-liquidity conditions
• High-volatility events
• Sharp reversals
• Gap movements
• Rapidly changing market regimes
Users should apply appropriate risk management and consider additional market-structure or confirmation techniques where appropriate.
________________________________________
🔥 Trend My Friend (TMF)
Dynamic Midrange. Multi-Candle Confirmation. Clear Market Structure.
Trend My Friend (TMF) transforms rolling price extremes into a structured visual framework for monitoring directional market regimes.
By combining a Dynamic Price Range, Equilibrium Midrange, and Multi-Candle Confirmation, TMF provides a clean way to monitor when price establishes sustained movement above or below its dynamic equilibrium.
Structured Confirmation — Dynamic Market Structure — Clear Directional Signals
________________________________________
📌 Disclaimer
This indicator is provided for analytical and educational purposes to assist with technical analysis. Past performance does not guarantee future results. Trading involves substantial risk, and users should manage risk appropriately.
Chỉ báo