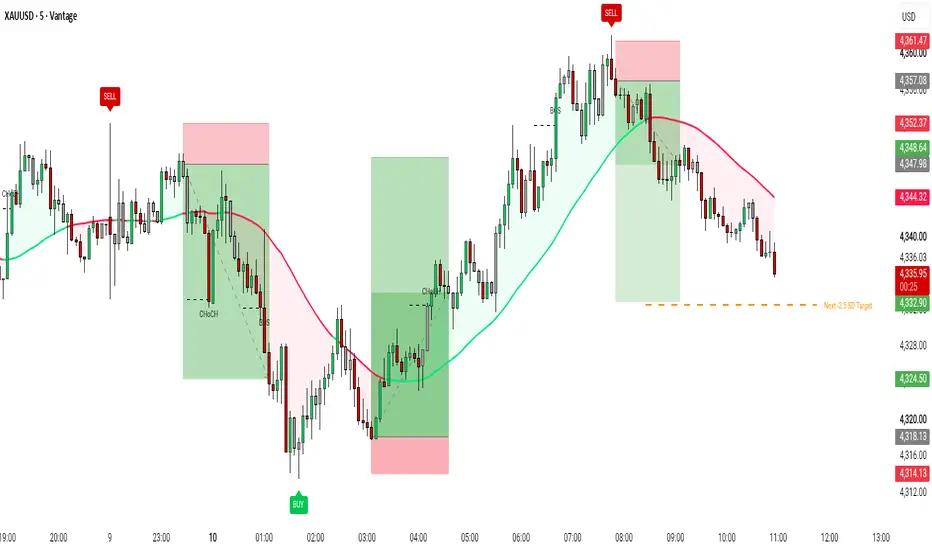
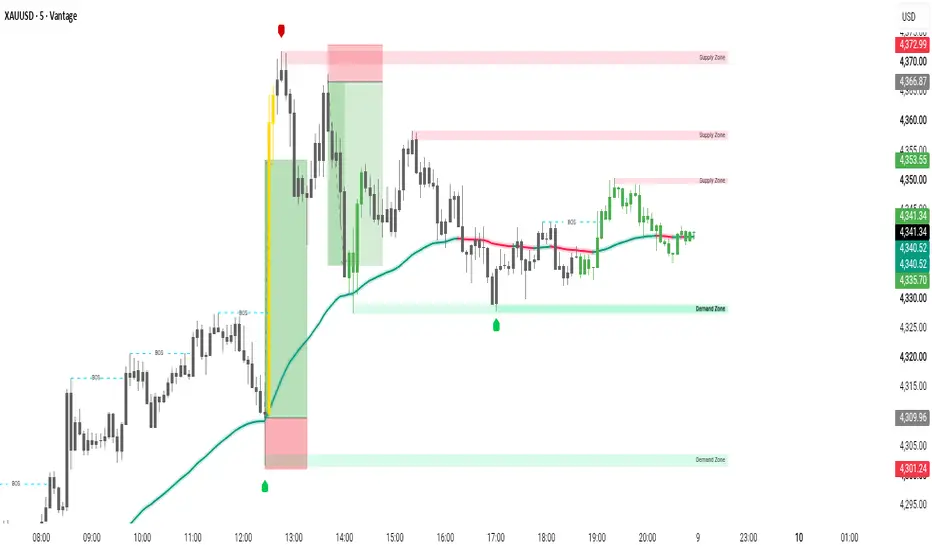
Education Trend | Wizard AcademyEducativ Trend | Wizard Academy
educativ trend is an educational trend-reading module built to teach traders how to identify real market structure, understand trend direction, avoid weak market conditions, and recognize clean pullback locations.
the tool is designed for beginners who want a clear framework, but it also gives advanced traders a structured way to read price action without relying on emotion or random candle reactions.
the main idea is simple:
a trend is not a feeling.
a trend is not only price above or below a moving average.
a trend is a sequence of swing points.
an uptrend is confirmed by:
higher high + higher low
a downtrend is confirmed by:
lower high + lower low
anything else is treated as range, transition, or unclear structure.
main features
confirmed market structure
the indicator detects confirmed swing highs and swing lows, then classifies them as:
HH = higher high
HL = higher low
LH = lower high
LL = lower low
EQH = equal high
EQL = equal low
each swing label includes educational context so the trader can understand what happened and why it matters.
trend state engine
the trend state is decided from structure only.
uptrend = HH + HL
downtrend = LH + LL
range = mixed or unclear structure
this helps traders avoid the common mistake of forcing trend trades inside a range.
ema context
the tool includes two moving averages:
fast ema
slow ema
the slow ema is used as long-term bias.
the fast ema is used as short-term fair value and pullback context.
the moving averages are not treated as the trend definition. they are used as context around the real structure.
bos and choch
the indicator marks important structure breaks:
BOS = break of structure
CHoCH = change of character
a bullish BOS shows continuation above the last confirmed swing high.
a bearish BOS shows continuation below the last confirmed swing low.
a bullish CHoCH appears when a bearish structure is damaged by a break above the last swing high.
a bearish CHoCH appears when a bullish structure is damaged by a break below the last swing low.
pullback module
the tool highlights textbook pullbacks into the fast ema when trend structure and bias agree.
a long pullback setup can appear when:
structure is bullish
price is above the slow ema
price pulls into the fast ema
price closes back above the fast ema
the candle closes bullish
a short pullback setup can appear when:
structure is bearish
price is below the slow ema
price rallies into the fast ema
price closes back below the fast ema
the candle closes bearish
this helps beginners avoid chasing breakouts and focus on better trade locations.
projected swing levels
the last confirmed swing high and swing low can be projected to the right side of the chart.
these levels show what price needs to break next.
close above the last swing high can create bullish BOS or bullish CHoCH.
close below the last swing low can create bearish BOS or bearish CHoCH.
dashboard
the live dashboard gives a quick read of the current market state.
it displays:
trend structure
last swing high
last swing low
price vs slow ema
fast ema vs slow ema
fast ema slope
distance from slow ema
checklist quality
live coaching message
the first title row uses an orange accent for a clean institutional look.
lesson card
the lesson card gives a simple nine-rule framework for reading trends.
it teaches:
structure first
ema second
entry last
do not chase breakouts
pullbacks are cleaner locations
ranges are dangerous for beginners
invalidation matters
glossary card
the glossary card explains the main structure terms directly on the chart.
it includes:
HH
HL
LH
LL
BOS
CHoCH
EQH / EQL
golden cross
death cross
PB
each panel can be moved to different chart positions, including corners and middle placements.
how to use the indicator
step 1: read the trend state
start with the dashboard.
if the dashboard says uptrend, the market has confirmed HH + HL.
if the dashboard says downtrend, the market has confirmed LH + LL.
if the dashboard says range, the highs and lows do not agree.
beginners should avoid forcing trend trades when the dashboard shows range.
step 2: check the slow ema bias
look at price versus the slow ema.
price above the slow ema shows bullish long-term context.
price below the slow ema shows bearish long-term context.
the ema does not define the trend by itself, but it helps confirm whether structure and bias agree.
step 3: check the fast ema pullback zone
the fast ema acts like short-term fair value.
in a bullish trend, price often pulls back into the fast ema before continuing.
in a bearish trend, price often rallies into the fast ema before continuing lower.
the cleanest entries usually come after a pullback, not after chasing a breakout candle.
step 4: watch the last swing levels
the projected swing high and swing low show the next important structure levels.
if price closes above the last swing high, bullish structure is strengthened or a bearish trend is damaged.
if price closes below the last swing low, bearish structure is strengthened or a bullish trend is damaged.
step 5: use bos and choch correctly
BOS is usually continuation.
CHoCH is usually the first warning that a trend may be changing.
a CHoCH is not automatically an entry. it is a warning to stop blindly trading the old trend and wait for new structure.
beginner long example
1. the dashboard shows uptrend
2. the last structure is HH + HL
3. price is above the slow ema
4. the fast ema is above the slow ema
5. price pulls back into the fast ema
6. price closes bullish above the fast ema
7. the indicator marks a pullback long
8. risk can be planned below the most recent higher low
this is a cleaner long setup than buying after a vertical breakout.
beginner short example
1. the dashboard shows downtrend
2. the last structure is LH + LL
3. price is below the slow ema
4. the fast ema is below the slow ema
5. price rallies into the fast ema
6. price closes bearish below the fast ema
7. the indicator marks a pullback short
8. risk can be planned above the most recent lower high
this is a cleaner short setup than selling after a large breakdown candle.
how to read the checklist
the checklist gives a simple structure-quality score.
3 / 3 = textbook condition
2 / 3 = partial condition
1 / 3 = weak condition
0 / 3 = avoid
a textbook condition means structure, ema bias, and alignment agree.
a partial condition means the market is not fully aligned yet.
a weak condition means the setup is not clean.
best beginner settings
fast ema: 20
slow ema: 200
swing left bars: 5
swing right bars: 5
equal high/low tolerance: 0.05 × atr
show structure labels: on
show bos / choch: on
show pullbacks: on
show dashboard: on
show lesson card: on
show glossary card: on
for faster markets
reduce swing left/right bars to 3 or 4.
this creates faster structure detection, but it can also create more noise.
for cleaner structure
increase swing left/right bars to 7, 8, or 10.
this gives fewer swings, but the structure is stronger and easier to read.
tips
do not use moving averages alone as a trend definition.
do not buy only because price is above the slow ema.
do not short only because price is below the slow ema.
wait for structure confirmation.
avoid trading in the middle of ranges.
a higher high alone does not confirm an uptrend.
a lower low alone does not confirm a downtrend.
the best long setups usually come after a higher low.
the best short setups usually come after a lower high.
BOS confirms strength.
CHoCH warns that the previous trend may be damaged.
equal highs and equal lows often act as liquidity zones.
do not chase extended candles far away from the fast ema.
wait for price to return to value.
use the most recent HL or LH as invalidation.
alerts
available alerts include:
uptrend confirmed
downtrend confirmed
trend lost / range
bullish BOS
bearish BOS
bullish CHoCH
bearish CHoCH
textbook pullback long
textbook pullback short
golden cross
death cross
for cleaner alerts, use once per bar close.
important note
this tool is built as an educational structure-reading module.
it is designed to help traders understand trend logic, market structure, pullbacks, continuation, transition, and invalidation.
always use risk management, position sizing, and confirmation from your own trading plan.
Chỉ báo