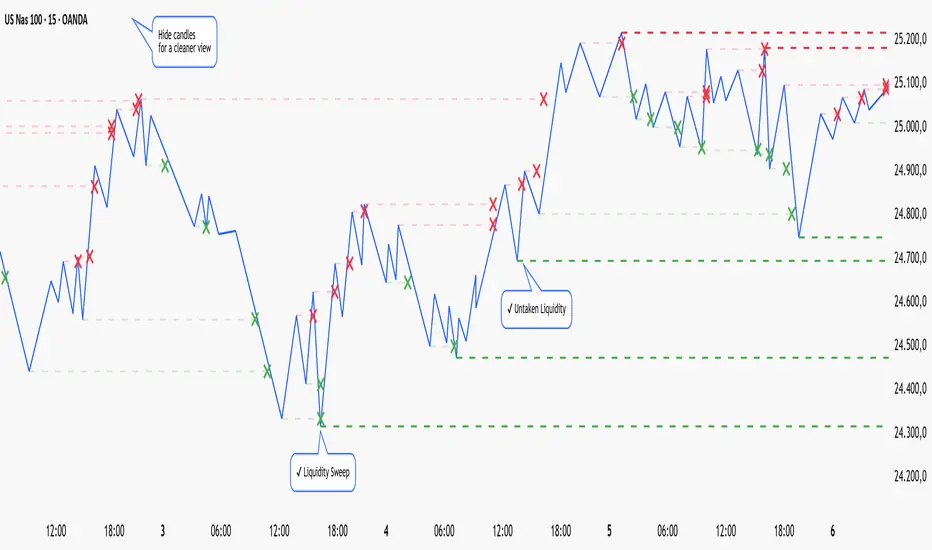
Liquidity Sweep SequenceThis indicator marks stop-hunt sweeps and, more importantly, counts how many
consecutive sweeps have occurred on the same side.
WHAT A SWEEP IS
Traders cluster their stops in predictable places: longs put theirs below the
last swing low, shorts put theirs above the last swing high. Those clusters are
resting liquidity. A sweep happens when price spikes through one of those levels,
triggers the stops, and then closes back on the original side — a wick through,
not a break.
The distinction that matters:
• Close beyond the level = a real breakout, trend continuation
• Close back inside = a sweep, failed breakout, potential reversal
WHY THE SEQUENCE COUNT
A single sweep is often just noise. What I found more useful is when they stack:
the first sweep traps, price fails to reverse, then a second sweep takes out an
even lower low. The second one is where selling pressure is actually exhausted.
The indicator labels these SWEEP, SWEEP², SWEEP³ and so on. The count resets when
an opposite-side sweep appears or when too many bars pass. By default the second
sweep must take out a deeper low (or higher high) to continue the sequence —
otherwise the count restarts at 1.
HOW IT WORKS
1. Swing highs and lows are tracked as liquidity levels using pivots.
2. A level is dropped as soon as price CLOSES through it. Once price closes above
a swing high, that liquidity has already been taken and the level can no longer
produce a sweep signal. This is the single most important filter here — without
it, stale levels from far back generate false signals during trends.
3. A sweep requires: wick through an untouched level, close back inside, a minimum
wick ratio, a minimum reclaim distance, and the bar must be a genuine local
extreme (if the wick does not exceed recent bars, no stops were actually hit).
4. Next-bar confirmation requires the following candle to close in the reversal
direction before the label is drawn.
5. Significance tiering: a sweep is marked "major" only when the wick is the
extreme of the last N bars. Minor sweeps inside ranges are hidden by default.
All labels are drawn on confirmed bars only, so nothing repaints.
HOW I USE IT
My own preference is the 1H chart, entering on SWEEP² — the second sweep in a
sequence. The first sweep tells me the level is being attacked; the second one is
where I act.
This is built for short-term perpetual futures trading and works best there. The
reason is mechanical: perps run 24/7 with no gaps, they are heavily leveraged, and
liquidation clusters are dense and public. Stop hunts on perps are a real, visible
event rather than a metaphor. On instruments with overnight gaps, daily price
limits, or low leverage, a long wick often does not represent a genuine sweep at
all, and signal quality degrades noticeably.
Suggested timeframes: 15m to 4H. Lower is noisy; the daily compresses multi-hour
hunts into a single candle and loses the event.
LIMITATIONS — please read
• This is a mean-reversion tool, not a trend tool. A sweep is by definition a
FAILED breakout, while a trend start is a SUCCESSFUL one. The two are mutually
exclusive, so this indicator will not flag the beginning of a large trend, and
it is not designed to.
• It only detects double-top and double-bottom style reversals. A V-shaped top
that simply prints a new high and falls has no prior level above it to sweep,
so no signal can appear there.
• Signals occur more frequently in ranging conditions. That is inherent to the
concept, not a defect.
• Next-bar confirmation costs one bar of delay. Turn it off for immediacy at the
cost of more failed signals.
• Pivot detection needs bars on both sides, so levels are registered with a lag
equal to the swing sensitivity setting.
• Parameters need adjusting per market and timeframe. On 15m, the major-sweep
lookback should be lowered to roughly 40–60.
SETTINGS WORTH TOUCHING FIRST
• Swing sensitivity — the main tightness control
• Major sweep lookback — how significant a sweep must be to display
• Show 2nd sweep and beyond only — reduces the chart to sequence signals alone
• Show untouched liquidity levels — draws the levels currently being tracked so
you can verify the structure logic yourself
Alerts are included for major sweeps and for the second sweep in a sequence.
This indicator is a visualization and analysis tool. It does not generate buy or
sell recommendations and nothing here is financial advice. Test any approach on
your own before risking capital.
────────────────────────────────────────────────────────────────────
【繁體中文說明】
本指標標記獵殺止損的掃蕩訊號,並且會計算同方向連續掃蕩的次數。
什麼是掃蕩
交易者的停損放在可預測的位置:做多的放在前低下方,做空的放在前高上方。這些成堆
的停損就是「流動性」。當價格刺破那個價位、觸發停損,然後收盤又收回原本那一側,
就是一次掃蕩——是影線穿過,不是真正突破。
關鍵區別:
• 收盤站在價位外側 = 真突破,趨勢延續
• 收盤收回內側 = 掃蕩,假突破,可能反轉
為什麼要算連續次數
單一次掃蕩常常只是雜訊。比較有用的是它們接連出現:第一次掃蕩是陷阱,價格沒能反
轉,接著第二次掃蕩創了更低的低點——第二次才是賣壓真正耗盡的地方。
指標會標成 SWEEP、SWEEP²、SWEEP³。出現反向掃蕩或間隔過久就歸零重算。預設要求第
二次必須創更低低點(或更高高點)才算延續,否則計數從 1 重新開始。
運作方式
1. 用 pivot 追蹤前高前低作為流動性價位。
2. 價格一旦「收盤」穿過某個價位,該價位立刻作廢。收盤站上前高,代表那裡的流動性
已經被吃掉,不再是掃蕩目標。這是本指標最重要的過濾——沒有這一層,久遠以前的
死線會在趨勢中不斷產生假訊號。
3. 掃蕩成立條件:影線穿過未被吃掉的價位、收盤收回、影線佔比達標、收回幅度達標,
且該K棒必須創局部極值(影線若沒超過近期K棒,代表根本沒有停損被觸發)。
4. 隔根確認:要求下一根收盤朝反轉方向,才畫出標籤。
5. 重要度分級:影線必須是近 N 根的極值才標為「主要」。震盪區間的次要掃蕩預設隱藏。
所有標籤都在收K後才繪製,不會重繪。
我自己怎麼用
我個人偏好 1 小時線,在 SWEEP²(連續第二次掃蕩)進場。第一次告訴我這個價位正在被
攻擊,第二次才是我動手的地方。
這支是為短線永續合約設計的,在那裡效果最好。原因是機制上的:永續 24 小時不間斷、
沒有跳空、槓桿高,清算價位密集而且公開。永續上的獵殺止損是實際發生、看得見的事件,
不是比喻。在有隔夜跳空、漲跌幅限制、或低槓桿的商品上,一根長影線常常根本不代表真
正的掃蕩,訊號品質會明顯下降。
建議時框:15 分鐘到 4 小時。更低太雜;日線把數小時的獵殺壓縮成一根K棒,事件本身就
消失了。
限制(請務必閱讀)
• 這是均值回歸工具,不是趨勢工具。掃蕩的定義就是「突破失敗」,而趨勢起點是「突破
成功」,兩者互斥。所以它不會標出大趨勢的起點,也不是為此設計的。
• 只偵測得到雙頂/雙底型的反轉。直接創新高然後下跌的 V 型頂,上方根本沒有前高可
掃,不可能出現訊號。
• 震盪盤中訊號較密集。這是概念本身的性質,不是缺陷。
• 隔根確認會延遲一根。關掉可即時,但假訊號會變多。
• Pivot 需要左右兩側的K棒,所以價位登記會延遲,延遲根數等於靈敏度設定值。
• 參數需依市場與時框調整。15 分鐘線建議把主要掃蕩回看根數降到 40–60。
本指標為視覺化與分析工具,不產生買賣建議,內容不構成投資建議。任何做法請自行驗證
後再投入資金。
Chỉ báo