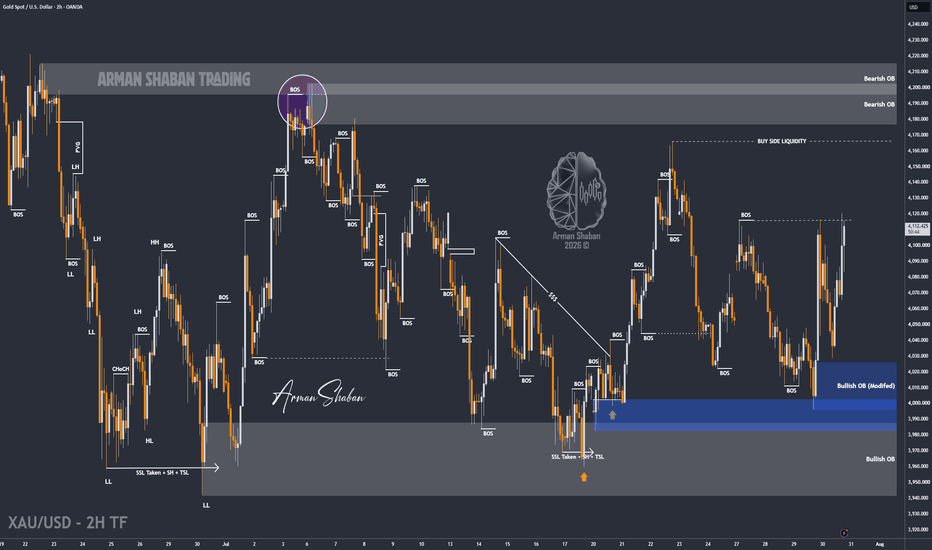
XAU/USD | Gold Invalidates The Bearish Scenario & Reclaims $4100By analyzing the #Gold chart on the 2H timeframe, we can see that after the previous update, price started to move higher and the bearish continuation scenario was invalidated.
The market reacted strongly following Kevin Warsh’s hawkish remarks, the decision to keep interest rates unchanged, and today’s U.S. GDP and PCE data. Together, these developments supported Gold and pushed price toward higher levels.
Currently, Gold is trading around $4113. If buying pressure continues and price manages to stabilize above the key $4100 level over the next four hours, the probability of another bullish move will increase. The next short-term upside targets to monitor are $4120, followed by $4130 and then $4140. For now, the reaction around $4100 remains the main confirmation for this bullish scenario. This analysis will be updated as the market evolves.
Please support me with your likes and comments to motivate me to share more analysis with you and share your opinion about the possible trend of this chart with me !
Best Regards , Arman Shaban
Candlestick Analysis
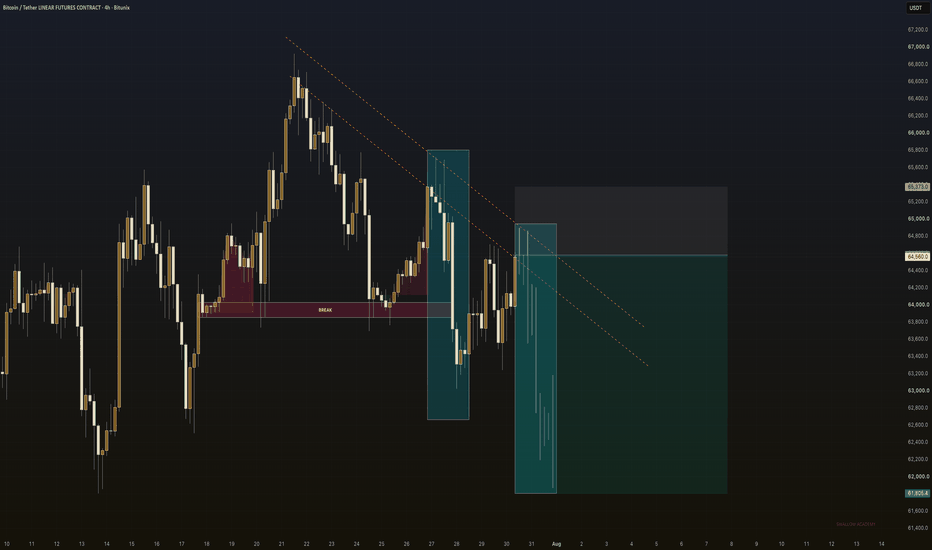
BTCUSDT – Bearish Continuation Below 64,5K, Eyes on 61,8KBTC is repeating a familiar setup, only this time the structure leans firmly in favor of the bears.
Why This Level Matters:
A recent break lower was driven by a strong impulsive candle, followed by a shallow pullback to fill the gaps left behind. Price is now sitting at the 64,557 zone, right where the descending trendline and supply overlap.
Gameplan / Primary Scenario:
Accumulate shorts into this retest and ride the trend lower. We stay in the position as price works down toward 61,805, with room to extend further if momentum accelerates. As long as we hold below the supply zone, the path of least resistance stays down.
If this added value, boost it forward. What are your thoughts?
Swallow Academy
USD/CHF: Pullback From Support LevelThe 📈USDCHF price appears to be overbought following a massive selloff yesterday.
I anticipated that the price would retrace from a significant horizontal support level.
A cup and handle pattern formation and the occurrence of a bullish engulfing candle on an hourly timeframe provide strong confirmation.
The target is 0.8115.
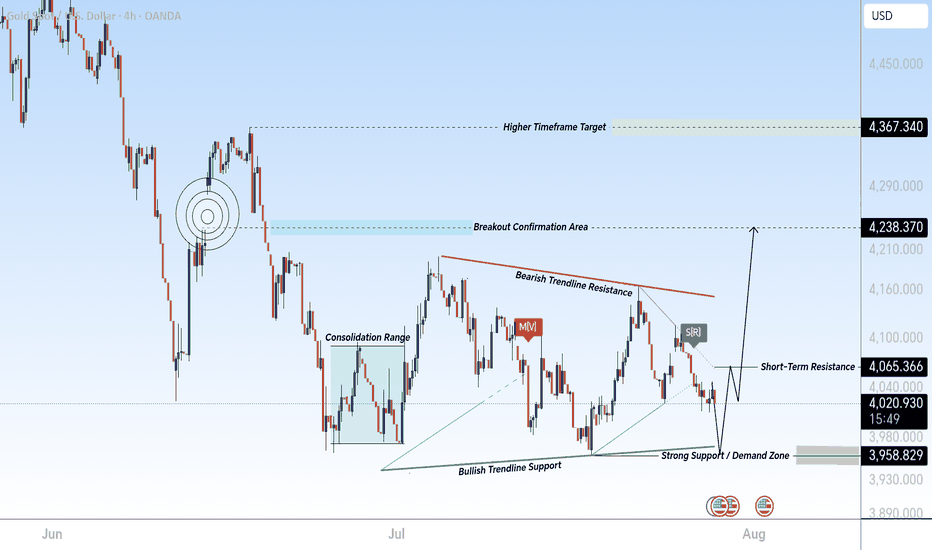
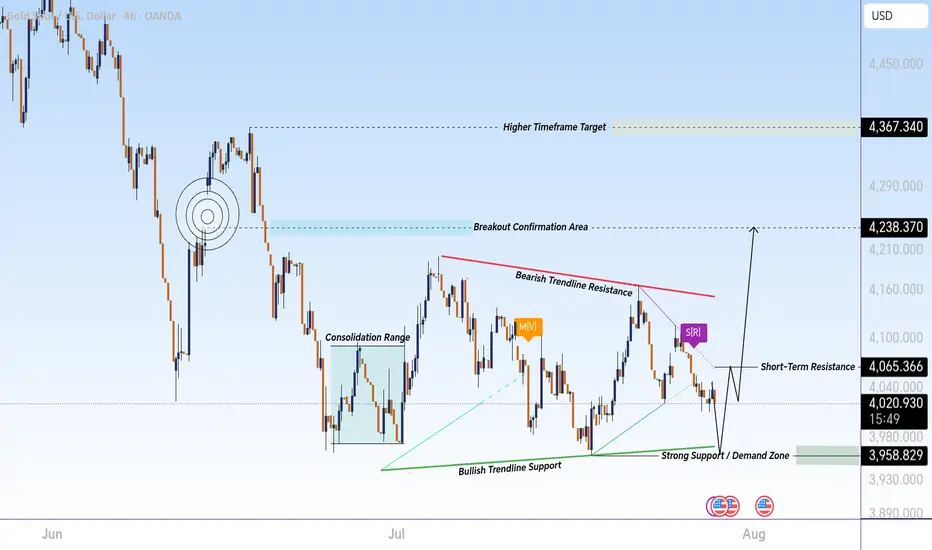
Gold 4H Forecast | 3,958 Support to 4,238 Resistance PathThis XAU/USD (Gold) 4H chart presents a professional price action and market structure analysis, highlighting key trendlines, support and resistance levels, liquidity areas, and a potential reversal scenario.
Gold has been trading inside a corrective structure after a strong bearish move. The chart shows a clear battle between sellers defending the descending resistance trendline and buyers protecting the ascending support trendline. This formation creates a compression zone where price is preparing for a potential breakout.
The red descending trendline represents dynamic resistance, showing where sellers have repeatedly rejected higher prices. A confirmed breakout above this trendline could indicate a shift in short-term momentum and open the way toward higher resistance levels.
The green ascending support trendline represents buyer strength and demand, where price has repeatedly found support. The 3,958.829 area acts as a major liquidity and demand zone, where a possible liquidity sweep could occur before the next expansion move.
Key levels:
3,958.829 — Strong Support / Liquidity Zone
4,065.366 — Short-Term Resistance & Decision Area
4,238.370 — Major Breakout Target
4,367.340 — Higher Timeframe Resistance / Final Target Zone
Market scenario: If buyers continue defending the support zone and price breaks above the descending resistance line, Gold may enter a bullish expansion phase toward 4,238 and 4,367 resistance areas.
However, failure to hold the support zone may lead to further downside and continuation of the corrective structure.
This analysis is created for educational purposes, explaining how traders study trendlines, support/resistance, liquidity zones, market structure, and breakout confirmations before making trading decisions.
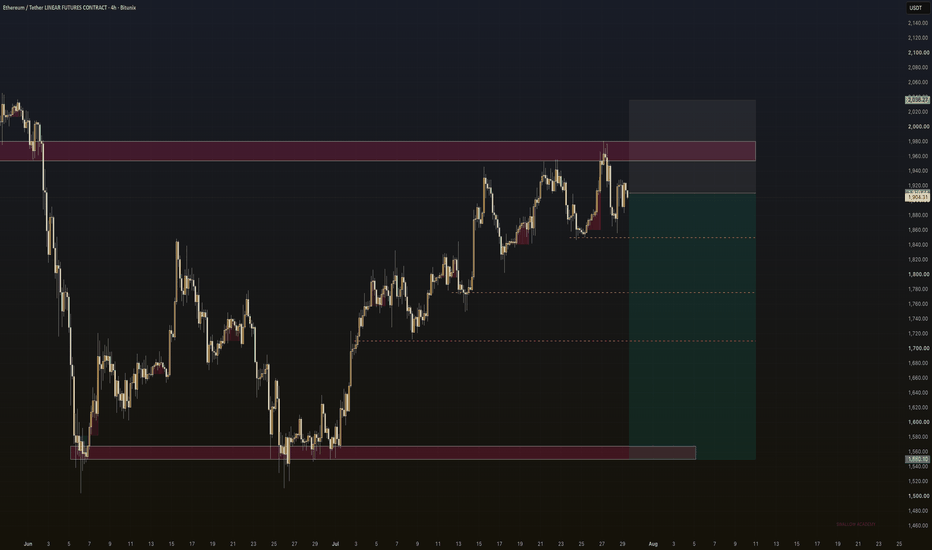
ETHUSDT – Bearish Rejection at 1,980 Supply, Eyes on 1,720 SweepETH tapped the local high supply zone at 1,980, filled the gaps above, and is now set for a move lower.
Why This Level Matters:
Price pushed into the 1,980 supply zone and rejected. With the upside gaps now filled, the path of least resistance points down toward the untested demand below.
Gameplan / Primary Scenario:
Sell any retest of the 1,910–1,980 zone and ride the continuation lower. First target sits at 1,860, followed by the 1,780 shelf, with the deeper draw toward 1,720 where liquidity rests. As long as price holds below 1,980, the short remains in play.
If this added value, boost it forward. What are your thoughts?
Swallow Academy
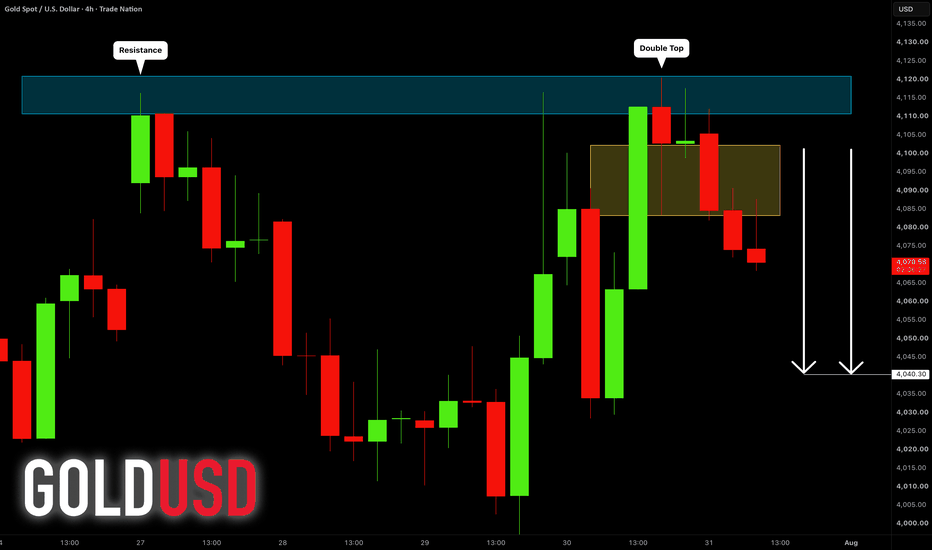
GOLD (XAUUSD): Bearish Continuation
I think that Gold will continue falling after the recent test
of a strong intraday/daily resistance cluster.
The price will likely reach 4040 level soon.
❤️Please, support my work with like, thank you!❤️
I am part of Trade Nation's Influencer program and receive a monthly fee for using their TradingView charts in my analysis.
GBP/USD is showing a bullish breakout from a descending channel📊 GBP/USD MARKET ANALYSIS
Time Frame: 4 Hours (H4)
🟢 Market Outlook: Bullish
GBP/USD is showing a bullish breakout from a descending channel, signaling a potential trend reversal. The pair is now approaching a key support area around 1.33100, where buyers may look for fresh long opportunities if bullish price action is confirmed.
📍 Buy Zone:
✅ 1.33100 (Support Area)
🎯 Technical Targets:
🥇 Target 1: 1.34300
🥈 Target 2: 1.35400
🥉 Target 3: 1.36350
Trading View:
- Bullish breakout indicates strengthening buying momentum.
- Holding above 1.33100 keeps the bullish outlook intact.
- Wait for confirmation at the support zone before entering and always follow proper risk management.
⚠️ Disclaimer: This analysis is for educational purposes only and is not financial advice. Always trade according to your own strategy and risk management.
#GBPUSD #Forex #ForexTrading #TechnicalAnalysis #PriceAction #Bullish #SupportResistance #Trading #MarketAnalysis
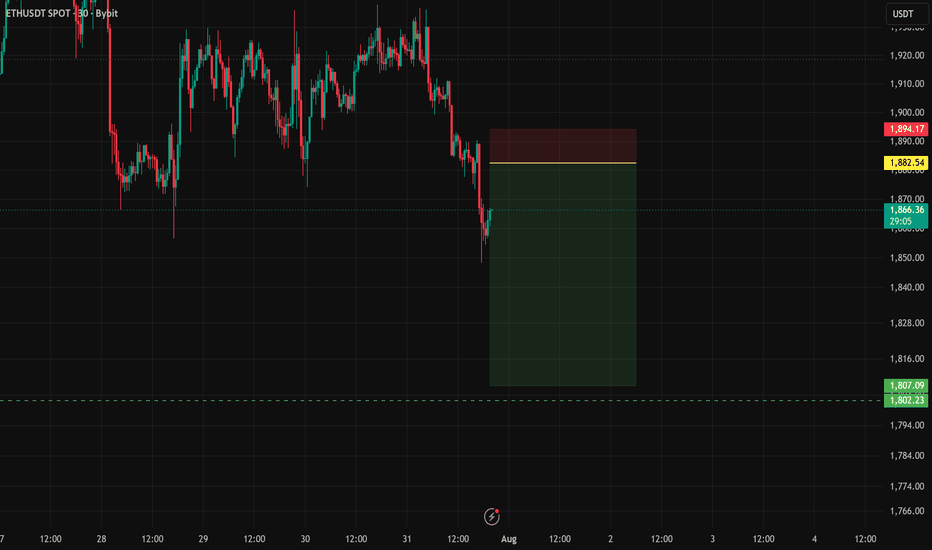
ETHUSDT | High R:R Short Setup | 20x Leverage TradeAfter a strong bearish impulse, ETH is showing a relief bounce into a potential resistance zone. As long as price remains below this area, I see a favorable opportunity for another short position.
Trade Plan
Entry: Around 1865
Stop Loss: 1882.5
TP1: 1807
Final Target: Around 1802
I'll manage this trade according to price action. If buyers reclaim the stop-loss area, this bearish setup will be invalidated.
Risk Management
I'm taking this trade with 20× leverage.
Estimated loss if Stop Loss is hit: ~12%
Estimated profit if the final target is reached: ~80%
As always, protecting capital comes first. If market conditions change, I'll update this trade accordingly.
This is my personal market analysis, not financial advice.
EURCHF: Pullback Trade From Support 🇪🇺🇨🇭
EURCHF will likely bounce after a test of a strong intraday support.
A cup & handle pattern on an hourly time frame provides a strong confirmation.
Goal - 0.9308
❤️Please, support my work with like, thank you!❤️
I am part of Trade Nation's Influencer program and receive a monthly fee for using their TradingView charts in my analysis.
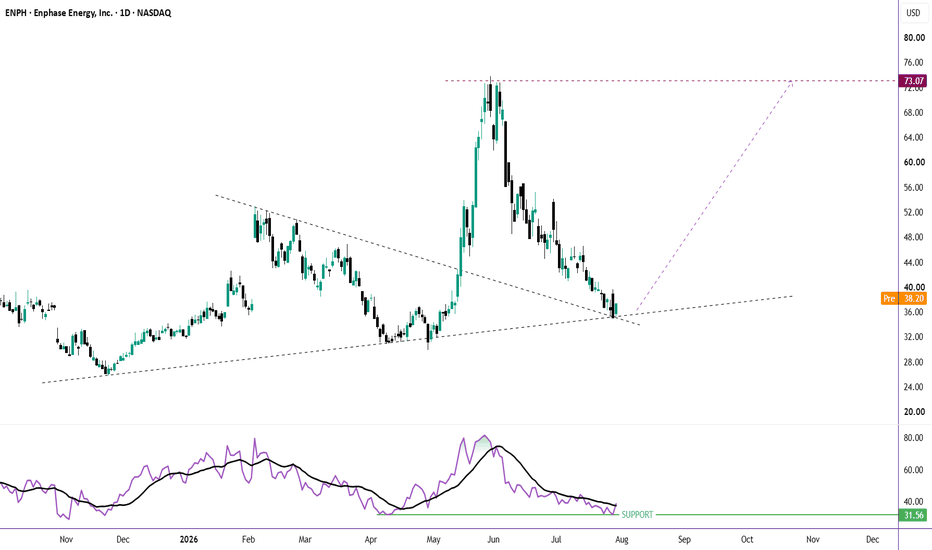
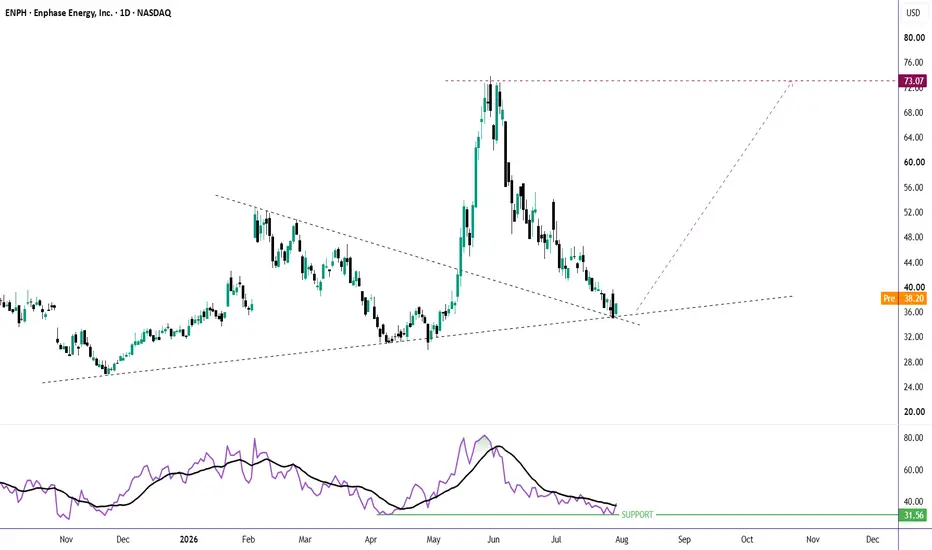
ENPH-Bullish Harami Pattern at Trendline- Explosive Rally Ahead?Enphase has erased most of its vertical rally with a swift V-shaped correction, bringing price right back to a technically important area.
The chart is now testing the previously broken descending trendline, which has the potential to flip from former resistance into new support. At the same time, price is respecting a newly formed ascending trendline, forming bullish harami pattern, creating a confluence zone where buyers are expected to defend.
Adding to the bullish case, the RSI has formed a double bottom (with early signs of bullish divergence), suggesting downside momentum is fading even as price revisits support.
This is a key decision point:
✅ Previous trendline breakout is being retested.
✅ Rising trendline support remains intact.
✅ RSI shows a double bottom / developing bullish divergence.
✅ Risk-to-reward improves significantly if support continues to hold.
If buyers step in here, this could mark the end of the correction and the beginning of the next recovery leg.
Invalidation:
A sustained daily close below the ascending trendline would weaken the bullish structure and increase the probability of further downside.
Markets often reward patience. Sometimes the best opportunities come when a strong trend pauses, shakes out weak hands, and successfully retests a major breakout level.
Long trade
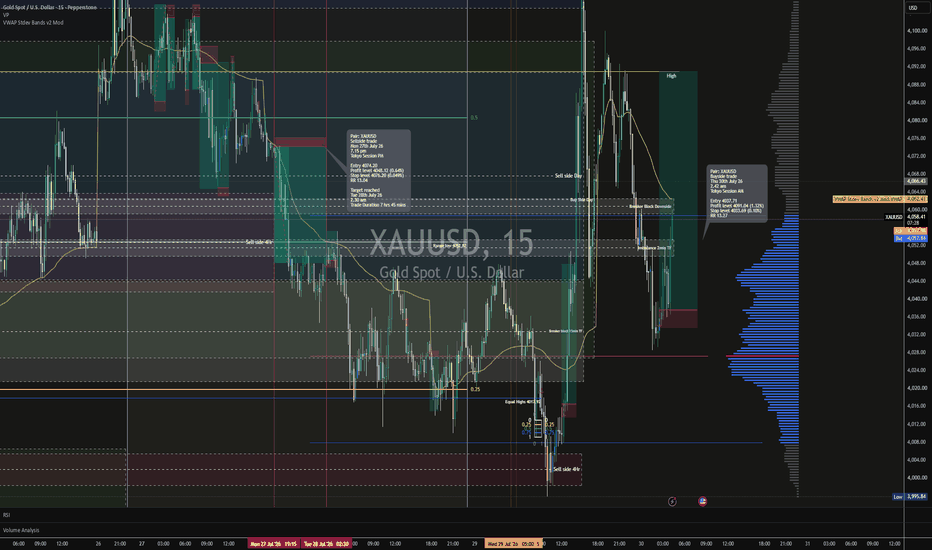
Pair: XAUUSD
Timeframes: 1D / 4H / 15M / 2M
Current Area: 4016–4017
Bias: 🟢 Conditional Buyside Recovery
Model: Sell side delivery → discount hold → reclaim → upside rotation
Status: Active recovery, but not full HTF reversal yet
🧠 SNAP Bias
🟢 Bias: Buyside while price holds above 3976–3985.
⚠️ Full bullish reversal only confirms above 4040–4060, then 4100+.
Key Levels
Current reaction zone:
4010–4022
Immediate support:
4005–3995
Important reclaim base:
3976–3985
Primary discount reaction zone:
3959–3953.40
Deeper backup buy level:
3939.09
Hard failure level:
3942.36
Major downside liquidity:
3888.54 equal lows
Upside targets:
4022
4040
4060–4070
4100
4202.31 higher dealing range high
GBPUSD: FVG Trade 🇬🇧🇺🇸
GBPUSD will likely continue falling to partially fill a fair value gap.
I expect a bearish continuation to 1.3315
❤️Please, support my work with like, thank you!❤️
I am part of Trade Nation's Influencer program and receive a monthly fee for using their TradingView charts in my analysis.
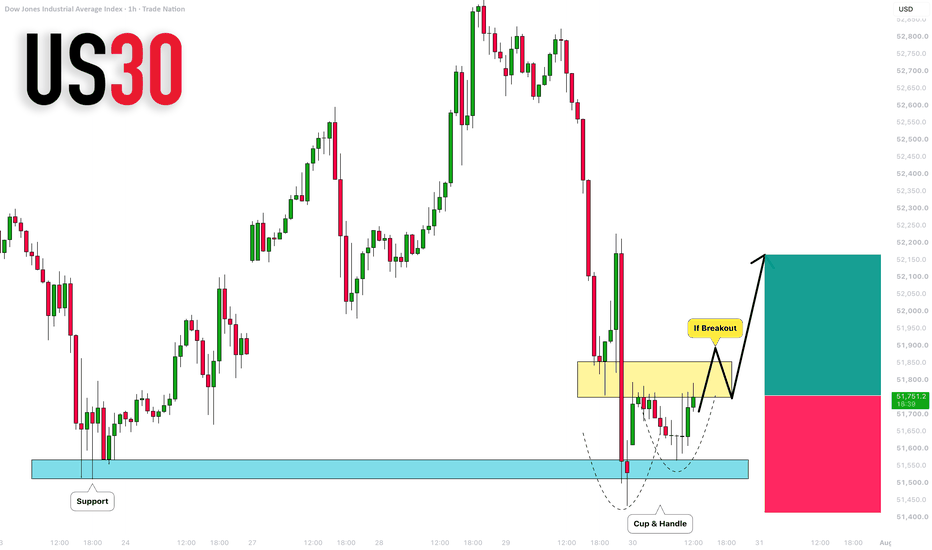
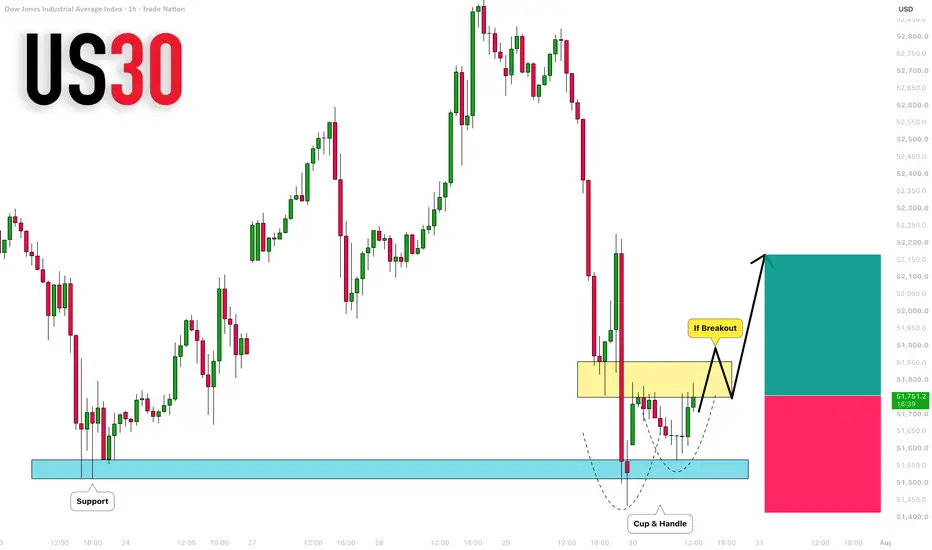
DOW JONES INDEX (US30): Potential Buying Opportunity Explained
I think that US30 may pull back from a key horizontal support cluster.
Your strong bullish confirmation will be a breakout and an hourly candle
close above a horizontal neckline of a cup & handle pattern on an hourly time frame.
An hourly candle close above 51,855 will confirm a violation.
A bullish continuation will be expected to 52,165 then.
❤️Please, support my work with like, thank you!❤️
I am part of Trade Nation's Influencer program and receive a monthly fee for using their TradingView charts in my analysis.
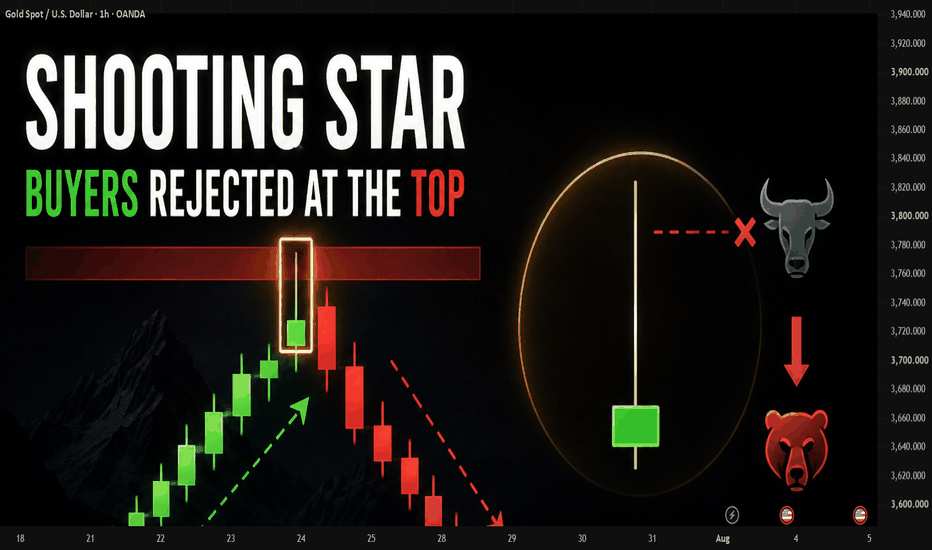
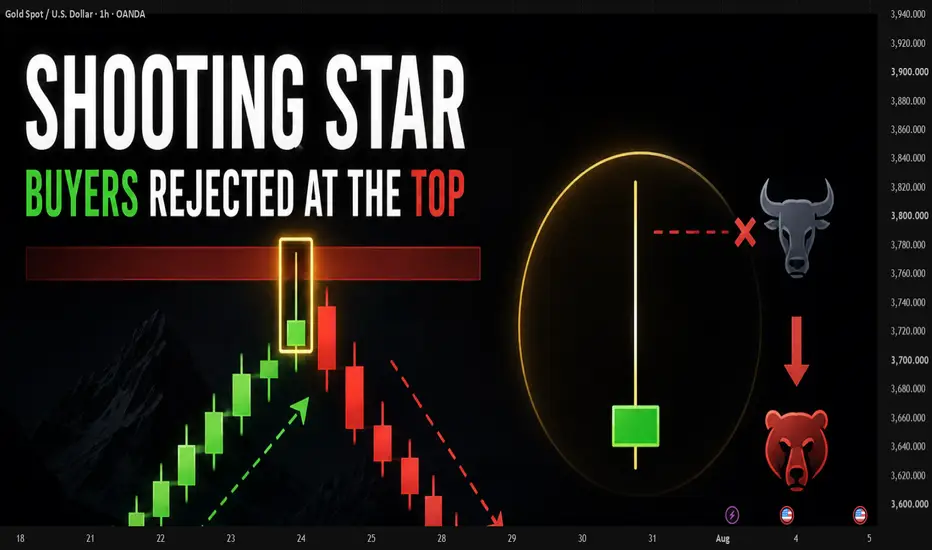
Shooting Star — When Buyers Get Overpowered at the TopShooting Star is a pattern that typically appears at short-term tops or after a rally.
Its defining feature is a small body positioned near the bottom, a long upper wick, and a very short or virtually nonexistent lower wick. The longer the upper wick, the clearer the rejection signal.
The significance of a Shooting Star is that buyers tried to push price higher, but couldn't hold that level. Sellers then fought back and pulled the close down near the low of the candle.
This suggests buying pressure is starting to weaken, especially if the candle forms at a resistance zone.
But like other candlestick patterns, a Shooting Star shouldn't be used in isolation. If it appears within a very strong uptrend without a clear resistance zone nearby, the signal may not be strong enough to conclude a reversal.
How to identify a quality Shooting Star:
Appears after a rally.
Located at resistance or a key price zone.
Has a long upper wick showing strong rejection.
Followed by a bearish confirmation candle or price breaking below the Shooting Star's low.
A common mistake is selling the moment a long upper wick appears. Without confirmation, the market can still continue higher after a brief pause.
A Shooting Star doesn't guarantee price will fall. It only shows that at a higher price level, buyers were rejected. Traders should treat this as a warning signal, then wait for further confirmation from price action.
Reading candles correctly isn't about memorizing pattern names — it's about understanding which side is in control of the market at a key location.
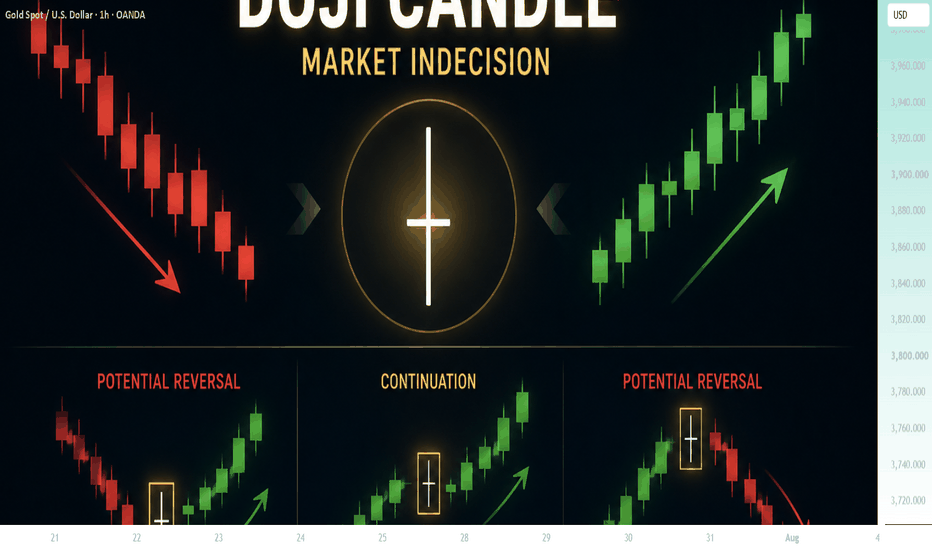
Doji Candlestick — When the Market Starts to HesitateThe Doji candle is one of the most fundamental patterns in Price Action. Its defining feature is that the opening and closing prices are almost identical, resulting in a very small or virtually nonexistent body.
The significance of a Doji isn't whether it's bullish or bearish — it lies in the hesitation it represents.
During that session, buyers tried to push price up, and sellers tried to pull it down, but ultimately neither side truly gained control of the market. Price closing near its opening level reflects a temporary balance between supply and demand.
That said, a Doji shouldn't be read as an immediate reversal signal.
A Doji appearing in the middle of a sideways range usually carries little value. But when it shows up after a strong uptrend, it can be a warning that buying pressure is stalling. Likewise, when it appears after an extended downtrend, it may suggest selling pressure is starting to fade.
To use a Doji effectively, context matters:
Is the Doji forming at support or resistance?
Was the market trending up or down beforehand?
Is there a confirmation candle following the Doji?
Does price break out of this zone of hesitation?
A common mistake is jumping straight into a reversal trade the moment a Doji appears. In reality, a Doji only tells you the market is slowing down — the actual direction still needs to be confirmed by the candle that follows.
Simply put: a Doji isn't a signal to enter a trade right away. It's a cue for traders to watch more closely, because the market may be preparing for a shift in character.
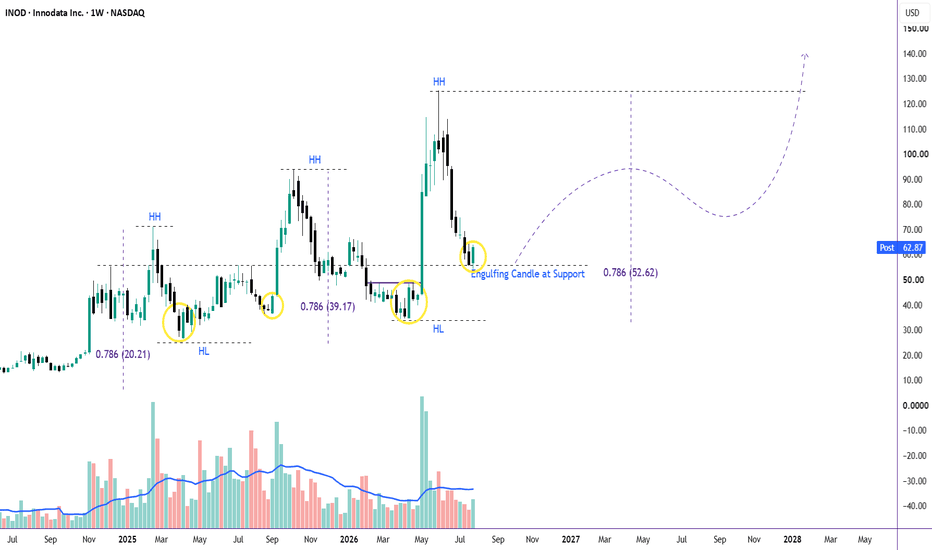
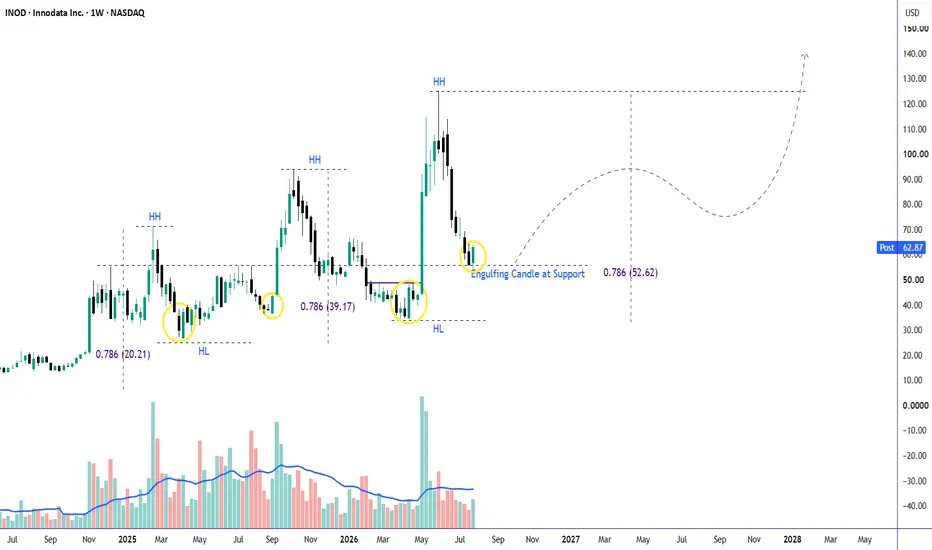
INOD: History Rhyming Again? The 78.6% Retracement PatternNot every correction is the beginning of a new downtrend.
Sometimes, it's simply the market resetting before the next impulse higher.
Looking at INOD's weekly chart, an interesting pattern keeps repeating.
🔄 A Familiar Cycle
Over the past several major advances, price has consistently followed a similar sequence:
✅ Strong impulsive rally
📉 Deep correction toward the 78.6% Fibonacci retracement
🟢 Weekly bullish engulfing candle near support
📈 Higher rebound volume
🚀 New Higher High
This behavior has now appeared multiple times.
📍 Why 78.6% Matters
The 78.6% retracement is often the deepest pullback that still preserves the broader uptrend.
While many traders expect reversals around the 50% or 61.8% levels, strong momentum stocks frequently shake out late buyers before resuming higher.
INOD has repeatedly respected this area during previous corrections.
🟢 The Current Setup
Price has once again retraced close to the 78.6% Fibonacci level, where buyers stepped in with a bullish weekly engulfing candle.
Just as importantly:
📊 Rebound volume is beginning to expand, echoing previous bottoms.
That combination suggests buyers may once again be defending this historical demand zone.
🎯 What Happens Next?
If history continues to rhyme, this area could become another Higher Low, setting the stage for the next impulsive advance.
The first objective would be a retest of the previous Higher High near 125.
A successful breakout above that level would confirm another leg higher and continue the long-term uptrend.
❌ Invalidation
A decisive weekly close below the current support zone and sustained trading beneath the 78.6% retracement would weaken this historical pattern and increase the probability of a deeper structural correction.
🧠 Key Takeaway
Markets rarely move randomly.
When a stock repeatedly reacts at the same level with the same combination of price action and volume behavior, it deserves attention.
History never repeats perfectly—but it often rhymes.
⚠️ This analysis is for educational purposes only and reflects my interpretation of price action and market structure. It is not financial advice. Always manage risk and conduct your own research.
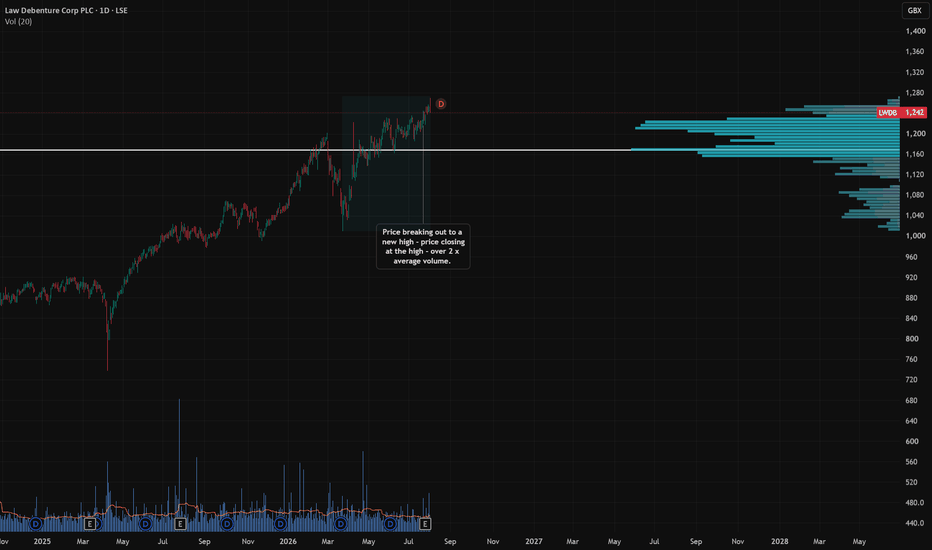
LWDB breakout new 52wk high on 2.2x volume could signal buyers?Not one I’ve covered before, but it caught my eye for two clear bullish signals. Last Wednesday price broke out to a new 52 week high, closing at the high of the day. Volume came in at 2.2 times the average, showing decent effort pushing through any sellers left at that level.
Today price gapped up on solid volume but has since fallen back on the day. I would still expect genuine momentum to keep this on its upward trajectory.
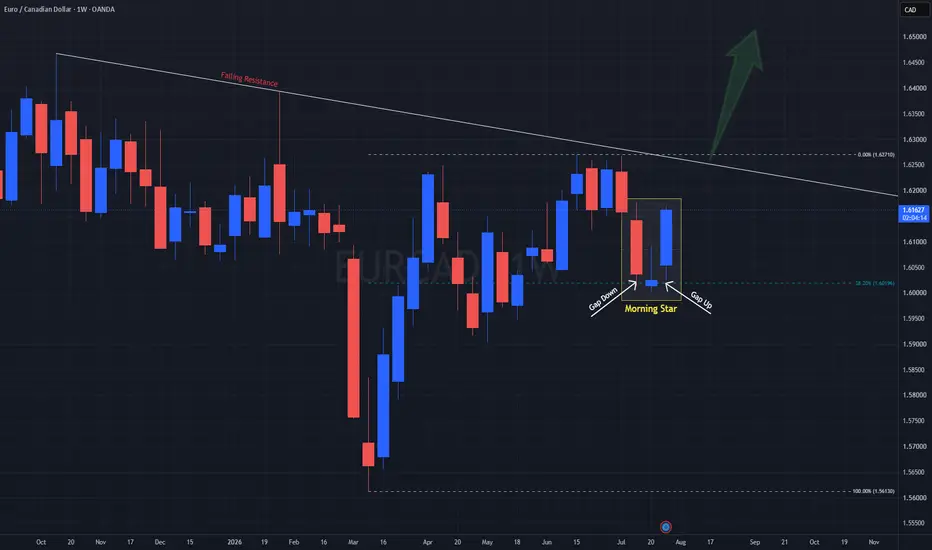
Morning Star Rises On EURCADHere on the Weekly for OANDA:EURCAD , price has formed a strong Bullish reversal pattern called a Morning Star at the 38.2% Retracement Level! This pattern consist of:
1) Large Bearish Candle
2) Small Bullish -or- Doji Candle
3) Large Bullish Candle
There are a couple rules this pattern must follow as well, which are:
- There MUST be a Gap Down from the Close of the First Candle to the Close of the Second Candle.
&
- There MUST be a Gap Up from the Close of the Second Candle to the Open of the Third Candle.
We can see both these rules have been met and the Third Candlestick being a Large Bullish Candle is the confirmation that price is reversing!
As the week comes to an end, we can see price is looking to Close close to the High of the First Candlestick in the pattern so we should expect price to remain Bullish into the coming weeks.
The next area of Resistance will come at the Falling Resistance shown as the Trendline above and if price is able to make a Breakout of that, we could be looking at OANDA:EURCAD possibly going higher!
Fundamentally, both the ECB and BOC HELD Interest Rates this past month, but current Inflation readings could change this story going forward with EUR Inflation having been holding steady while CAD Inflation saw some decline creating an imbalance:
EUR-
CPI (y/y) = Actual - 2.8%/ Forecast - 2.8%/ Previous - 2.8%
Core CPI (y/y) = Actual - 2.4%/ Forecast - 2.4%/ Previous -2.4%
CAD-
Median CPI (y/y) = Actual - 1.9%/ Forecast - 2.1%/ Previous - 2.1%
Trimmed CPI (y/y) = Actual - 1.8%/ Forecast - 2%/ Previous - 2%
Common CPI (y/y) = Actual - 2.6%/ Forecast - 2.5%/ Previous - 2.7%
Today, Friday July 31st, CPI Flash y/y and Core CPI Flash y/y for EUR released and showed a .1% increase in Inflation with CAD having a GDP m/m print of a decrease by .3% which helped influence the current rise in price on PURPLETRADING:EURCAD.
This could lead the ECB to look for more Holds or Hikes with BOC potentially looking for Cuts and this scenario would Strengthen the EUR and Weaken the CAD!!
NY Open Strategy 3h Candle🚀 **Just Dropped: NY Opening 3H Strategy!** 🗽🔥
Are you trading the New York session open and looking to take the guesswork out of your routine? I just published a brand-new indicator on TradingView designed to automate institutional opening ranges and liquidity sweeps right out of the box!
Here is what it does for your daily workflow:
* **The 3H Reference Range:** Automatically maps the High, Low, and 50% midpoint from the early morning block (06:00 - 09:00 NY).
* **Manipulation Tracking:** Captures the initial breakout during the first hour of the open to define your bias (**LONG** or **SHORT**).
* **Auto-Calculated Executions:** Instantly plots your **Entry**, **Stop Loss**, and customizable **Risk/Reward Take Profit** lines.
* **Live Metrics Panel:** Tracks your completed trades, Win Rate, and results in real time right on your chart.
Built for precision on 1m charts to help you tackle the NQ/ES open like a pro.
Head over to TradingView, check it out, and let me know how it upgrades your daily NY open routine! 👇📉📈