Short
Short
$XAUUSD | Is Wave IV Taking Shape?Gold’s larger structure is currently at a critical stage.
At this point, only a decisive break above the current all-time high, followed by a clearly impulsive structure, can confirm the continuation of the broader bullish trend. A brief breakout alone is not enough — the internal structure of the move after the breakout is equally important.
Until then, the main priority is to observe price behavior and evaluate the possibility of a corrective structure developing.
According to the Guideline of Alternation between Waves II and IV, Wave IV is not expected to necessarily resemble Wave II in form, depth, or duration. Therefore, the upcoming correction may be small or large, shallow or deep, fast or time-consuming. It may also develop into a sideways or more complex structure.
However, within the current scenario, any corrective pattern that develops is initially being treated as Wave B of a Classic Zigzag — a movement that may become part of the larger process of completing Wave IV of the higher degree.
For this reason, a bullish move on lower time frames does not necessarily mean that a new bullish trend has begun. Within the larger structure, that same move may represent only one part of a corrective pattern.
I have included the daily analysis below to demonstrate the value of understanding the Elliott Wave Principle from a structural perspective. The purpose of Elliott Wave is not simply to predict the next price move.
The goal is to understand where the market is positioned within its structure, which pattern is developing, and which scenario remains valid.
The Elliott Wave Principle is not a tool for predicting the future. It is the language of market structure.
The market has not given its final answer yet.
Follow the structure — not the excitement.
Research never ends.
– Patterns whisper. I listen. –
Mr. Nobody 🎧📊
Gold Spot / U.S. Dollar
May 17
XAUUSD Daily: Whispers of the Wave – Extension Confirmation & Ma
Long 
Short 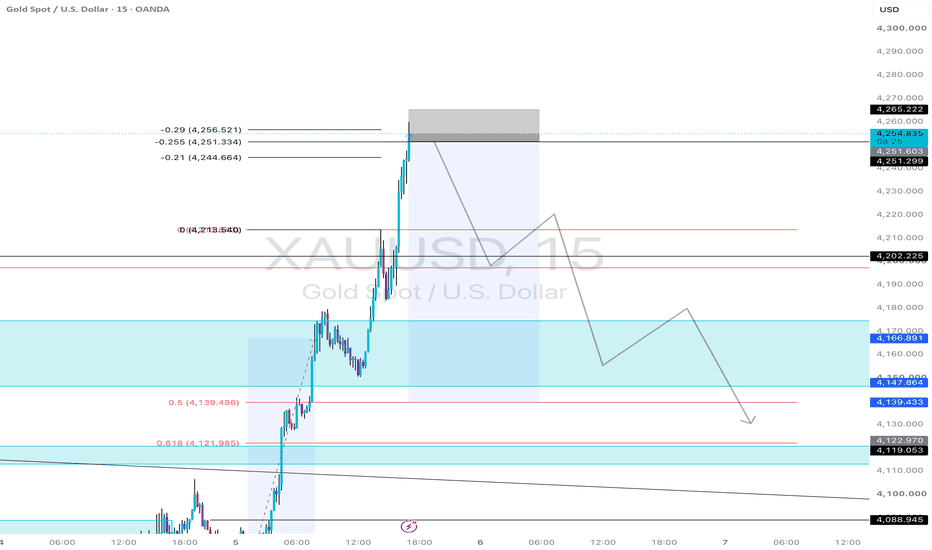
Silver (SI1!) | Elliott Wave Structure and the Paths AheadSilver (SI1!) | Elliott Wave Structure and the Paths Ahead
Silver’s long-term structure remains focused on the aggressive Elliott Wave scenario, shown by the blue path.
Under this count, Silver may have completed a major Wave 1 at the 2011 peak, followed by a deep and complex Wave 2 correction. The current advance may now be the early stage of a larger Wave 3.
However, a bullish structure does not mean price must move higher without corrections. From here, Silver may form a small short-term correction or develop a larger and more complex corrective pattern. The structure, depth, and relationship of that correction to the previous impulsive advance will help determine the more probable path.
Gold and the U.S. Dollar Index (DXY) may provide additional context. Silver often moves positively with Gold and inversely with DXY, but Silver’s own price structure remains the primary basis for this analysis.
Previous Weekly Analysis — Published May 17 | TradingView Editor’s Pick
This previous analysis is not included as proof of a guaranteed forecast. It shows how Elliott Wave rules and guidelines can help organize market structure, define probable paths, and follow price as new information develops.
A break above Silver’s historical peak may provide important confirmation of the bullish market structure. Until then, the wave count will continue to be evaluated through price behavior, wave relationships, Fibonacci levels, channels, and clearly defined validation or invalidation points.
The blue path remains the aggressive scenario under consideration. The black path represents the more conservative alternative, allowing for a broader corrective development before the next major advance.
Elliott Wave does not predict the future with certainty. It provides a structured framework for identifying probable paths and adapting to the market as new price information appears.
Price is the result; structure reveals the probable paths.
— Mr. Nobody | Elliott Wave Principle  Long
Long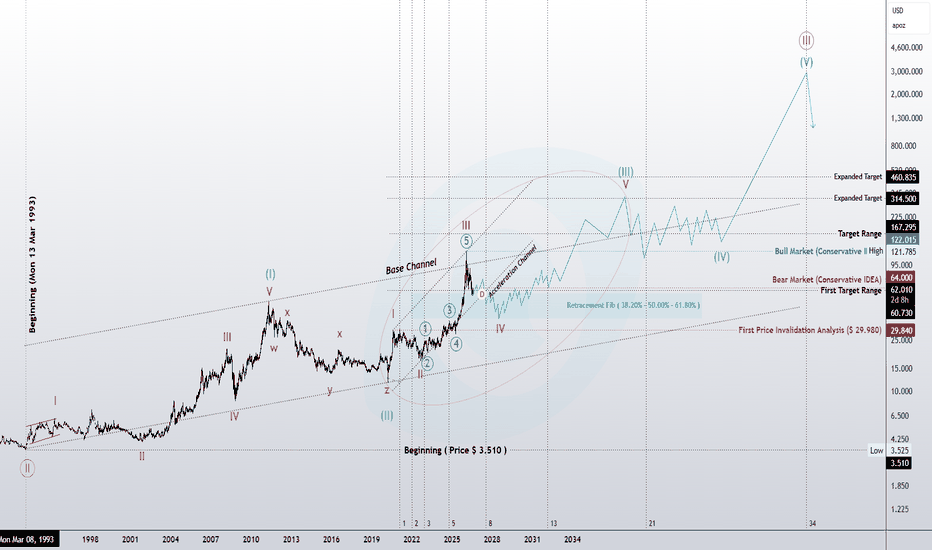
How to Trade PO3 with Multiple Time Frames Analysis (Power of 3)
Today, I will teach you how to use Power of 3 model Po3 with multiple time frame analysis on Forex Gold.
I will break down a complete step-by-step trading strategy with examples.
You will learn the best time frames to use, an easy way to spot manipulations, and an accurate entry signal.
Take notes, and let's get started.
The most effective and easiest way to use the Power of 3 concept is trend trading.
Look for the following price action on a daily time frame:
The market should update higher highs and higher lows to confirm an uptrend.
First, we should wait for a confirmed bullish break of structure BoS.
Then, we should wait for the start of a correctional movement or a retracement.
We will use Power of 3 Po3 model to predict its completion and buy the market after a pullback.
When the market starts a correction, use a 4H time frame.
On a 4h time frame, each impulse and retracement leg that you identified on a daily time frame will look like a sequence of multiple minor bullish and bearish movements.
In fact, a correctional movement that you see on a daily time frame will be a minor bearish trend on a 4H time frame.
To confirm the completion of this correction and the resumption of a global trend, we will look for Power of 3 model.
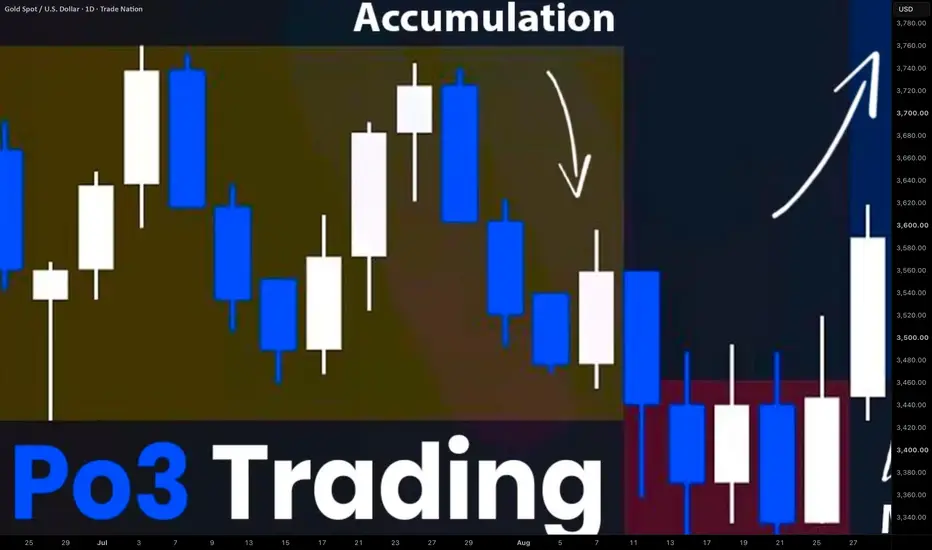
First, the market should start accumulation within a horizontal range.
Then, a manipulative price movement should follow with a bearish movement going below the lows of the range.
Your strong bullish signal will be a consecutive bullish movement and a breakout of the highs of the accumulation range.
This event will confirm the completion of a correction.
A strong bullish wave will likely follow, and the price will likely reach the current high with a highly probable consecutive bullish break of structure.
Set your buy limit order on a retest of a broken resistance of the range.
Set stop loss below the lows of the range.
Your take profit will be based on the current high.
GBPCHF is trading in a strong uptrend on a daily time frame.
We see a confirmed bullish break of structure with a consecutive pullback.
On a 4H time frame, we see a valid Po3 model with an accumulation within a horizontal range, a manipulation below its lows, and a distribution with a violation of the highs of the range.
This model confirms that a minor bearish trend on a 4H time frame is violated. It indicates a highly probable resumption of a global bullish trend.
That's how a trading position should look using this trading our trading strategy.
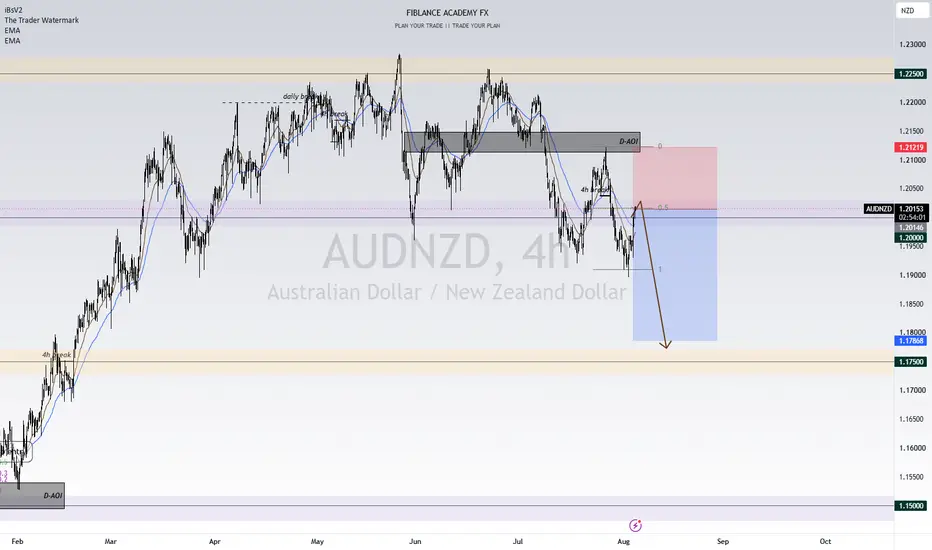
If you see that a forex pair is trading in a downtrend on a daily time frame, consistently updating lower highs and lower lows, patiently wait for a bearish break of structure.
Then, let the market start a corrective movement.
Use a 4H time frame to confirm its completion with Power of 3 model.
Look for the start of a consolidation and accumulation in a minor bullish trend on a 4H.
Then, wait for a manipulation and a bullish movement above the highs of a consolidation range.
Your final confirmation will be a breakout of the lows of the range and a 4H candle close below.
This event will confirm a violation of a minor bullish trend.
A strong bearish wave will likely follow, and the price will likely reach the current low with a highly probable consecutive bearish break of structure.
Set your sell limit order on a retest of the broken support of the range.
TP will be based on the current low.
Stop loss will be above the highs of a manipulation.
USDCHF is strongly bearish on a daily time frame.
We see a valid bearish BoS and a pullback.
To predict the start of a new bearish wave, we will look for Po3 model on a 4H.
That is how it looks.
Our signal to sell is a breakout and a 4H candle close below the support of an accumulation range.
Entry should be on a retest of a broken support of the range.
TP based on the current low.
SL above the highs of a manipulation.
And the price reached the goal.
Power of 3 Po3 model works best in trend trading.
A combination of a daily and 4h time frame analysis will help you accurately spot an entry signal.
❤️Please, support my work with like, thank you!❤️
I am part of Trade Nation's Influencer program and receive a monthly fee for using their TradingView charts in my analysis.
Education 
XAUUSD - Will Gold Continue to Rise?Gold is trading above the EMA200 and EMA50 on the 4-hour timeframe and is trading in its ascending channel. It should be noted that this upward trend is confirmed on the upper timeframe and there is a potential to reach the target of $4,300.
However, it should be noted that buying trades do not have a good reward-to-risk ratio at this price and you can enter buying trades in gold corrections, these corrections can occur on the bottom of the channel or the midline of the ascending channel.
The global gold market extended its rally for a third consecutive session, successfully maintaining its position above the key $4,100 level. Recent reports also suggest that the likelihood of a temporary agreement between the United States, Iran, and Oman to reopen the Strait of Hormuz and restore the ceasefire has increased.
Although lower oil prices and a relative easing of tensions in the Middle East would normally reduce demand for safe-haven assets such as gold, declining expectations for a Federal Reserve interest rate hike in September have allowed the precious metal to maintain its upward momentum.
Nevertheless, rising U.S. Treasury yields and the continued strength of the U.S. Dollar Index (DXY) remain key headwinds for non-yielding assets like gold. At the same time, any shift in geopolitical tensions in the Middle East—particularly involving the United States, Israel, and Iran—continues to serve as a major catalyst for safe-haven inflows.
Meanwhile, large financial institutions continue to expand their physical gold holdings as a hedge against currency depreciation and geopolitical uncertainty. For example, Tether added approximately 14 metric tons of gold to its reserves during the second quarter of 2026.
That said, the pace of aggressive gold purchases seen in late 2025 and early 2026 has moderated and returned to a more balanced level. Even so, central banks continue to accumulate gold at a robust pace over the long term, with countries such as Poland, China, and France remaining among the world's largest official gold holders.
Long 
 Short
Short
AUD/USD Weekly | Two Valid Elliott Wave ScenariosAUD/USD Weekly Chart | Elliott Wave Principle
The weekly structure continues to support two valid scenarios for the larger-degree Wave (B). Until the market provides additional evidence, both scenarios remain valid under the rules and guidelines of the Elliott Wave Principle.
Since this chart represents the relative value of the Australian Dollar against the U.S. Dollar, prolonged one-directional trends are generally less common than in many other markets. Monetary policy, interest rates, inflation, capital flows, and broader macroeconomic conditions from both economies often contribute to the development of complex and time-consuming corrective structures.
🔹 Aggressive Idea (Turquoise) | Primary Scenario
The primary view assumes that the market is developing a larger-degree sideways correction.
At this stage, the main focus is the red-circled area. The initial expectation is for a three-wave corrective structure, most likely a Zigzag. However, as the structure evolves, the possibility of a more complex corrective pattern cannot be ruled out.
For now, the objective is simply to observe the development of this three-wave correction before drawing further conclusions about the larger structure.
🔹 Conservative Idea (Gray)
The conservative scenario gains strength only if the expected move inside the red-circled area develops into a five-wave structure rather than remaining corrective.
If those five waves unfold as a Leading Diagonal, they may represent Wave (A) of a Zigzag. That would then be expected to be followed by a corrective Wave (B) and finally Wave (C) to complete the Zigzag.
Should this sequence unfold, the probability of a larger-degree Double Zigzag increases significantly, with Wave (Y) potentially developing in a manner similar to Wave (W).
📌 The key distinction between the two structures is that in Wave (W), Wave (C) completed as an Ending Diagonal. In this scenario, however, the expectation is for Wave (A) to begin as a Leading Diagonal, followed by a Wave (B) correction before Wave (C) completes the Zigzag.
🎯 Current Focus
At this stage, the red-circled area is the most important part of the analysis.
If the market produces only a three-wave correction, the aggressive scenario remains the preferred outlook.
However, if that movement evolves into a five-wave Leading Diagonal, the conservative scenario will gain considerably more confidence.
For now, the focus remains on identifying at least a three-wave corrective structure, as its quality and internal characteristics should provide valuable insight into the dominant scenario and the larger wave degree.
The objective of Elliott Wave Principle is not to predict the future, but to interpret market structure through objective rules and guidelines. Each new wave reveals another piece of the puzzle, and every scenario should evolve as the market structure unfolds.
✍️ Mr. Nobody
🎧 Patterns whisper. I listen.
Australian Dollar / U.S. Dollar
3 days ago
AUD/USD Monthly Chart | Elliott Wave Principle
DAX 40 | Is a Powerful Third Wave Still Unfolding?Elliott Wave Perspective
The long-term structure of the DAX 40 continues to align with the characteristics of a developing bullish impulse. Based on the current wave count, the market may still be advancing within a higher-degree Wave III—a phase that often displays the strongest momentum and acceleration within an impulsive cycle.
One of the most important aspects of the current structure is the relationship between the waves of a lower degree. Since Wave (1) and Wave (3) are approximately equal in length, Wave (5) may have a greater potential to become the extended wave. If this scenario develops, the ongoing advance could continue through the completion of its internal subdivisions, allowing the higher-degree Wave III to reach significantly higher levels.
However, a shorter completion scenario remains valid. Wave (5) may complete without a significant extension, causing the broader bullish structure to reach completion earlier than expected. For this reason, the current advance should continue to be evaluated through both its internal wave structure and price behavior.
At present, the larger structure continues to support the possibility of further upside. However, the extent of Wave (5) and the way its internal subdivisions develop will play an important role in determining how far the market may advance toward higher target areas.
As always, this analysis is based solely on the current Elliott Wave Principle structure, Fibonacci relationships, and price behavior. It represents a research-based market perspective rather than a prediction. If the market structure evolves, the wave count and the scenarios presented will be reassessed accordingly.
“Markets do not reveal certainty. Structure reveals probability.”
Mr. Nobody | Elliott Wave Principle 📊
DAX Index
Oct 30, 2023
Three Wave Corrective?!!!
DAX Index
Nov 29, 2023
Diagonal ending in a larger degree of wave????
DAX Index
Jan 25, 2024
The extension of the Bull market
Germany 30
Aug 6, 2024
The idea of extending the DAX bull market
 Long
Long

XAU/USD 04 August 2026 Intraday AnalysisH4 Analysis:
-> Swing: Bullish.
-> Internal: Bearish.
Bias and analysis to remain the same as analysis dated 30 June 2026.
Price did not print bullish CHoCH to indicate bullish pullback phase initiation. Price instead printed a new low followed by a bullish CHoCH
Price is currently trading within and established internal range, however, I will continue to monitor price with respect to depth of pullback.
Intraday expectation:
Price to trade up to either premium of internal 50% EQ, or H4 demand zone before targeting weak internal low, currently priced at 3,942.100.
Note:
Gold remains volatile as tensions between the US, Israel, and Iran keep safe‑haven demand elevated.
Markets are reacting quickly to every headline, while uncertainty around the Fed’s easing path and shifting U.S. policy under President Trump, especially tariffs continues to fuel choppy price action.
For newer traders, the key is simple, stay flexible and manage risk carefully, as fast spikes and sudden reversals are a normal part of the current XAU/USD environment.
H4 Chart:
M15 Analysis:
-> Swing: Bearish.
-> Internal: Bearish.
Analysis and bias remains the same as analysis dated 20 July 2026.
Price has printed according to analysis dated 14 July 2026 where I mentioned price to trade up to either premium of internal 50% EQ, or M15 demand zone before targeting weak internal low, priced at 3,983.545. This is how price printed.
Price has subsequently printed a bullish CHoCH to indicate bullish pullback phase initiation. Price has since printed lower. Depth of pullback has been insignificant, therefore, I will not classify the bearish iBOS, however, I have marked this in red for illustration purposes.
Price has since printed a further bullish CHoCH and once again price is trading within an established internal range, however, I shall again monitor price action with regards to depth of pullback.
Intraday expectation:
Price to trade up to either premium of internal 50% EQ, or M15 demand zone before targeting weak internal low, priced at 3,959.800.
Note:
Gold remains highly reactive on M15 as geopolitical risk continues to drive quick, headline‑led moves.
The tension between the US, Israel, and Iran is keeping safe‑haven demand elevated, with markets still sensitive to any sign of escalation.
At the same time, shifting US tariff policy under President Trump is adding extra uncertainty, fuelling sharp intraday swings and increasing the likelihood of sudden sentiment flips. Liquidity pockets and whipsaws remain common, making disciplined risk management essential.
Gold’s geopolitical premium is still firmly in place, and until tensions ease, short‑term volatility is likely to stay front‑loaded.
M15 Chart: Bitcoin (BTCUSDT) – Liquidity Sweep at $68K, Eyes on the $40.5K On the Weekly timeframe, Bitcoin has entered a corrective phase after sweeping liquidity above the $68,000 resistance zone. This area contained a large concentration of breakout buyers and buy-stop orders. Once this liquidity sweep was completed, the market quickly reversed and triggered a sharp sell-off.
At the moment, I believe smart money is targeting the next major liquidity zone around $40,500. This level stands out because:
It served as a significant accumulation area before Bitcoin's explosive rally.
Strong buying interest previously emerged from this region.
It represents a major liquidity pool that could attract institutional demand before the next directional move.
From a Smart Money Concept (SMC) perspective, the liquidity sweep above $68,000 does not necessarily signal the end of Bitcoin's long-term bullish trend. Instead, after collecting liquidity from buyers at the highs, the market often seeks the remaining liquidity resting below before establishing a new trend.
For this reason, rather than trying to catch a falling knife at intermediate levels, I prefer to wait patiently for Bitcoin to react around the $40,500 demand zone. If the market shows confirmation—such as a bullish reversal candle, a market structure shift, or strong buying momentum—this area could provide a much more attractive risk-to-reward opportunity.
If Bitcoin successfully completes its liquidity sweep around $40,500 and attracts fresh demand, the next long-term bullish cycle could potentially target the $180,000–$200,000 range.
Trading Plan
Liquidity Sell-Off Zone: $68,000 (Liquidity Sweep Completed).
Key Demand & Liquidity Zone: $40,500.
Wait for price confirmation before considering long positions.
Stay disciplined, avoid FOMO, and focus on high-probability setups with proper risk management.
Disclaimer: This analysis reflects my personal view based on price action and liquidity concepts. It is intended for educational purposes only and should not be considered financial advice.  Long
Long
Gold Explodes Higher After Days of ConsolidationAfter spending several days consolidating inside a symmetrical triangle , OANDA:XAUUSD Gold finally delivered the breakout we were waiting for.
The breakout wasn't gradual—it happened with strong bullish momentum, slicing through multiple resistance levels, the descending trendline, and the triangle resistance in a single move.
This type of expansion usually signals that buyers have regained control after a period of balance between supply and demand.
The blue support zones on the chart are not random levels.
They represent previous resistance areas that may now act as support if the market decides to pull back.
For now, my primary expectation remains bullish as long as price holds above the invalidation area around 4170.
The next important objective is the first major resistance near 4370, while the higher-timeframe structure still leaves room for a move toward the larger resistance around 4580 if momentum continues.
However, every breakout deserves confirmation .
If price loses the 4170 invalidation level, the current bullish structure becomes invalid.
In that scenario, I will stop looking for long positions and instead wait for bearish price action confirmation before considering short trades.
A downside move could then target the 4050 support region.
One important suggestion:
Zoom out before making any decision.
Most traders only focus on the latest candles, while the real story begins where these support and resistance zones were originally created.
Understanding where institutional buying and selling started provides much better context than watching the current candle alone.
Trading Plan
• Bullish bias above 4170
• Watch for pullbacks into previous resistance turned support
• Bearish scenario activates only after a confirmed breakdown below 4170 with bearish confirmation
Risk management remains more important than prediction. Long