Free, until you’re ready
Look first at how all the markets are performing.
Then leap into them on the platform used by 100 million traders.
No credit card needed
Plans for every level of ambition
Global markets in your hand
We reliably connect you to hundreds of data feeds, with direct access to 3,539,722 instruments from all over the world, sourcing the highest-quality information used by professionals from institutional-grade data partners.
Compare plans
| Basic | Essential | Plus | Premium | Ultimate |
|---|
Charts | Basic | Essential | Plus | Premium | Ultimate |
|---|---|---|---|---|---|
Charts per tab | 1 | 2 | 4 | 8 | 16 |
Saved chart layouts | 1 | 5 | 10 | ||
Custom chart intervals | |||||
Predefined second intervals | |||||
Custom second intervals | |||||
Tick-based intervals | |||||
Intraday price-based charts | |||||
Custom range bars | |||||
Spread charts | |||||
Data export | |||||
Customizable chart types | 17 | 17 | 17 | 21 | 21 |
Symbol comparison | |||||
Dividend-adjusted charts | |||||
Interactive corporate events and news | |||||
Historical annual financial data | 7 years | 20 years | 20 years | 20 years | 20 years |
Historical quarterly financial data | 8 years | 8 years | 8 years | 8 years | 8 years |
Extended trading hours | |||||
Parallel chart connections | 2 | 10 | 20 | 50 | 200 |
Nested drawing groups | |||||
| Bar replay | |||||
Historical data by day and higher timeframes | All | All | All | All | All |
Historical data by the minute | 180 days | 365 days | All | All | |
Historical data by the second | All | All | |||
Historical data by the tick | 7 days | ||||
Indicators replay | |||||
Trading in bar replay | |||||
| Technical analysis | |||||
400+ pre-built most popular indicators | |||||
150K+ community-powered indicators | |||||
Indicators on indicators | 1 | 1 | 9 | 24 | 49 |
Indicators per chart | 2 | 5 | 10 | 25 | 50 |
Financials per chart | 1 | 4 | 7 | 10 | 25 |
Custom indicator templates | 1 | ||||
110+ drawing tools | |||||
Volume candles | |||||
Pine Script® | |||||
Candlestick patterns recognition | |||||
Auto fib retracement | |||||
Multi-timeframe analysis | |||||
Time limit for making calculations | 20 sec | 40 sec | 40 sec | 40 sec | 100 sec |
Auto chart patterns | |||||
| Orderflow | |||||
Volume profile indicators | |||||
Time price opportunity | |||||
Volume footprint | |||||
| Strategy backtesting | |||||
Basic report metrics | |||||
Advanced report metrics | |||||
Export trades in CSV | |||||
Export report in XLSX | |||||
Deep backtesting | |||||
High detalization of historical bars | |||||
Each history tick execution | |||||
| Watchlists | |||||
Number of watchlists | 1 | ||||
Symbols per watchlist | 30 | 1,000 | 1,000 | 1,000 | 1,000 |
Flagged symbols colors | 1 | 7 | 7 | 7 | 7 |
Import and export | |||||
Custom columns and sorting | |||||
| Portfolios | |||||
Number of portfolios | 1 | 3 | 4 | 5 | 7 |
Holdings per portfolio | 20 | 50 | 75 | 100 | 150 |
Transactions per portfolio | 2,000 | 5,000 | 5,000 | 5,000 | 5,000 |
Broker account connections via Plaid | 3 | 3 | 3 | 3 | |
| Alerts | |||||
Active price alerts | 3 | 20 | 100 | 400 | 1,000 |
Active technical alerts | 20 | 100 | 400 | 1,000 | |
Active watchlist alerts | 2 | 15 | |||
Alert duration | 1 month | 2 months | 2 months | ||
Webhook notifications | |||||
Multi-condition alerts | |||||
Alerts on financial metrics | |||||
Second-based alerts | |||||
| Screeners | |||||
Stock, ETF, bond, crypto screeners | |||||
150+ exchanges from 50+ countries | |||||
500+ fundamental and technical fields | |||||
Multiple markets | |||||
Chart view mode | |||||
Watchlists as filters | |||||
AI Screener requests | Preset requests only | 100 | 150 | 250 | 500 |
Flagged symbols colors | 1 | 7 | 7 | 7 | 7 |
Auto-refresh | 10 sec / 1 min | 10 sec / 1 min | 10 sec / 1 min | 10 sec / 1 min | |
Data export | |||||
Timeframes | D W M | All | All | All | All |
Pine Screener | |||||
Bond Screener | |||||
Saved screens | 1 | ||||
Active filters | 2 | ||||
Manual filter setup | |||||
Adding columns | |||||
Custom grid in chart view | |||||
Date range selection in chart view | |||||
| Data | |||||
Fastest data flow | |||||
Maximum market data subscriptions allowed | 2 | 4 | 6 | ||
Ability to buy professional market data | |||||
Historical bars available | 5K | 10K | 10K | 20K | 40K |
Fundamental stock data | |||||
Global economic data | |||||
Unlimited access to all news sources | |||||
Hotlists | |||||
Economic, IPO, earnings, and dividend calendars | |||||
Yield Curves | |||||
| Trading | |||||
Trading through selected brokers | |||||
Simulated (paper) trading | |||||
Chart trading | |||||
Depth of market (DOM) trading | |||||
Active community contests | 3 | 5 | 10 | 25 | |
Ability to create public contests | |||||
| Options | |||||
Number of strategies | 3 | 8 | 15 | 25 | |
| Social | |||||
Exclusive badge next to your name | |||||
Signature and website fields | |||||
Posting invite-only indicators | |||||
Posting protected scripts | |||||
Posting public ideas and scripts | |||||
Posting video ideas | |||||
Posting minds | |||||
Commenting on public ideas and scripts | |||||
| Ad-free | |||||
Charts | |||||
Social network | |||||
| Mobile apps | |||||
Always at your fingertips | |||||
Fully synced | |||||
Native push alerts notifications | |||||
Android and iOS widgets | |||||
| Desktop app | |||||
Desktop experience | |||||
Native multi-monitor support | |||||
Tab linking by symbol between windows | |||||
| Support | |||||
Customer support | Regular | Priority | Priority | First priority |
On every street
We're used in pretty much every town and city, everywhere. And when you’re operating on that level, you better make damn sure you’ve got only the best data.
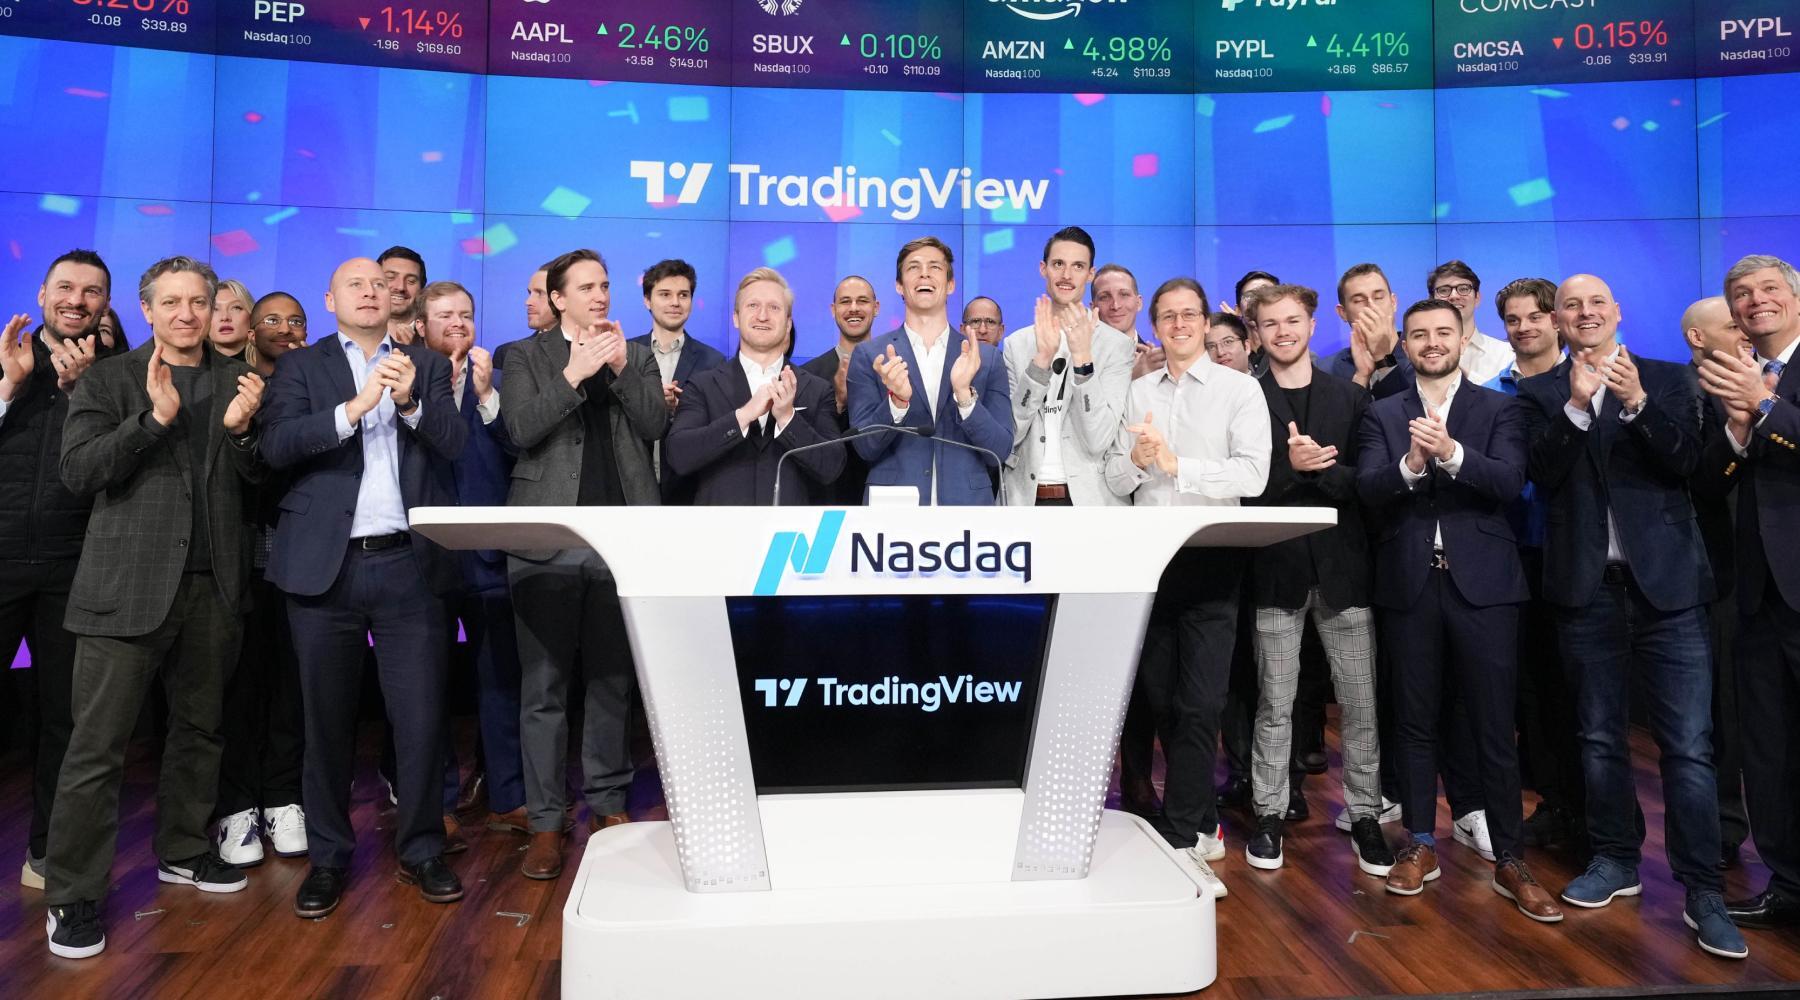
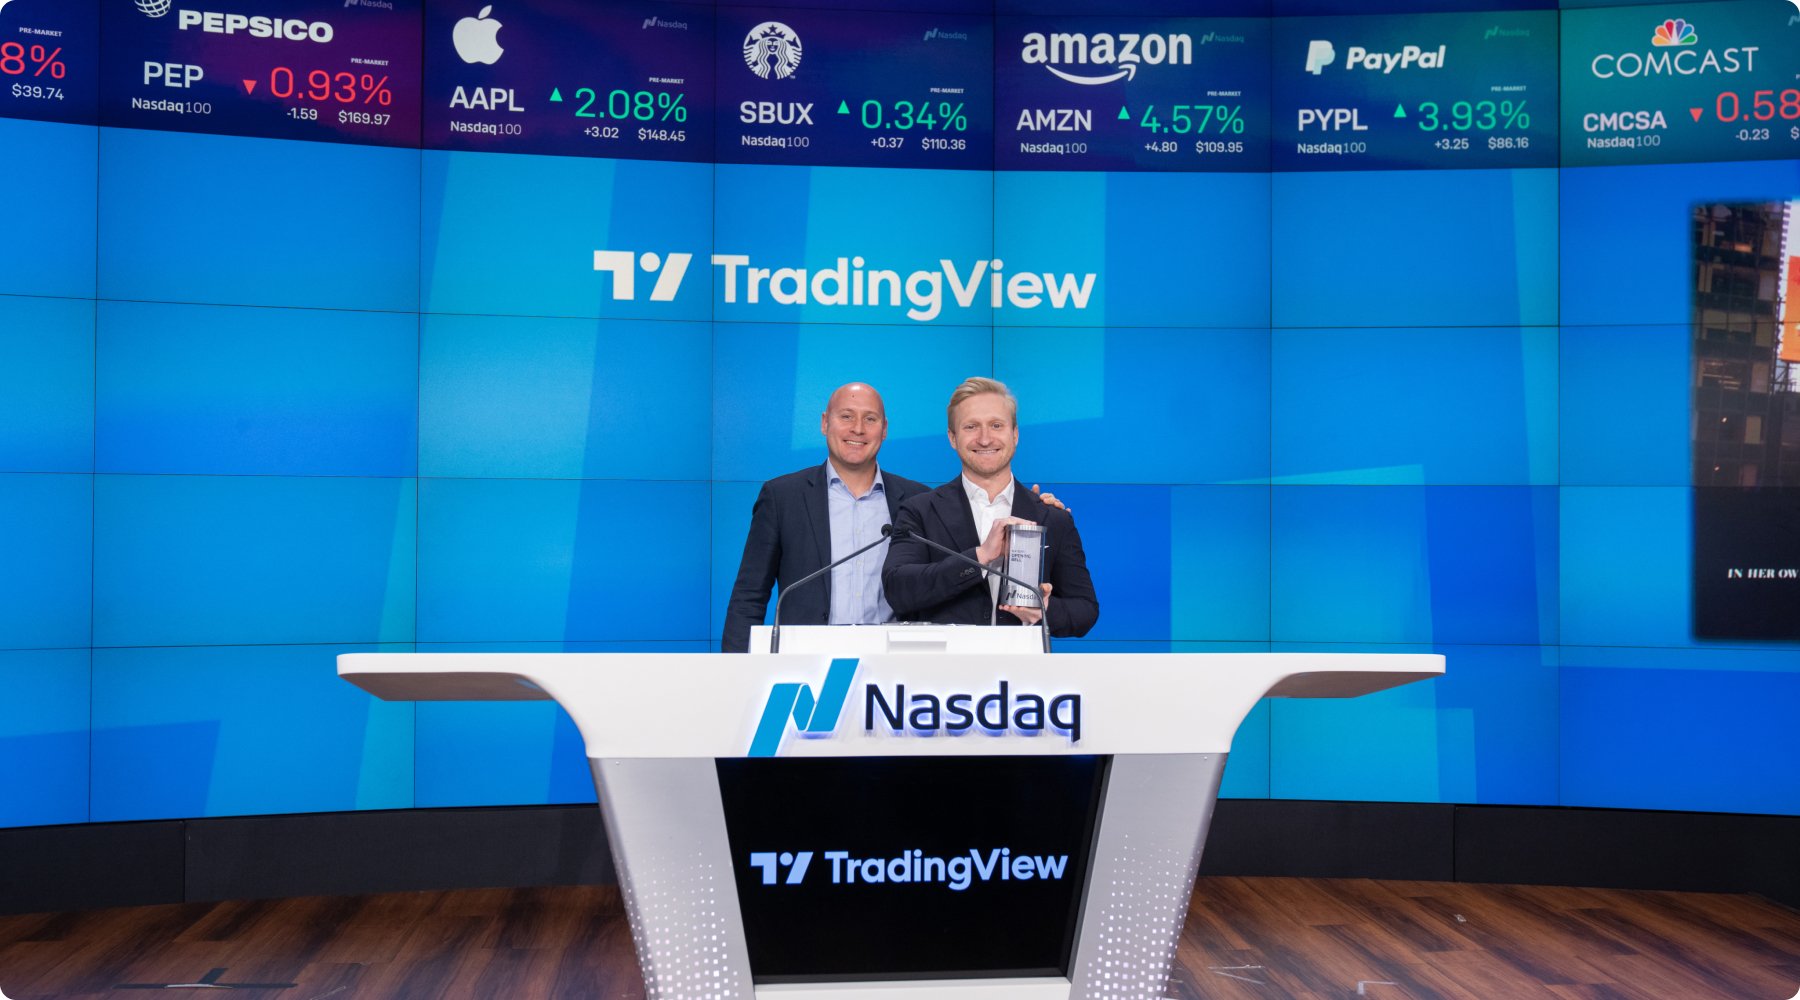
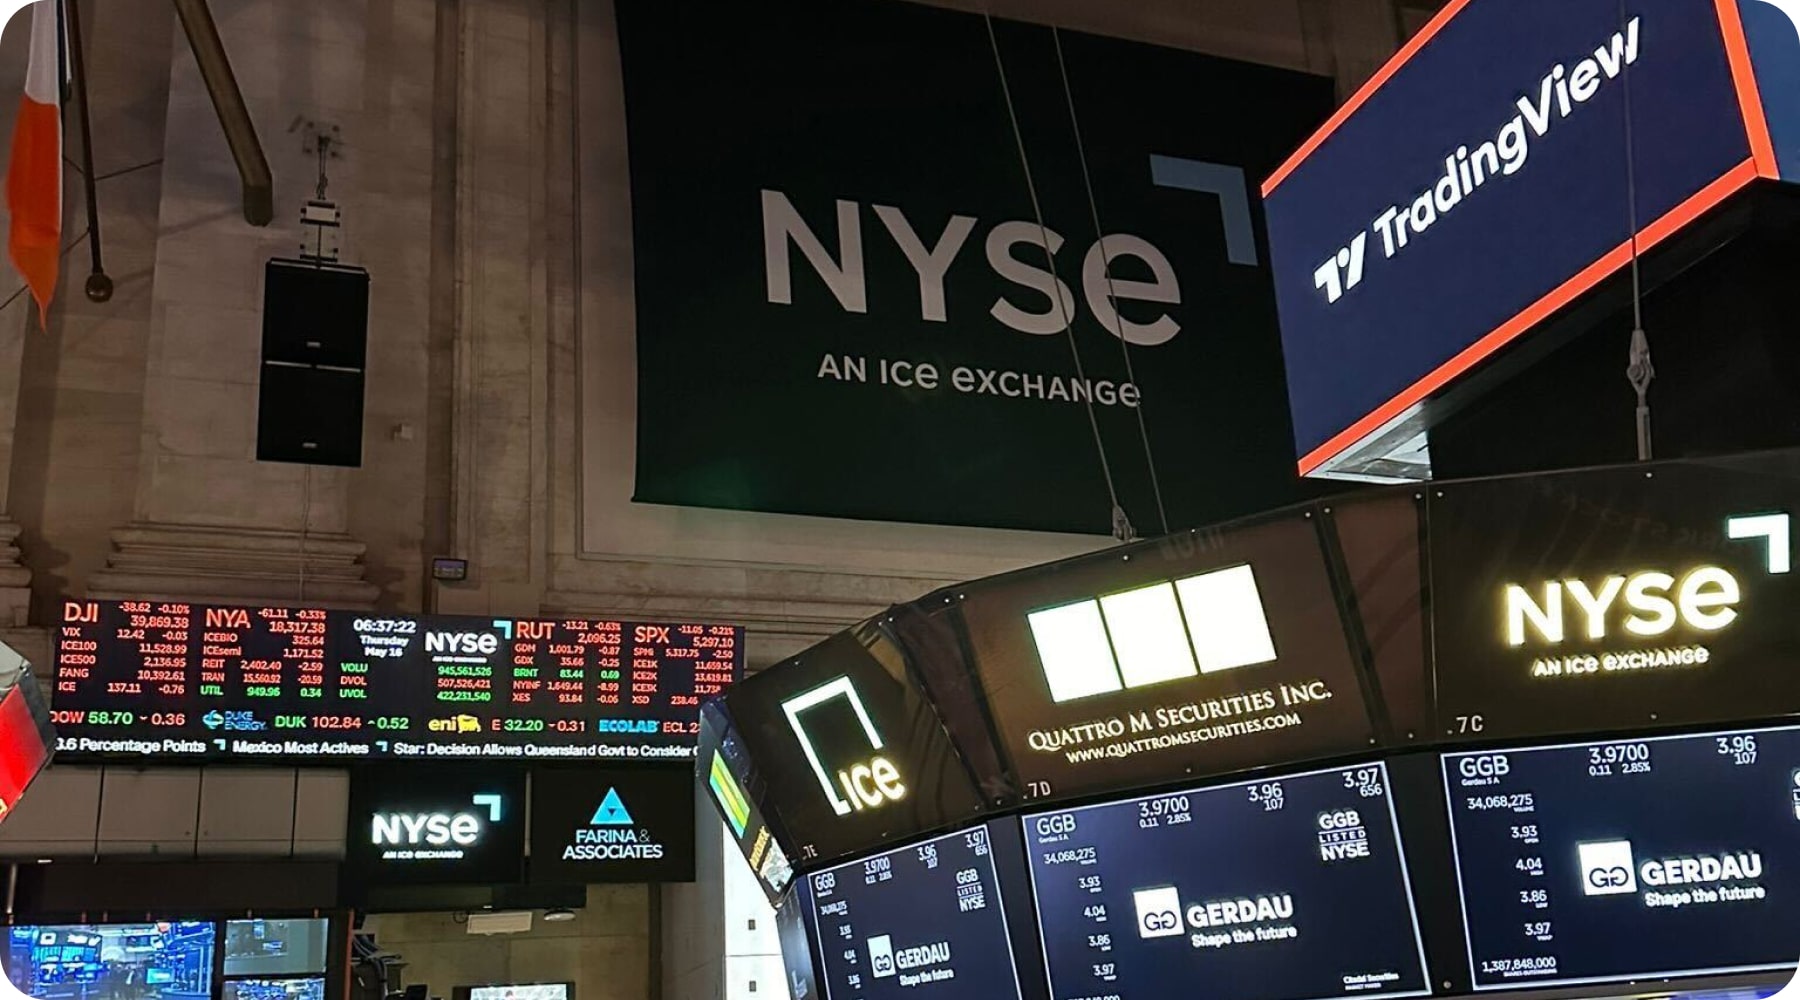
Say hello, Wall St✌️
Top-grade information makes a world of difference to a trader. That's why we work with the best institutional data partners on the world's most famous street, and far far beyond it.
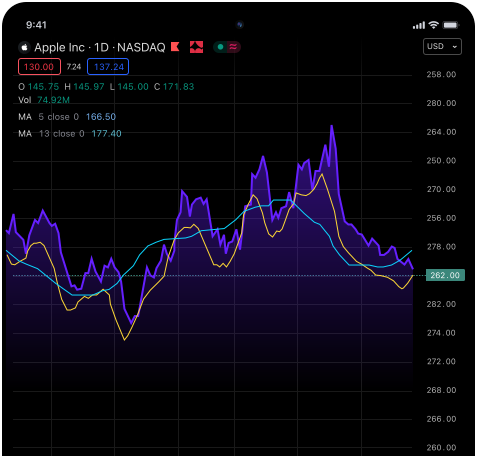
On any device
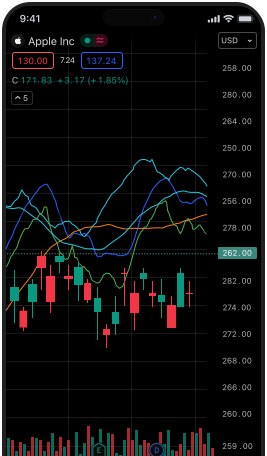
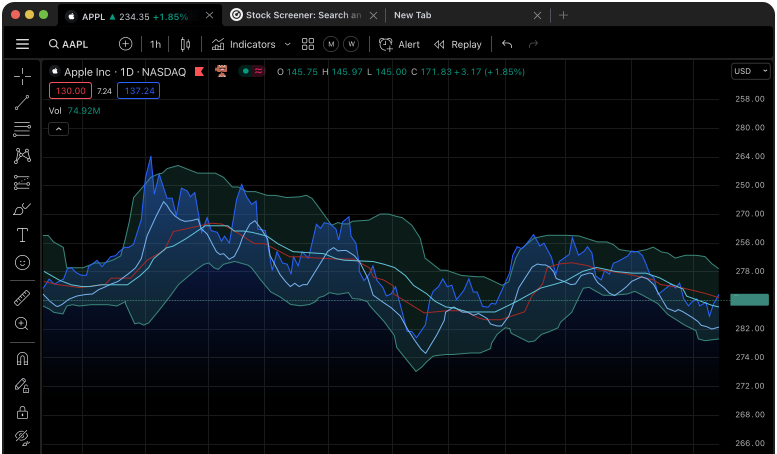
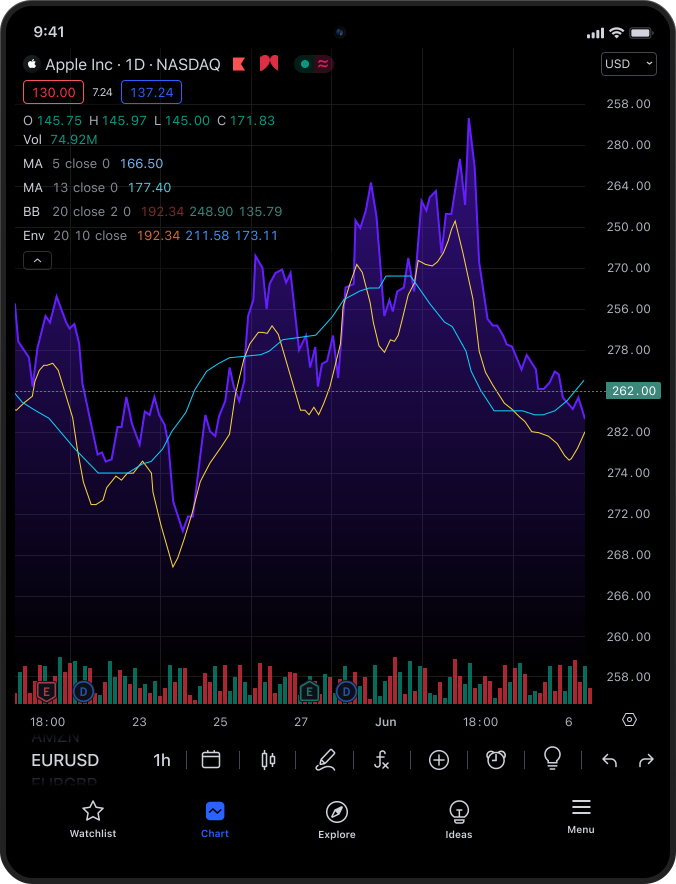
Ultimate in trading convenience. This is charting at its finest — synced layouts, watchlists, settings, and more — because no matter whether you're using web, mobile, or desktop apps, your way is always the best way.
Love in every
#TradingView
100 million traders taking the future into their own hands.







Frequently asked questions
Yes — your payments are secure. TradingView does not store any of your payment credentials. Your payment information is securely encrypted and passed directly to payment providers such as Braintree (a PayPal company), Checkout, Razorpay, dLocal, and Triple-A via their APIs. These secure connections ensure a safe, easy, and reliable experience when managing your subscriptions.
Acceptable payment methods include all major credit cards, PayPal accounts, Apple Pay, and crypto payments. Additionally, on our mobile apps, you can use any payment method supported by the App Store or Google Play.
Yes, you can pay for both monthly and annual plans using cryptocurrency — either directly or via Binance Pay. Payments are securely processed by Triple-A. To pay with crypto, select the "Crypto" tab on the Order page and follow the on-screen instructions.
You can cancel your subscription anytime and it will not auto-renew after the current paid term. Paid service will remain active for the duration of the paid term. A canceled trial will stop immediately after cancellation.
Refunds are available for annual plans only and must be requested within 14 calendar days of payment. To request a refund, contact our support team. There are no refunds for upgrades to a more expensive plan, monthly plans or market data, even if the subscription is cancelled on the same day as the payment has gone through. Please note that users who filed a chargeback/dispute request or a claim are not eligible for a refund.
You can upgrade your annual subscription at any time with no extra transactions needed. All remaining days of your current plan will be automatically converted into equivalent value days on the new tier. You don't lose anything, just use the remaining amount to switch to a better version. Thus, the remaining period of your subscription will be reduced and your next payment date will be switched. Learn how to upgrade your annual subscription.
If you downgrade, your current plan will stay exactly as it is until its subscription date. Then, once it expires, your new downgraded plan will go live at the selected rate. Learn how to downgrade your subscription.
All extra real-time and intraday data for exchanges — NASDAQ, NYSE, NYSE ARCA, OTC, CME, etc. — are available to be added separately to your account. To add data, you first need to have one of our paid plans or to be a trial member. Explore global market data.
No. Extra real-time data is only available on the TradingView website and only for users who purchased the data from eligible exchanges with their paid TradingView account.