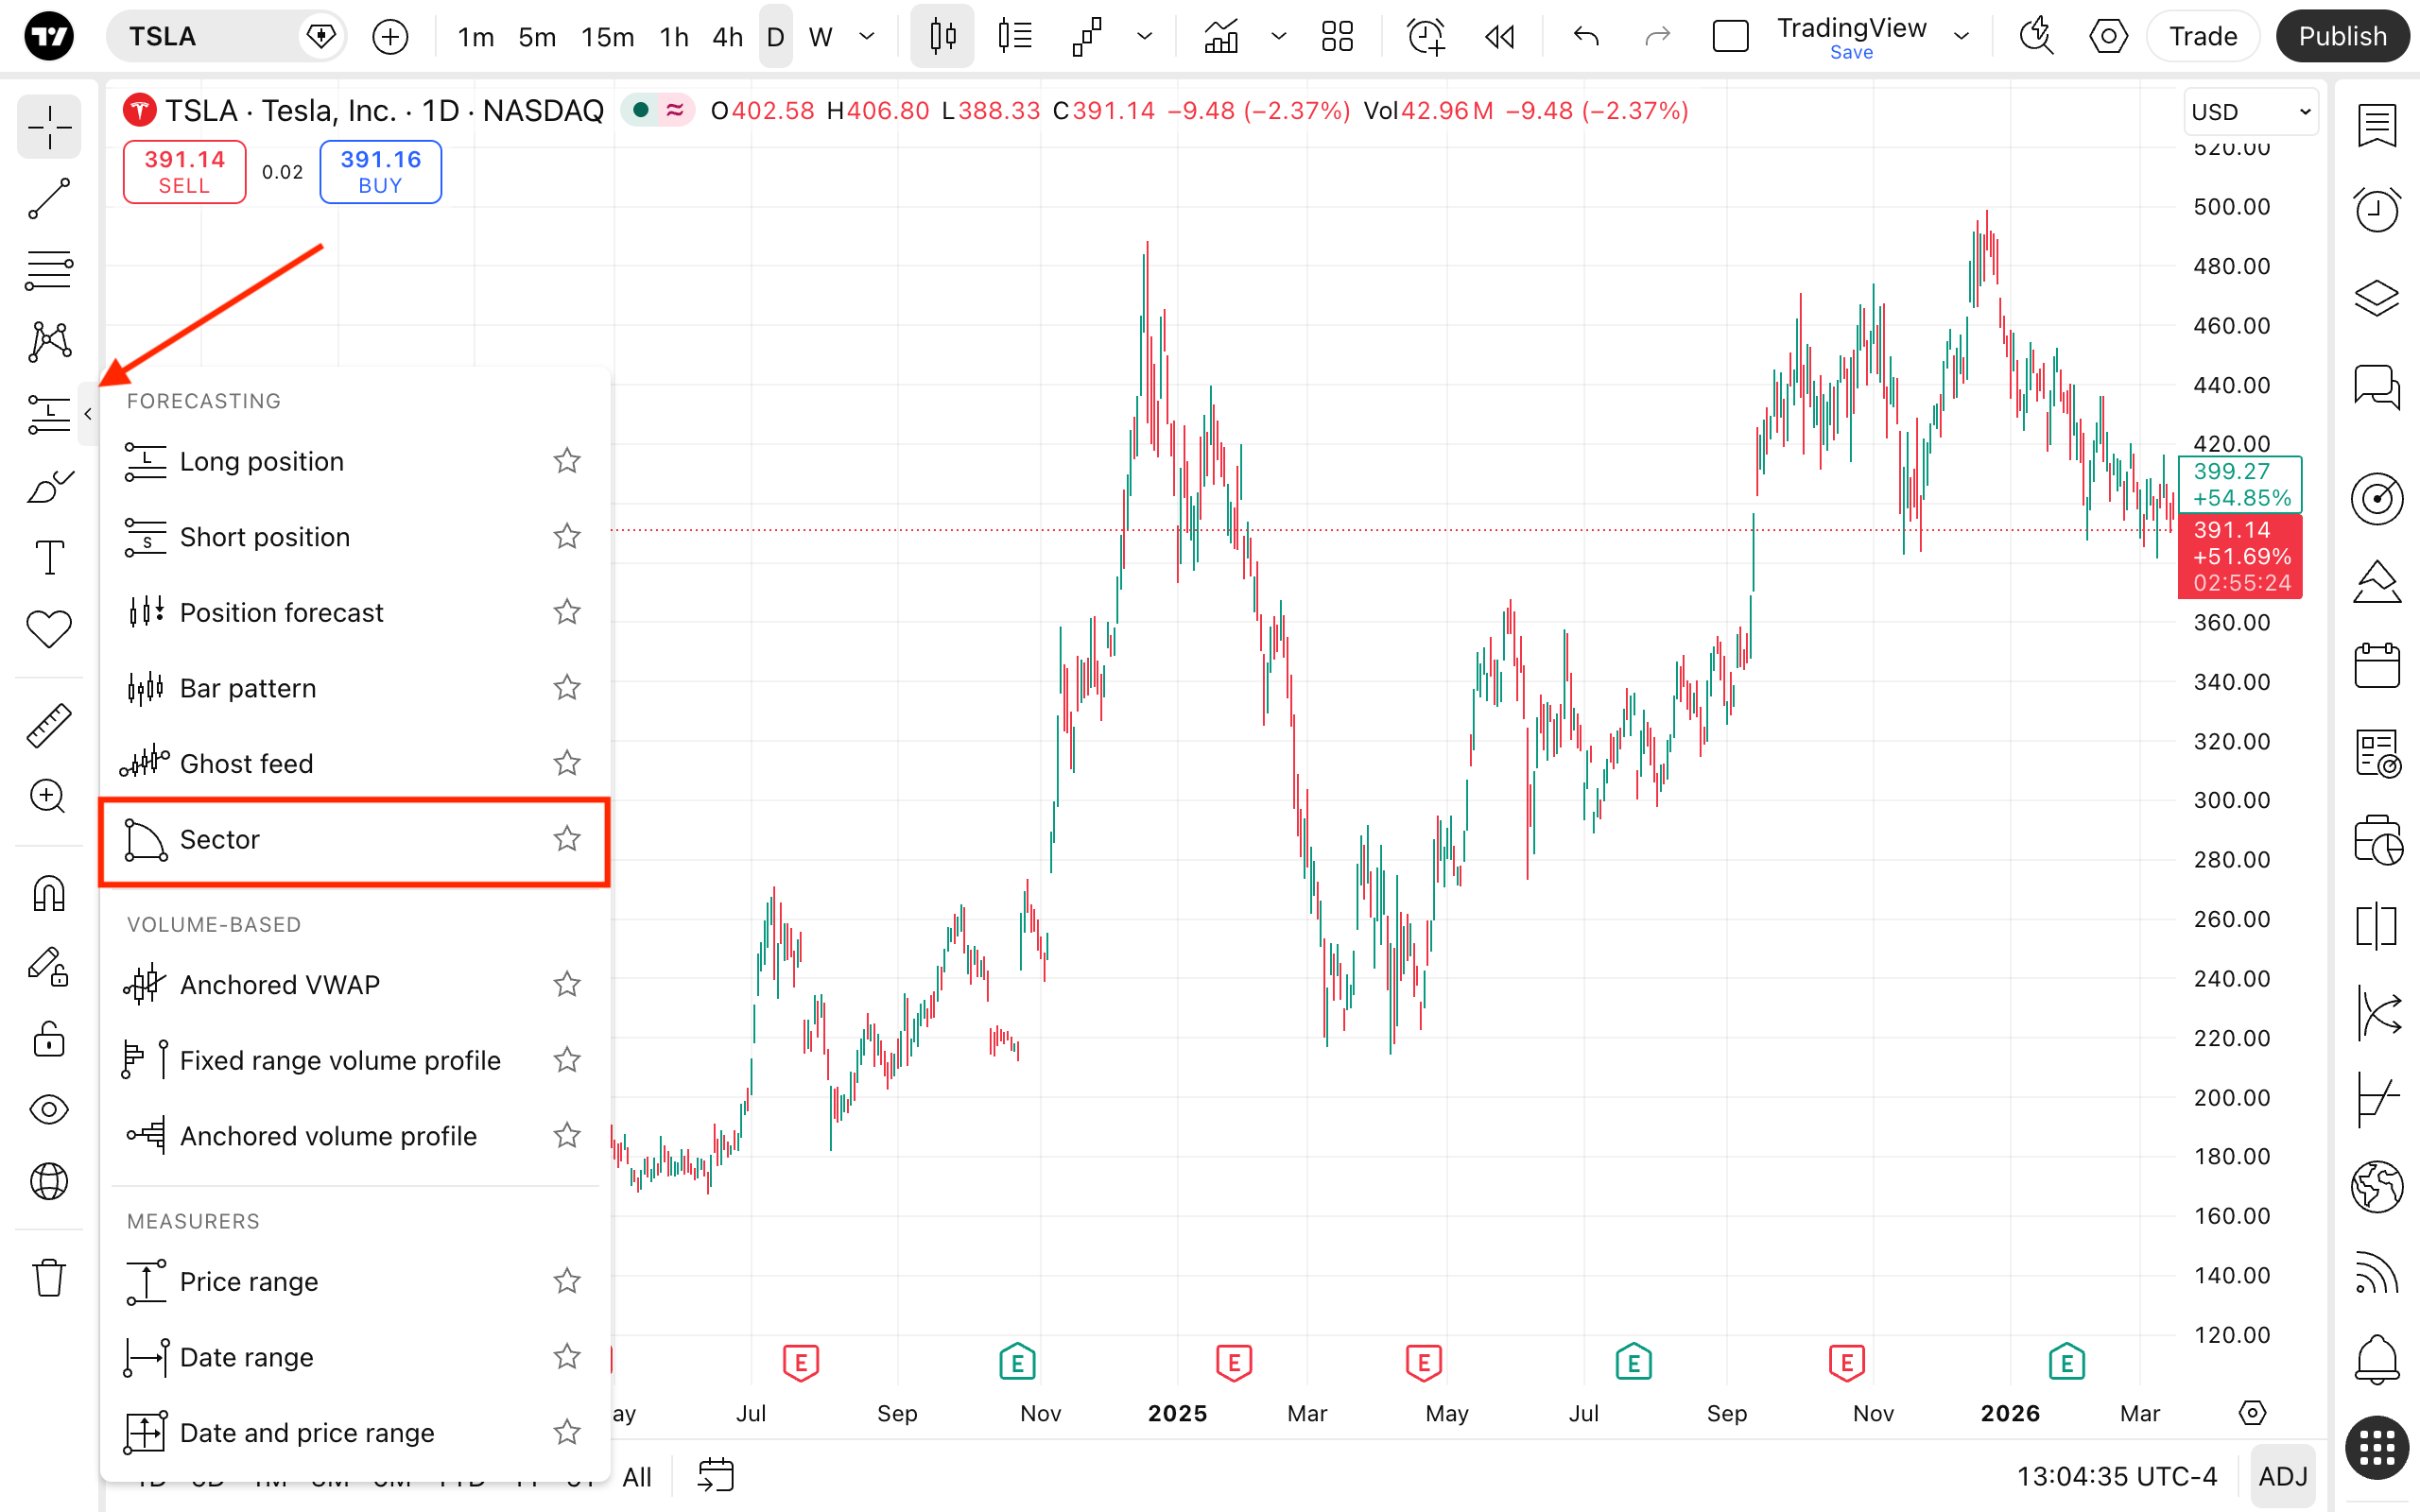
Sector drawing tool
Application
The sector tool allows user to make a projection for price moving forward. The user places a point of origin on the chart. A second point must be placed (moving horizontally to the right) somewhere in the future. Finally, the third point should be placed at an estimated price. This will complete the sector drawing.
Style
In the Style tab of properties dialog, it is possible to change the appearance of a sector drawn:
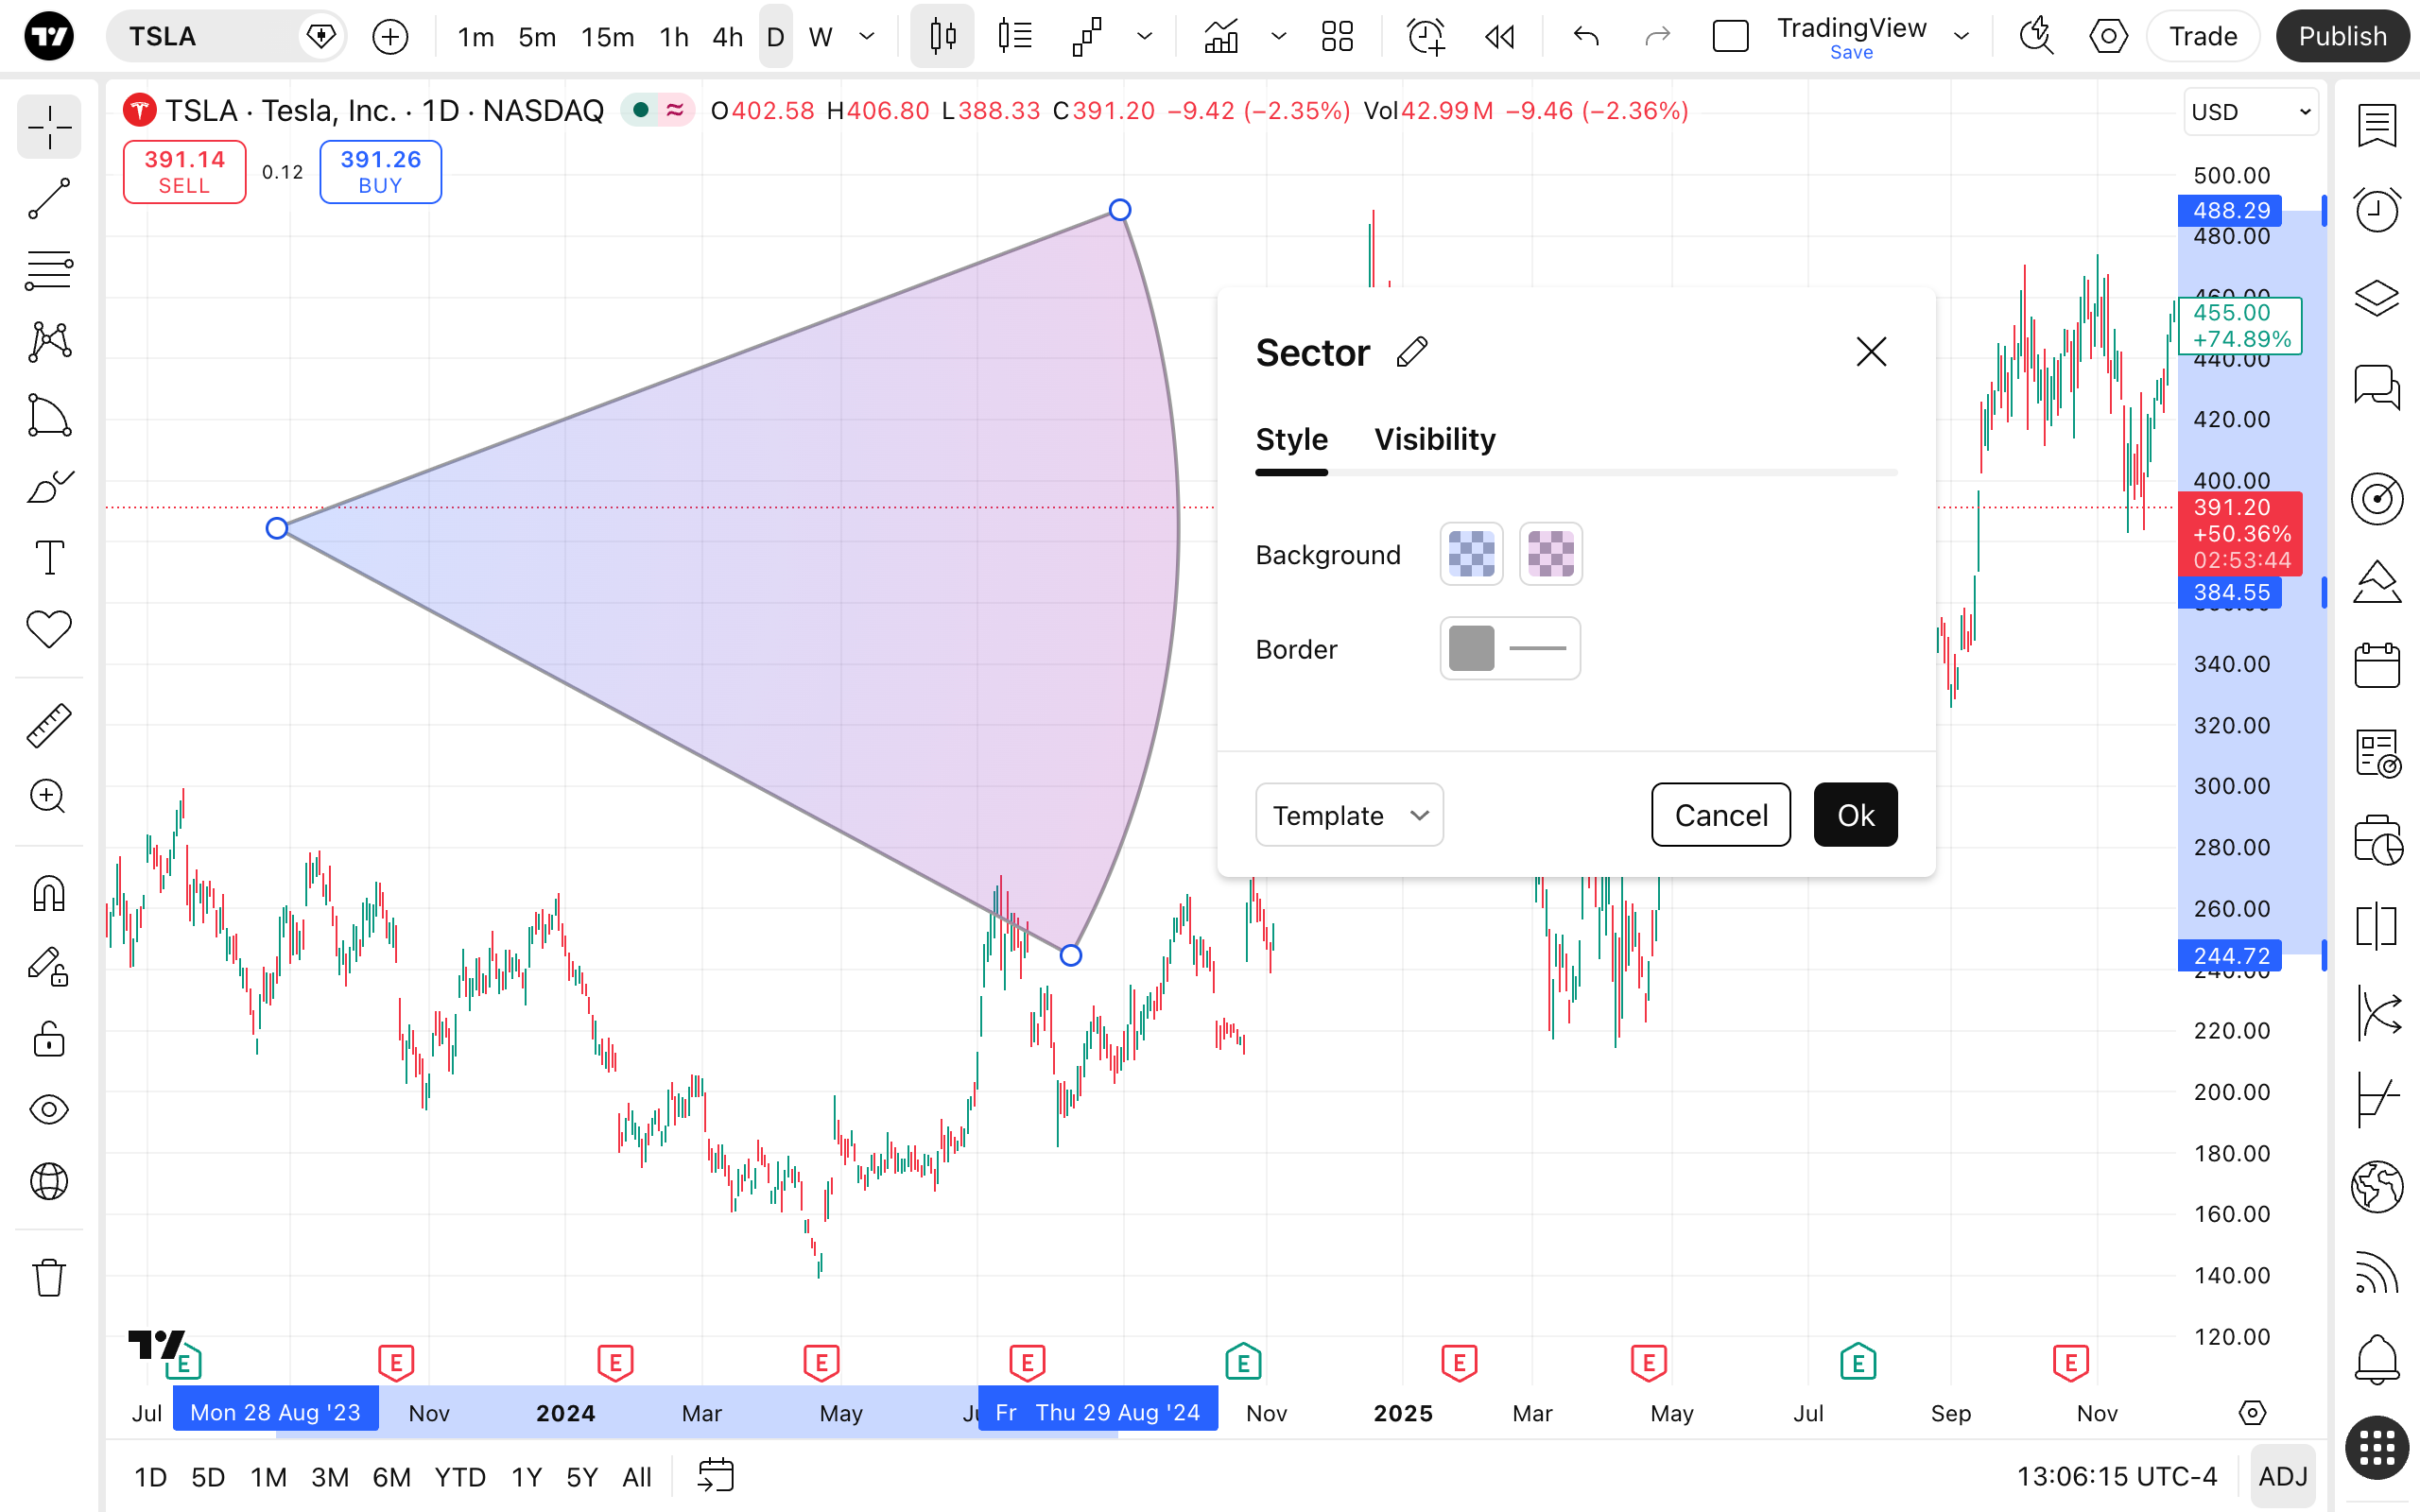
Background
Toggles the color and opacity level of a sector background.
Border
Sets the color and thickness of a sector border.
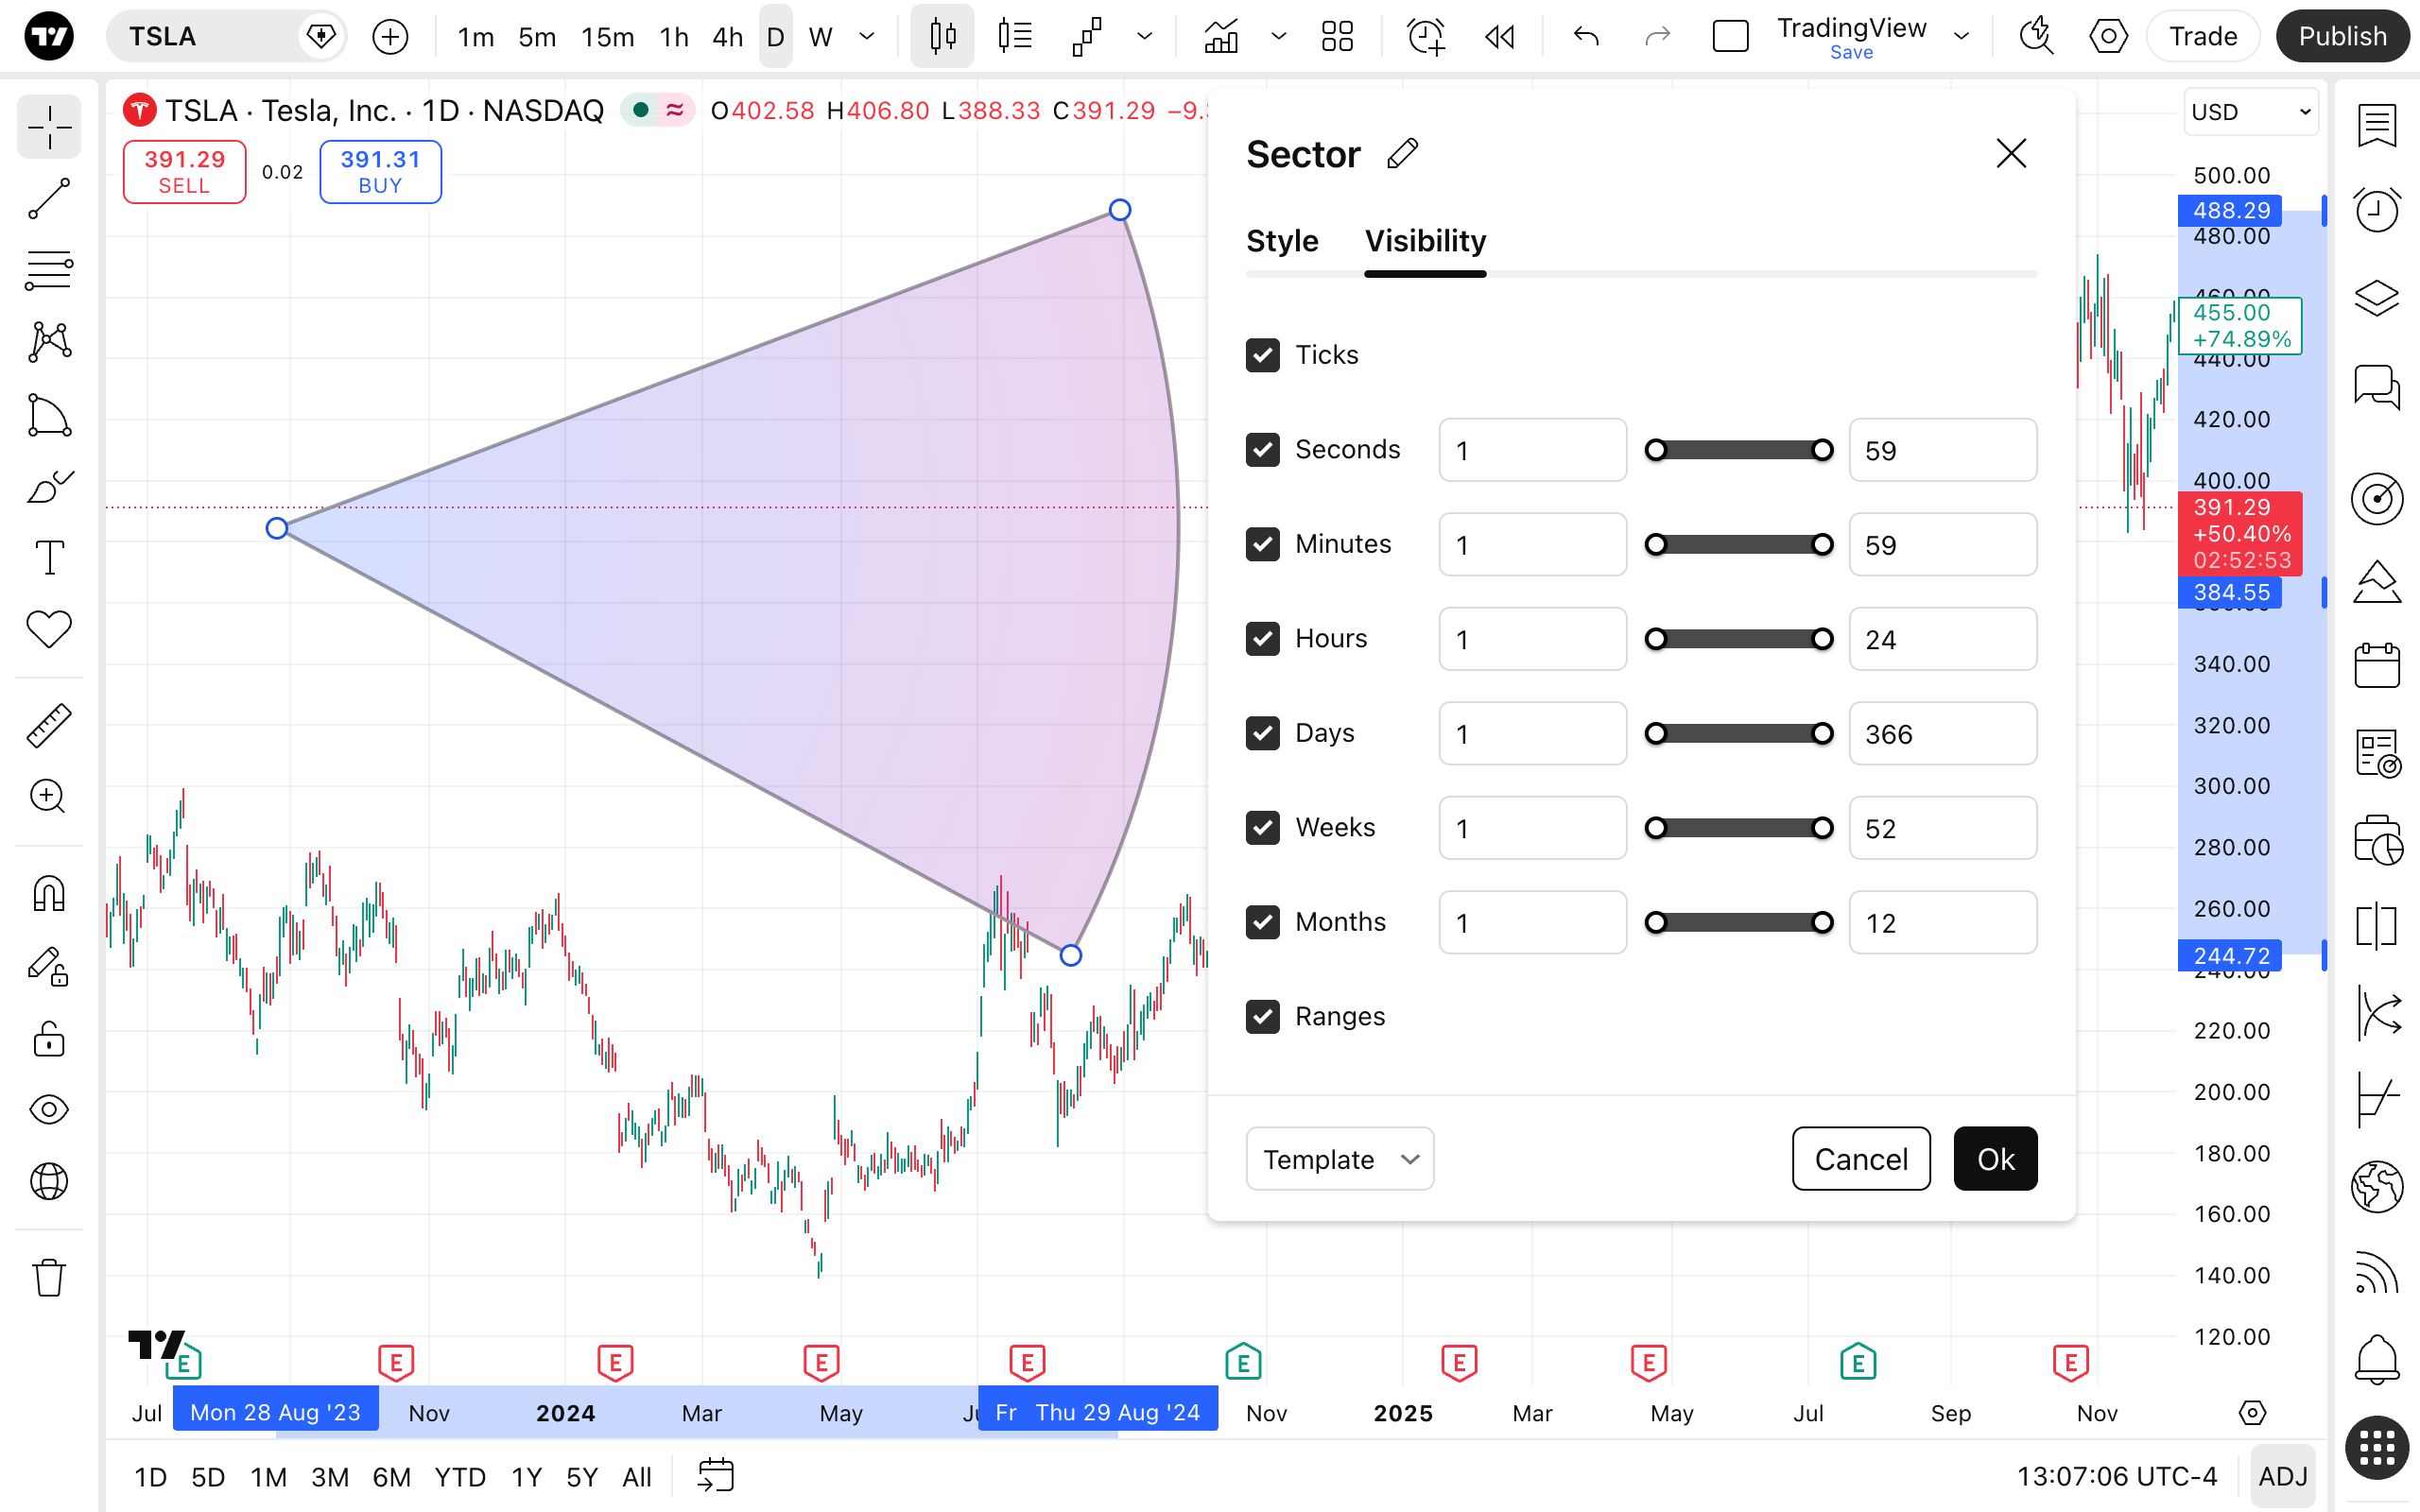
Visibility
In the Visibility properties dialog, you can switch the sector tool displaying on charts of different timeframes: