Date and price range drawing tools
Application
These measurement tools allow users to quickly calculate and visualize the distance between two points on a chart in terms of time, price, or both simultaneously.
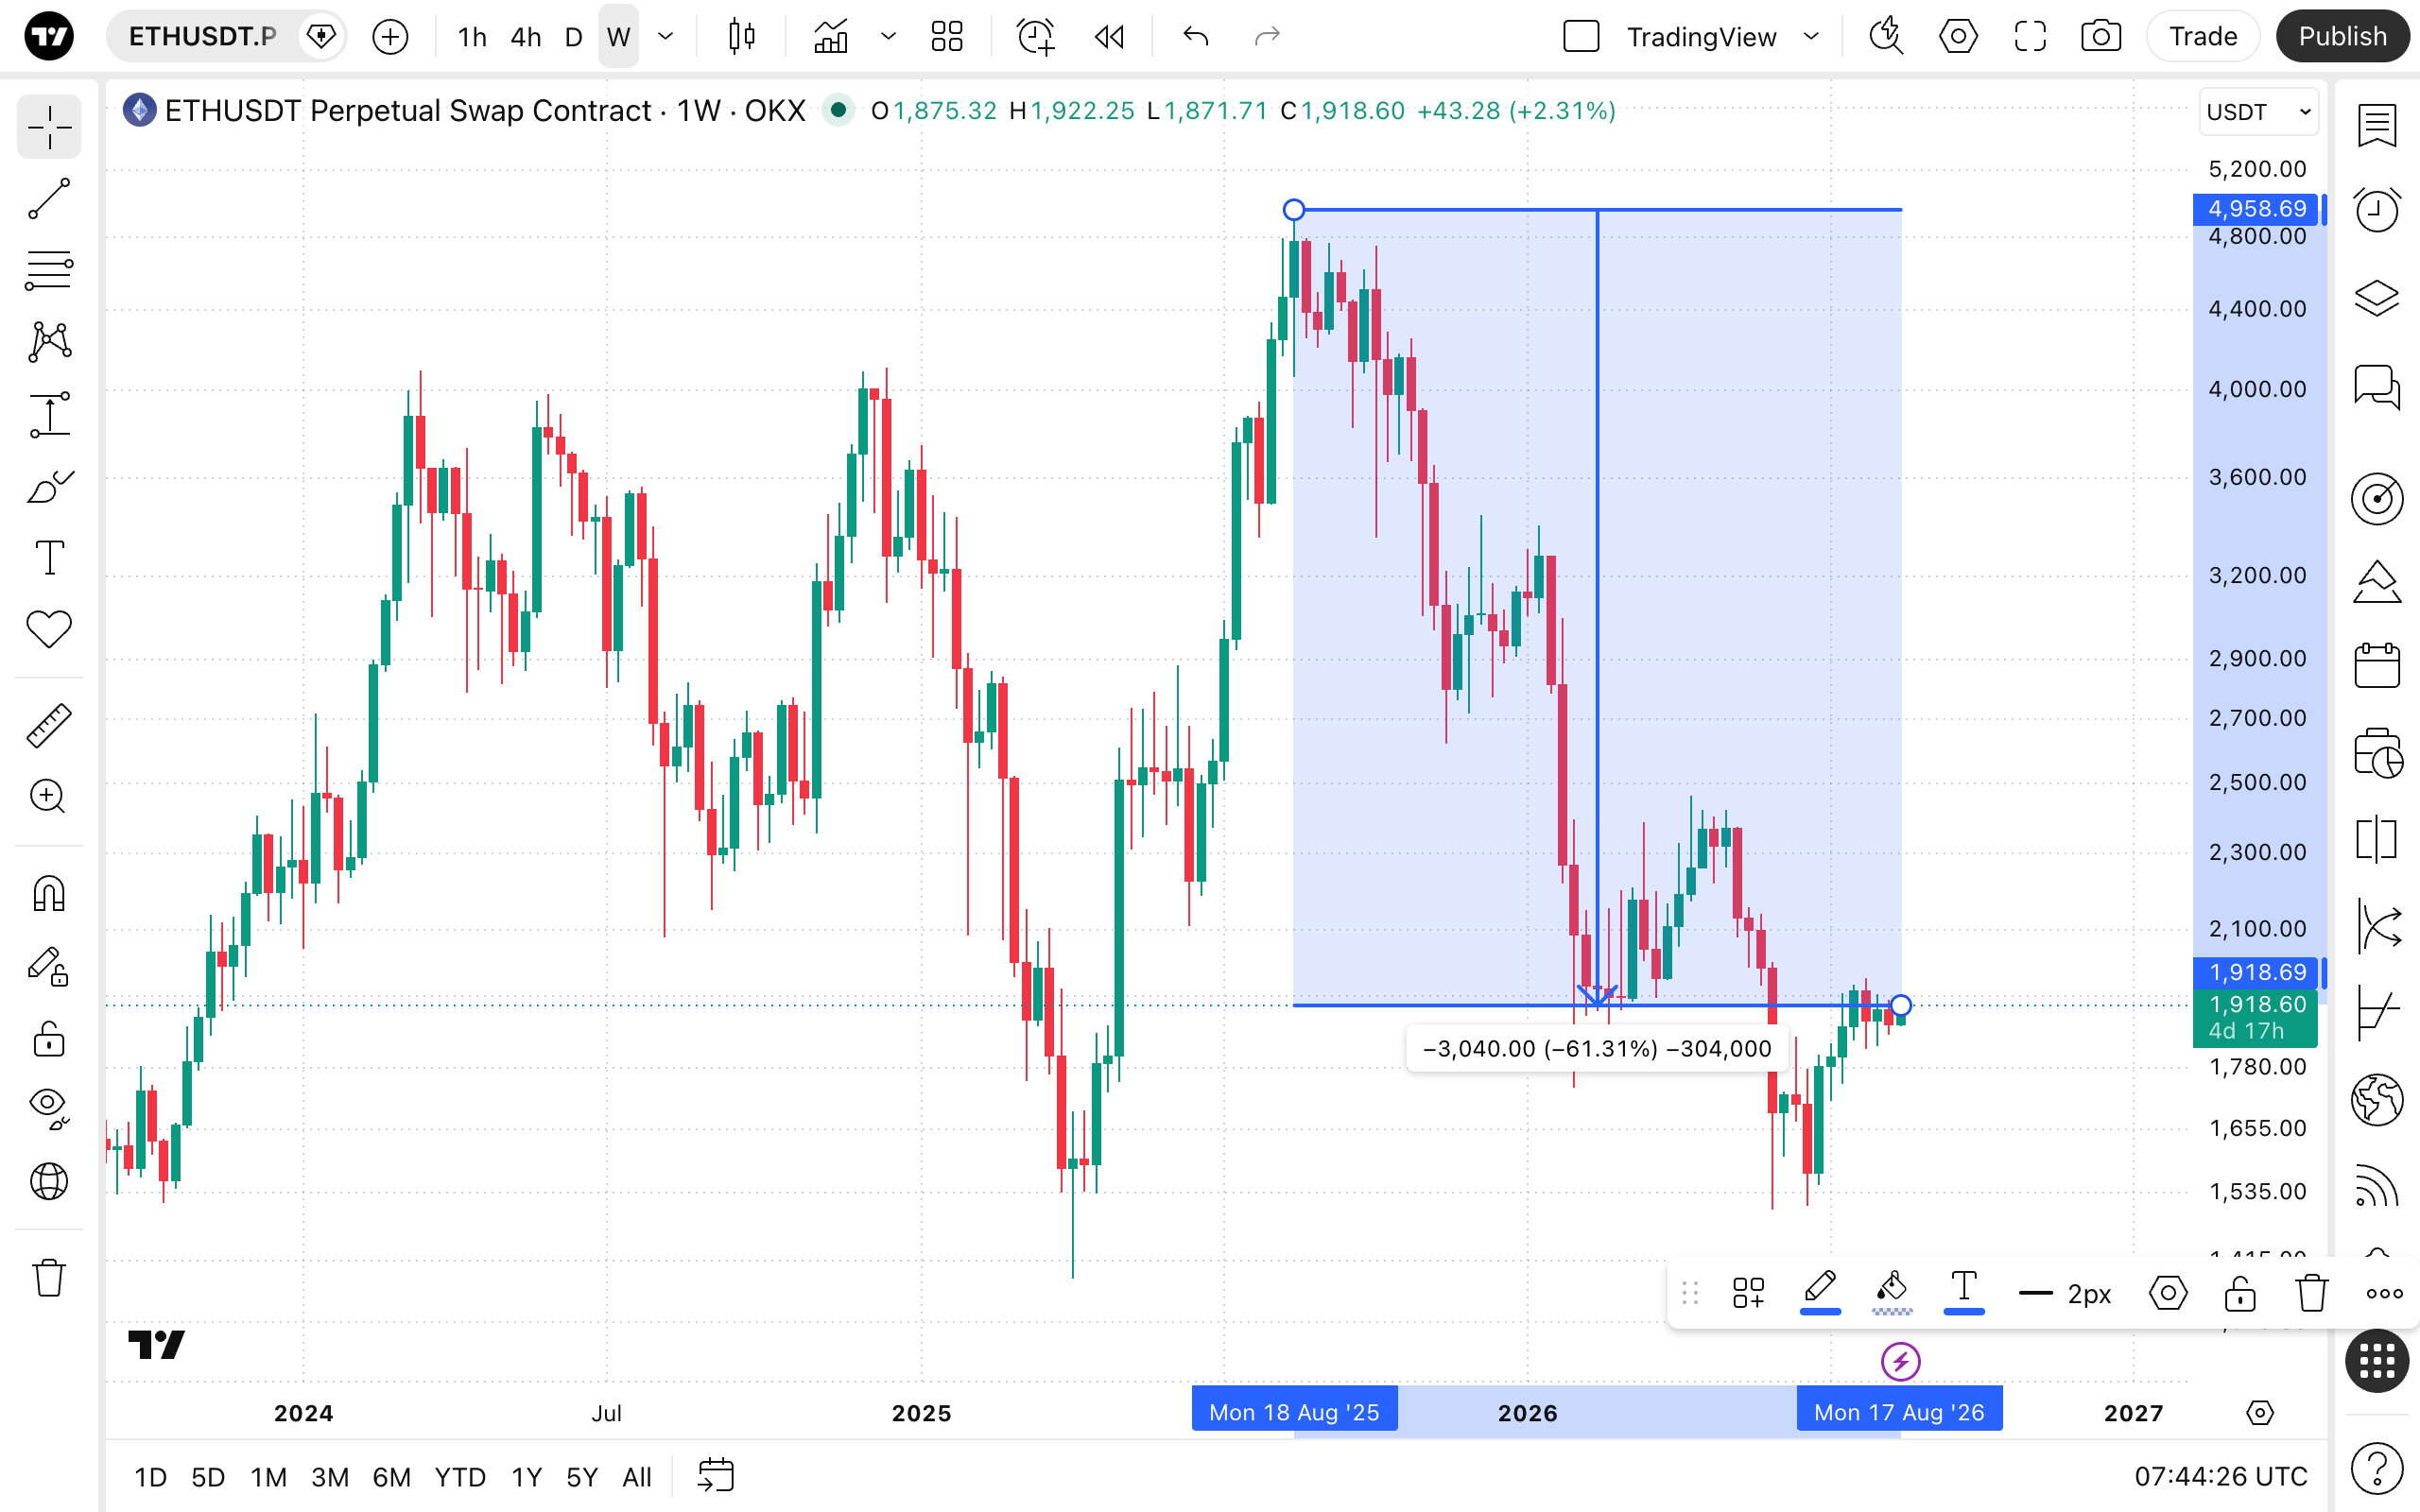
- Price range: Allows the user to place two points vertically. A shaded box will appear showing the range between the prices. The attached text label displays the total size of the price move in terms of absolute value, percentage change, and pips (ticks).
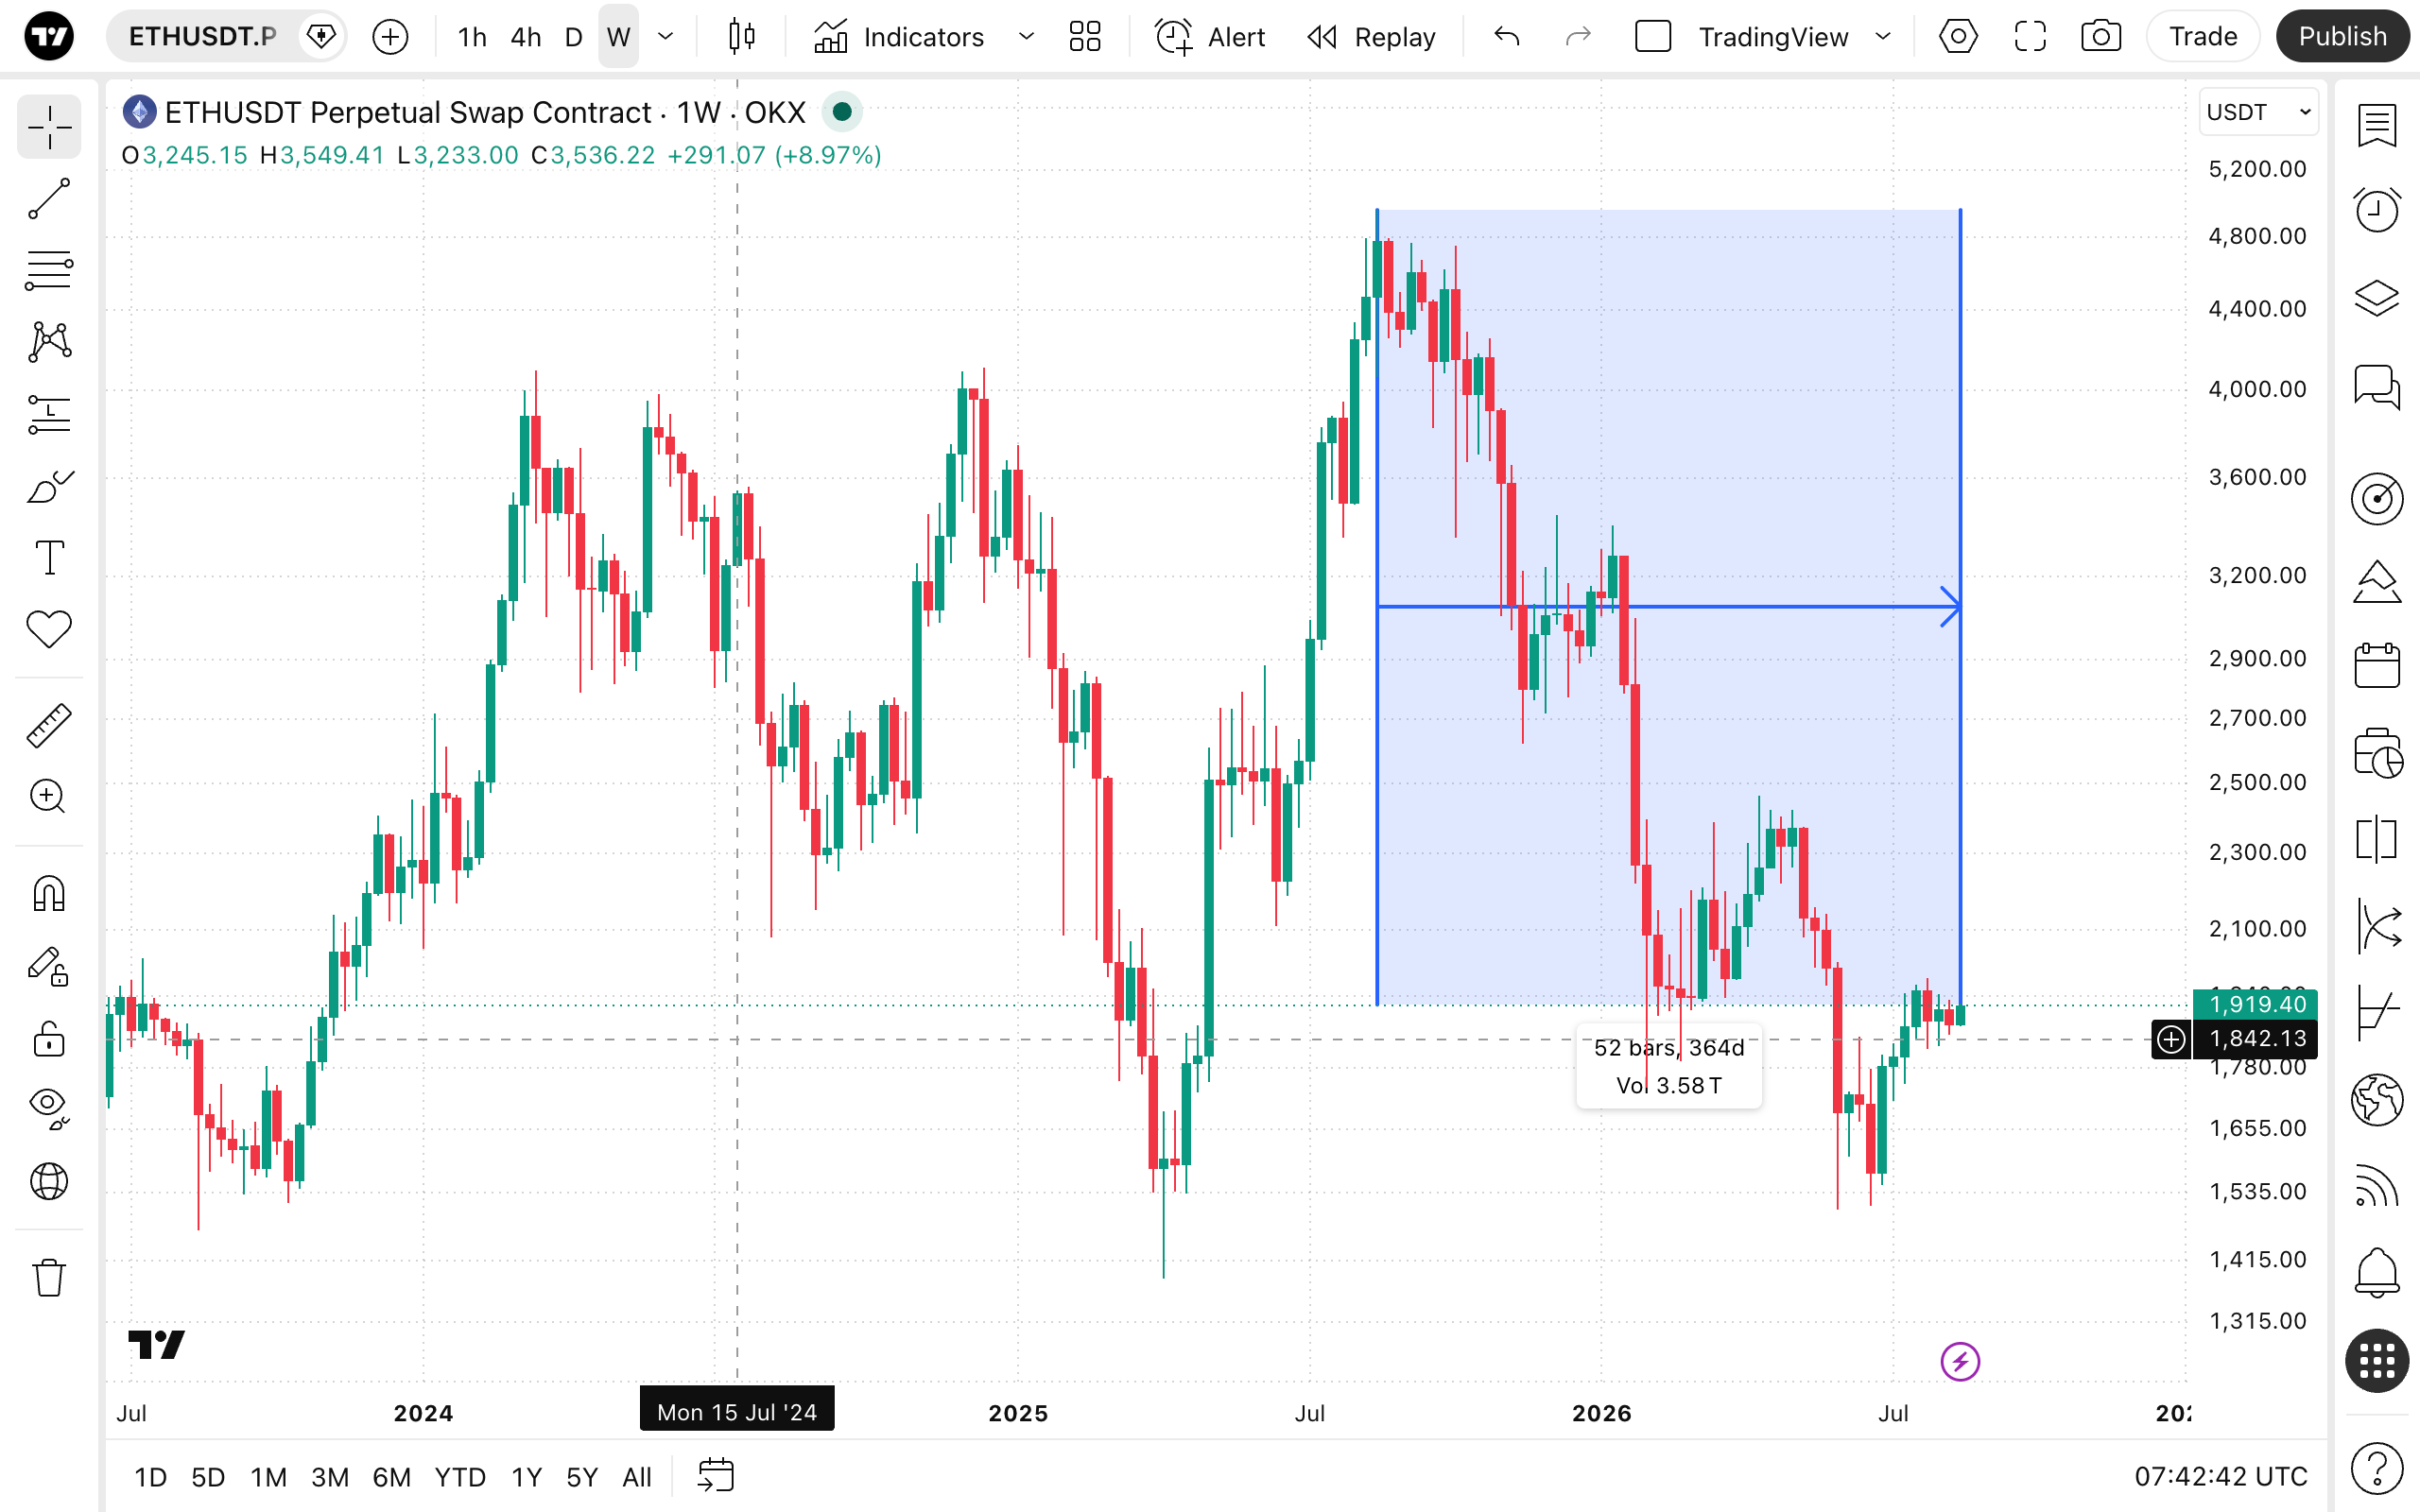
- Date range: Allows the user to place two points horizontally. A shaded box will appear showing the date or time range. The attached text label displays the number of bars, time elapsed, and optionally the volume during that specific period.
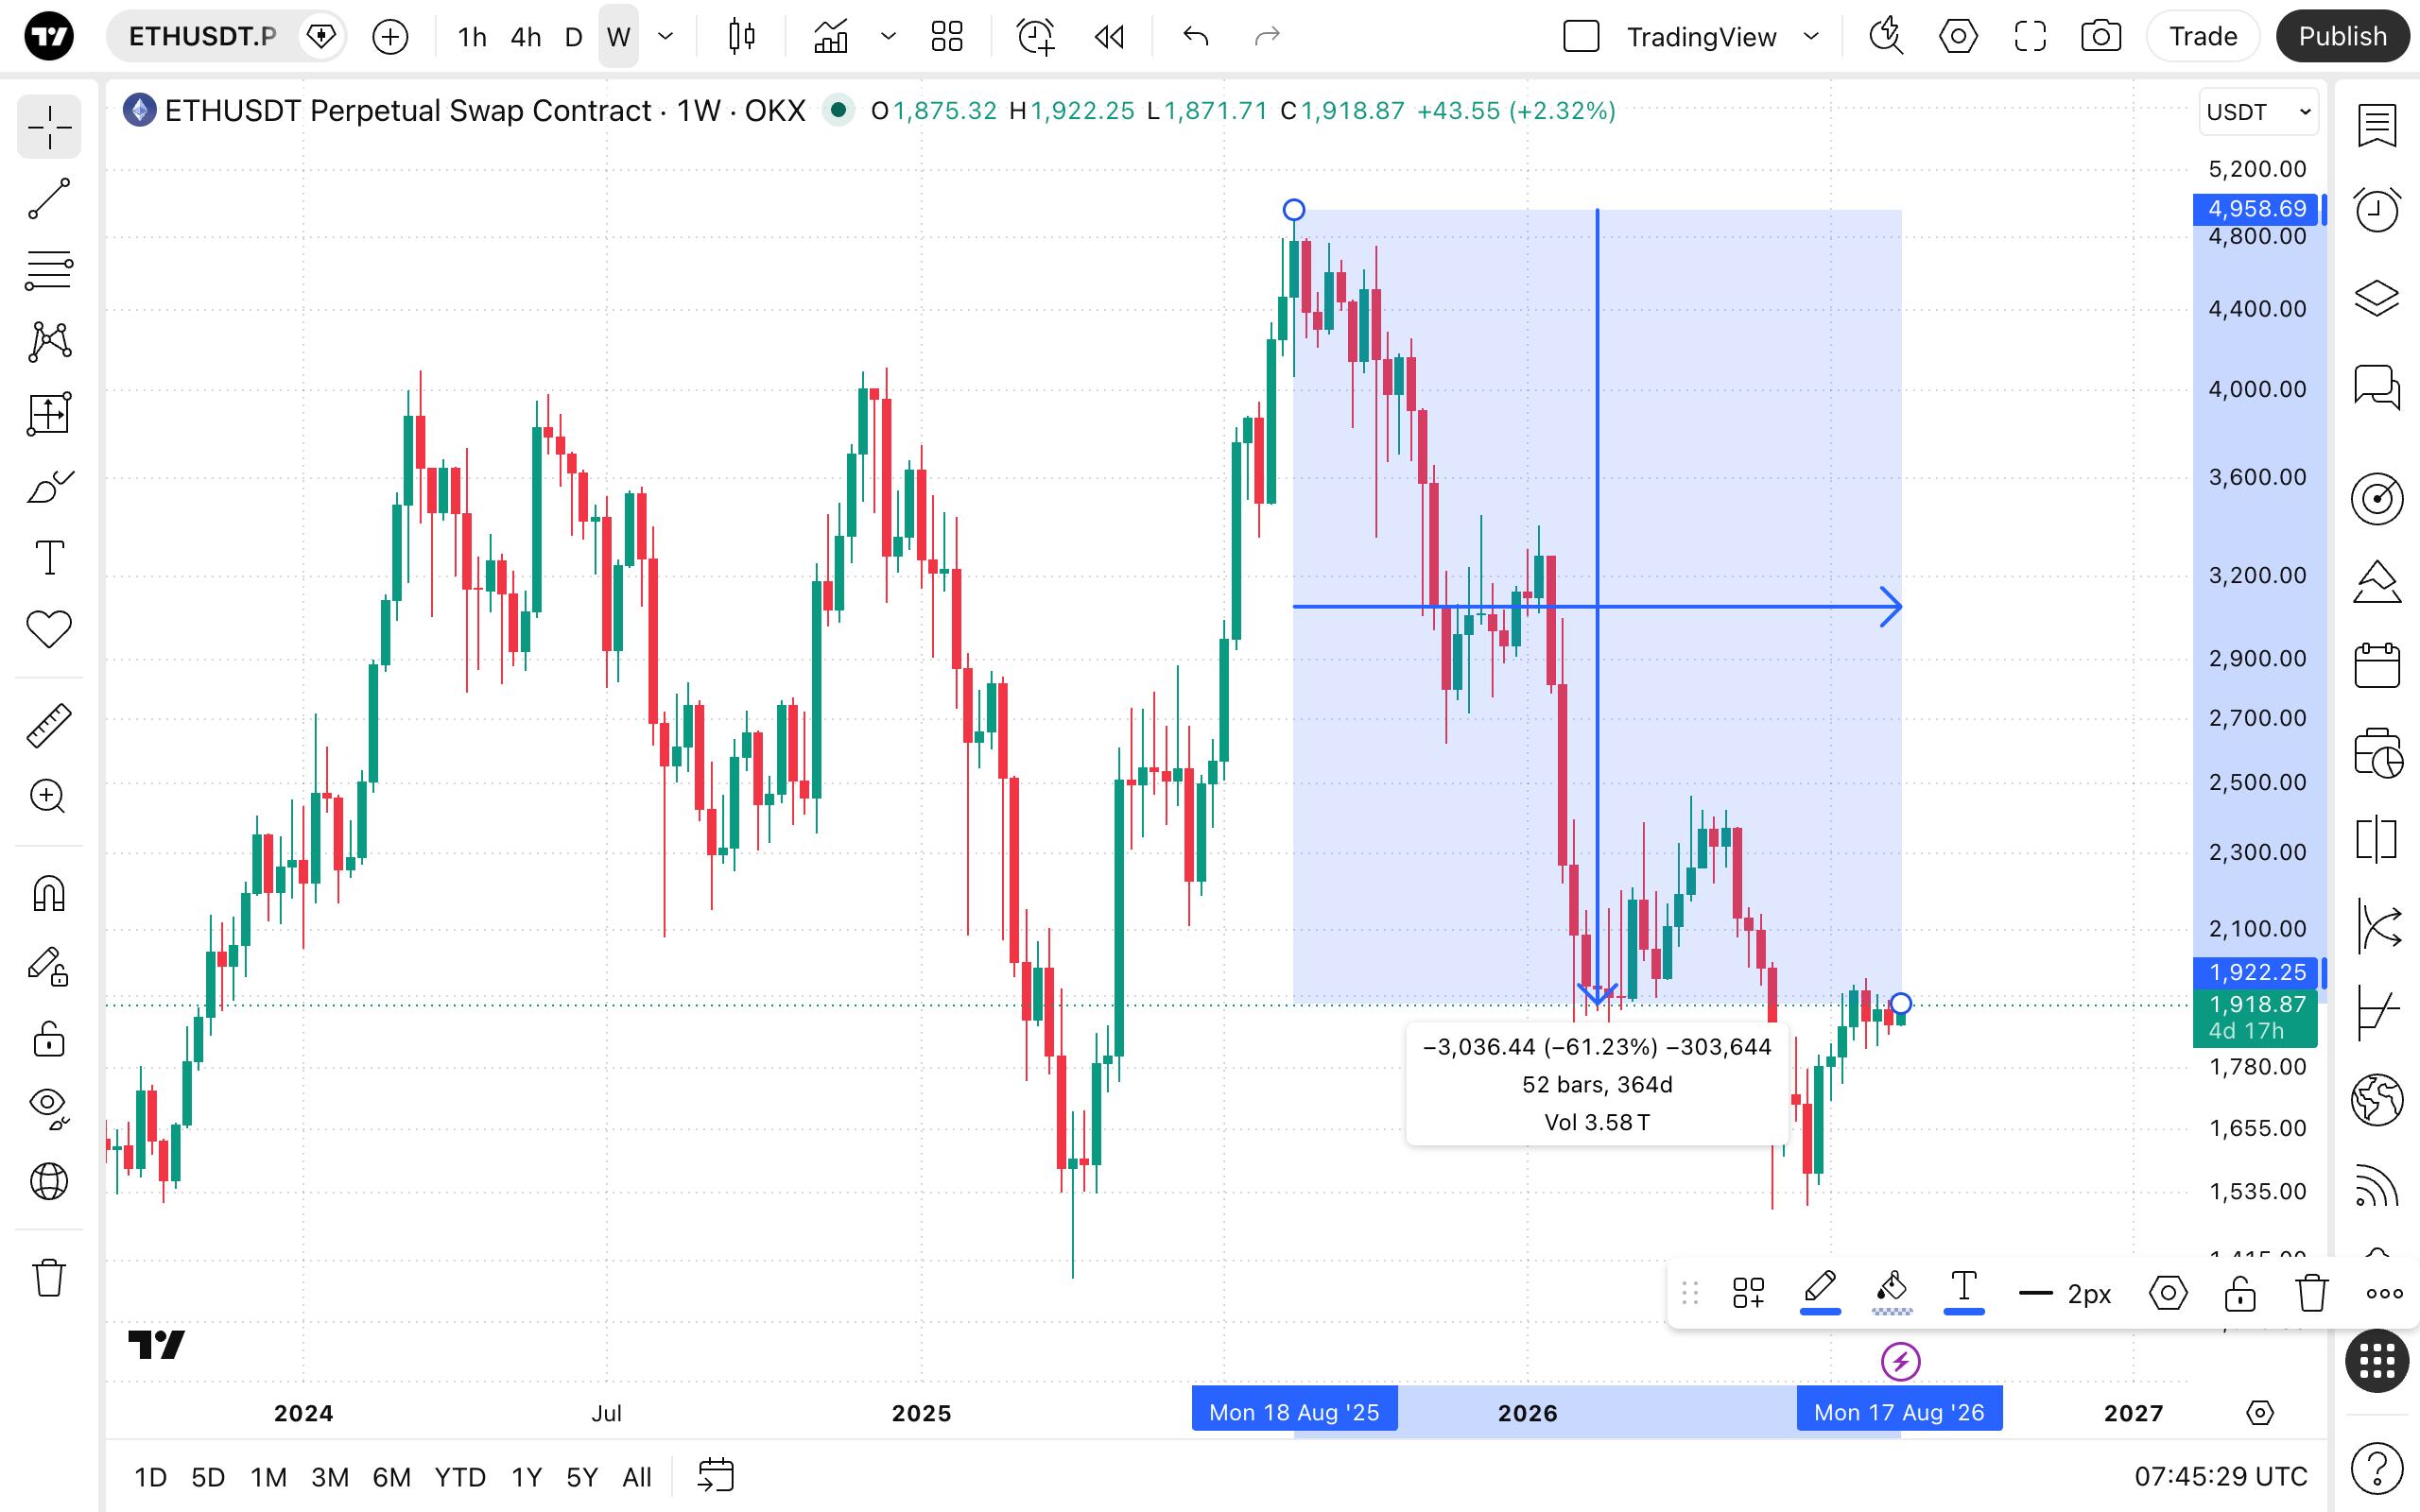
- Date and price range: Combines the functionality of both tools. By placing points diagonally across the chart, a shaded rectangular box appears, displaying both the time elapsed (horizontal measurement) and the price movement (vertical measurement) within a single info label.
Style
In the Style properties dialog, it is possible to change the appearance of these measurement tools. The available options may vary slightly depending on which of the three tools you are using.
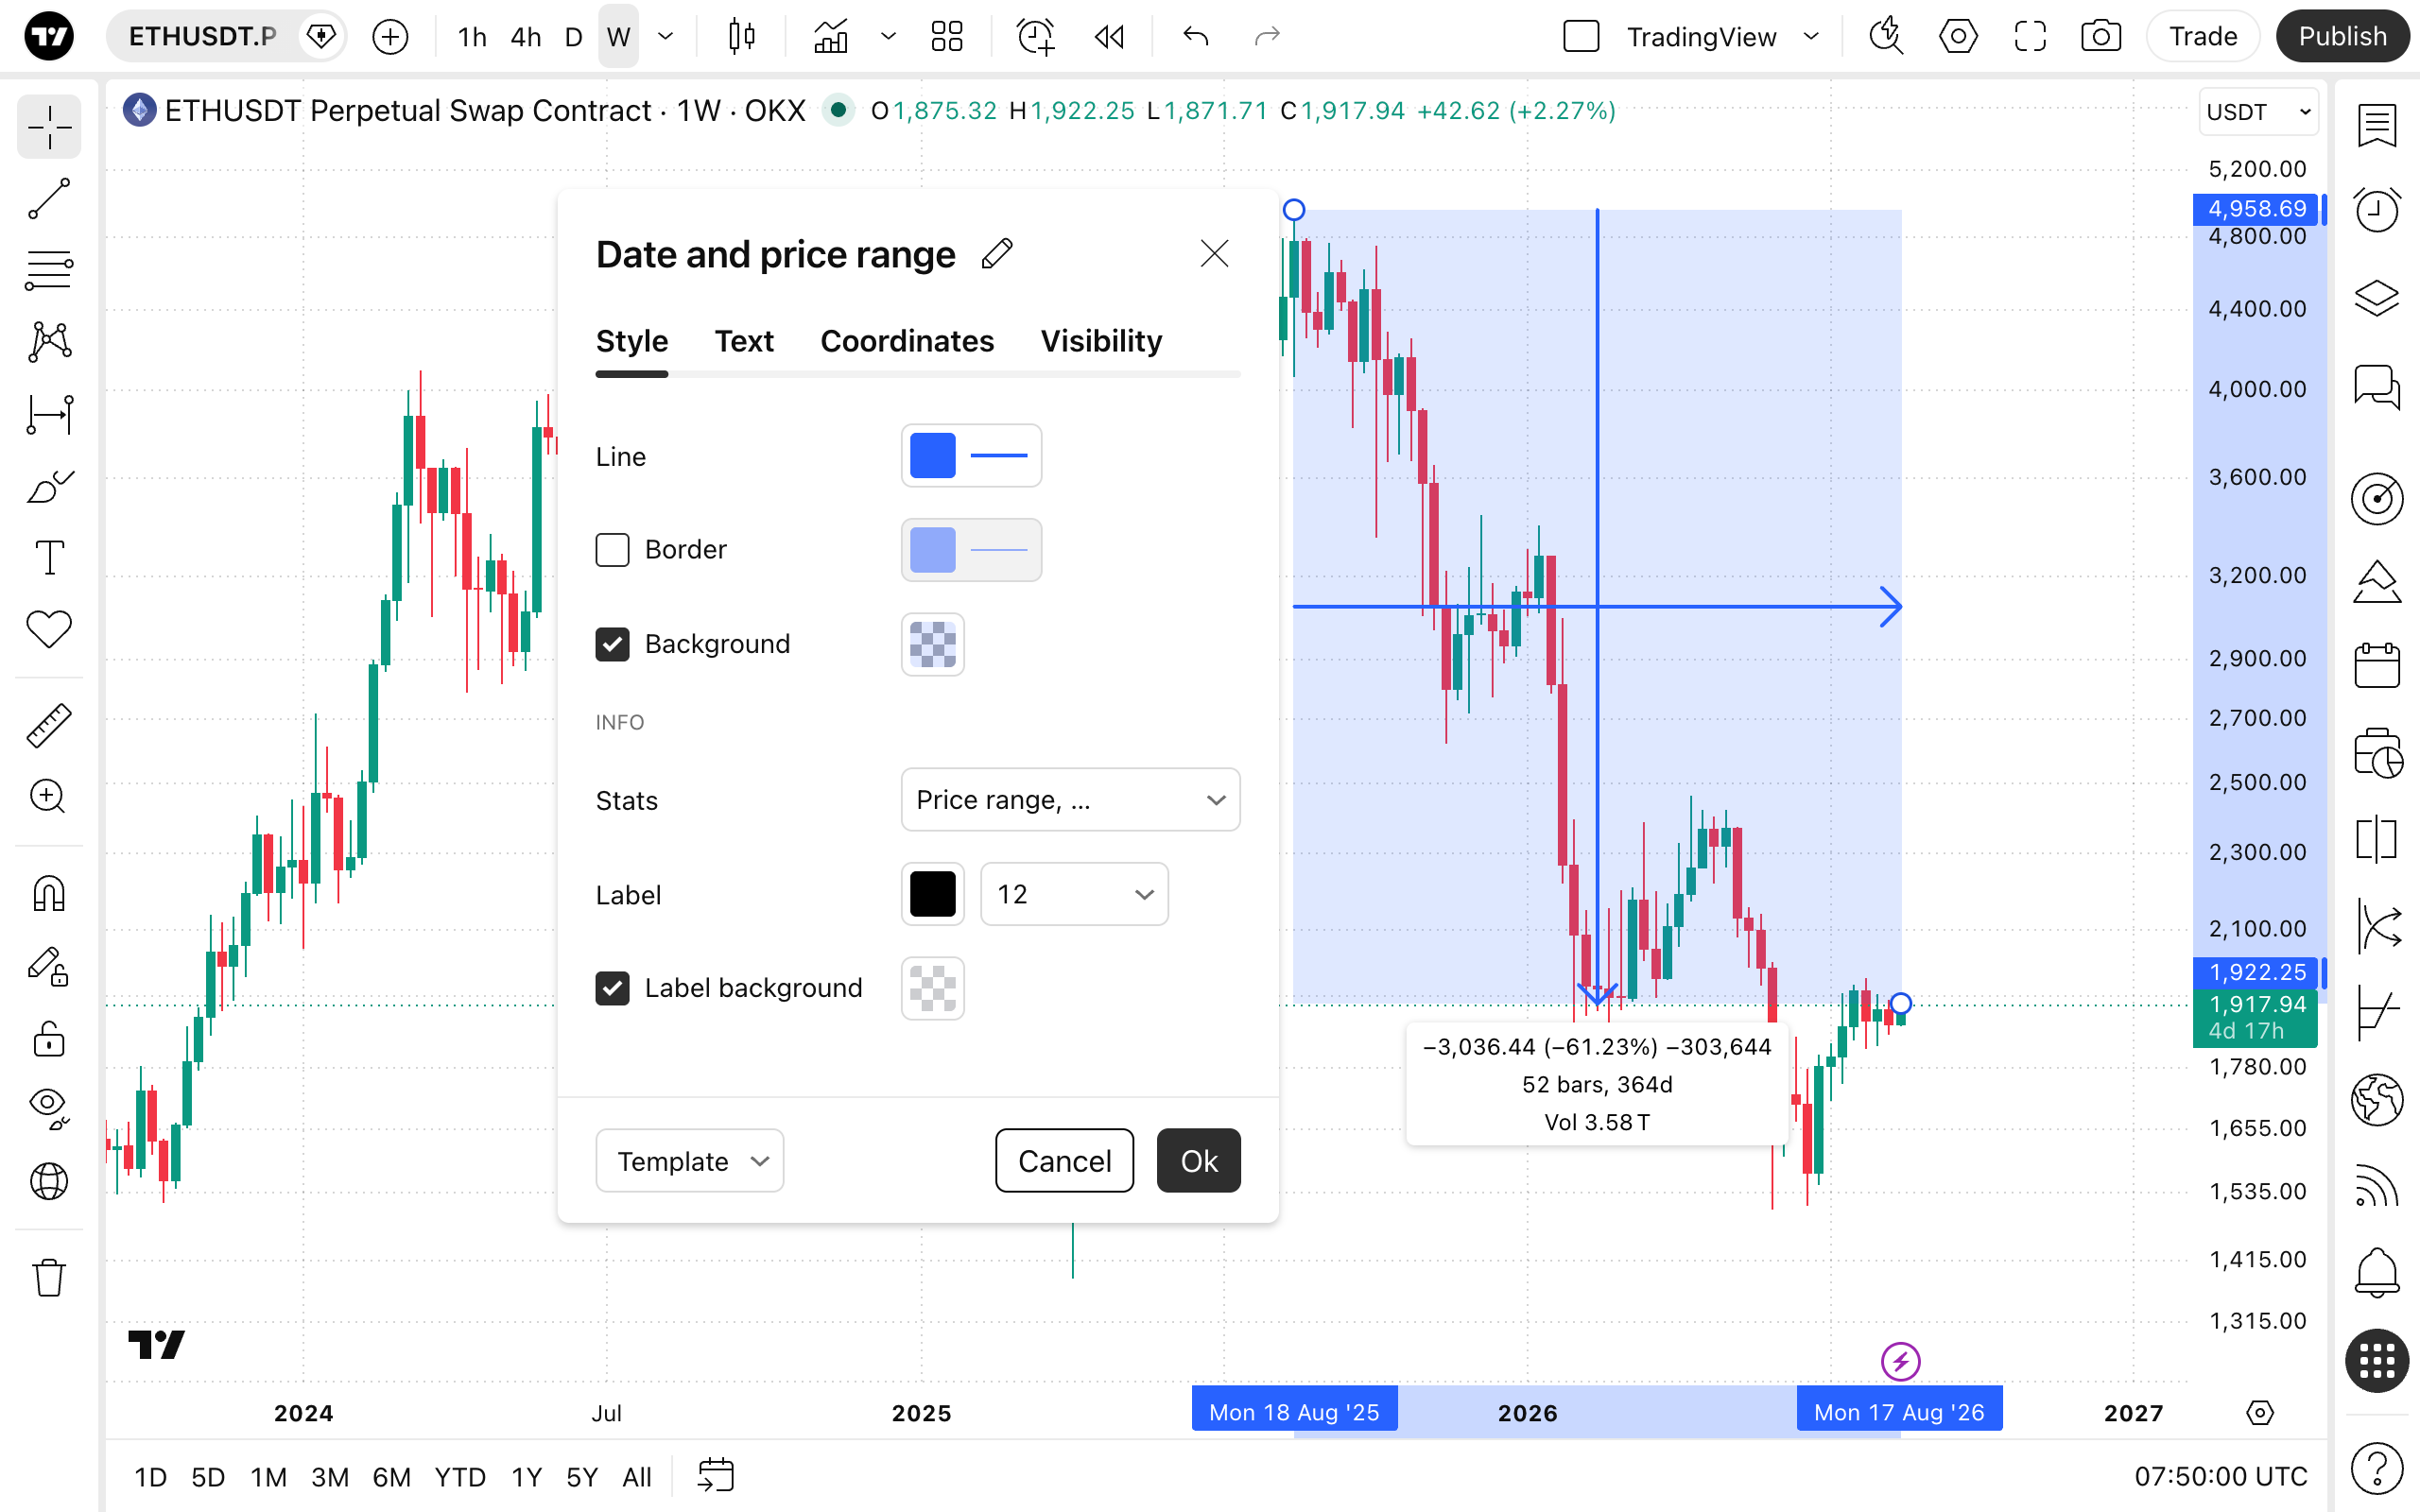
- Line: Sets the color, thickness, and opacity level of the tool's primary boundary line or fill anchor points.
- Border: Toggles the visibility of the outline surrounding the shaded box area, allowing you to change its color, thickness, and line style.
- Background: Toggles the visibility, color, and opacity level of the shaded space inside the drawn box.
- Extend (Date / Price range only): Depending on the tool used, use these checkboxes to extend the drawing vertically (for Date range) or horizontally (for Price range) infinitely across the chart.
Info section
- Stats: Provides a dropdown menu with a checklist of data points to display in the tool's info label. You can toggle any combination of the following:
- Price range: Displays the absolute price difference between the tool's starting point and ending point.
- Percent change: Displays the relative price movement between the two selected points, expressed as a percentage.
- Change in pips: Displays the price movement between the two points measured in pips (or ticks). This is particularly useful for forex and futures traders monitoring standardized price increments.
- Bars range: Displays the total number of chart bars (candlesticks) encompassed within the selected time period.
- Date/time range: Displays the actual calendar time elapsed (e.g., days, hours, minutes) between the first and second anchor points.
- Volume: Displays the total accumulated trading volume that occurred strictly within the selected time range.
- Label: Sets the text color, opacity level, and font size for the statistical information displayed.
- Label background: Toggles the visibility, color, and opacity level of the background box behind the statistical text.
Text
In the Text properties dialog, you can add custom text notes to the drawing tool.
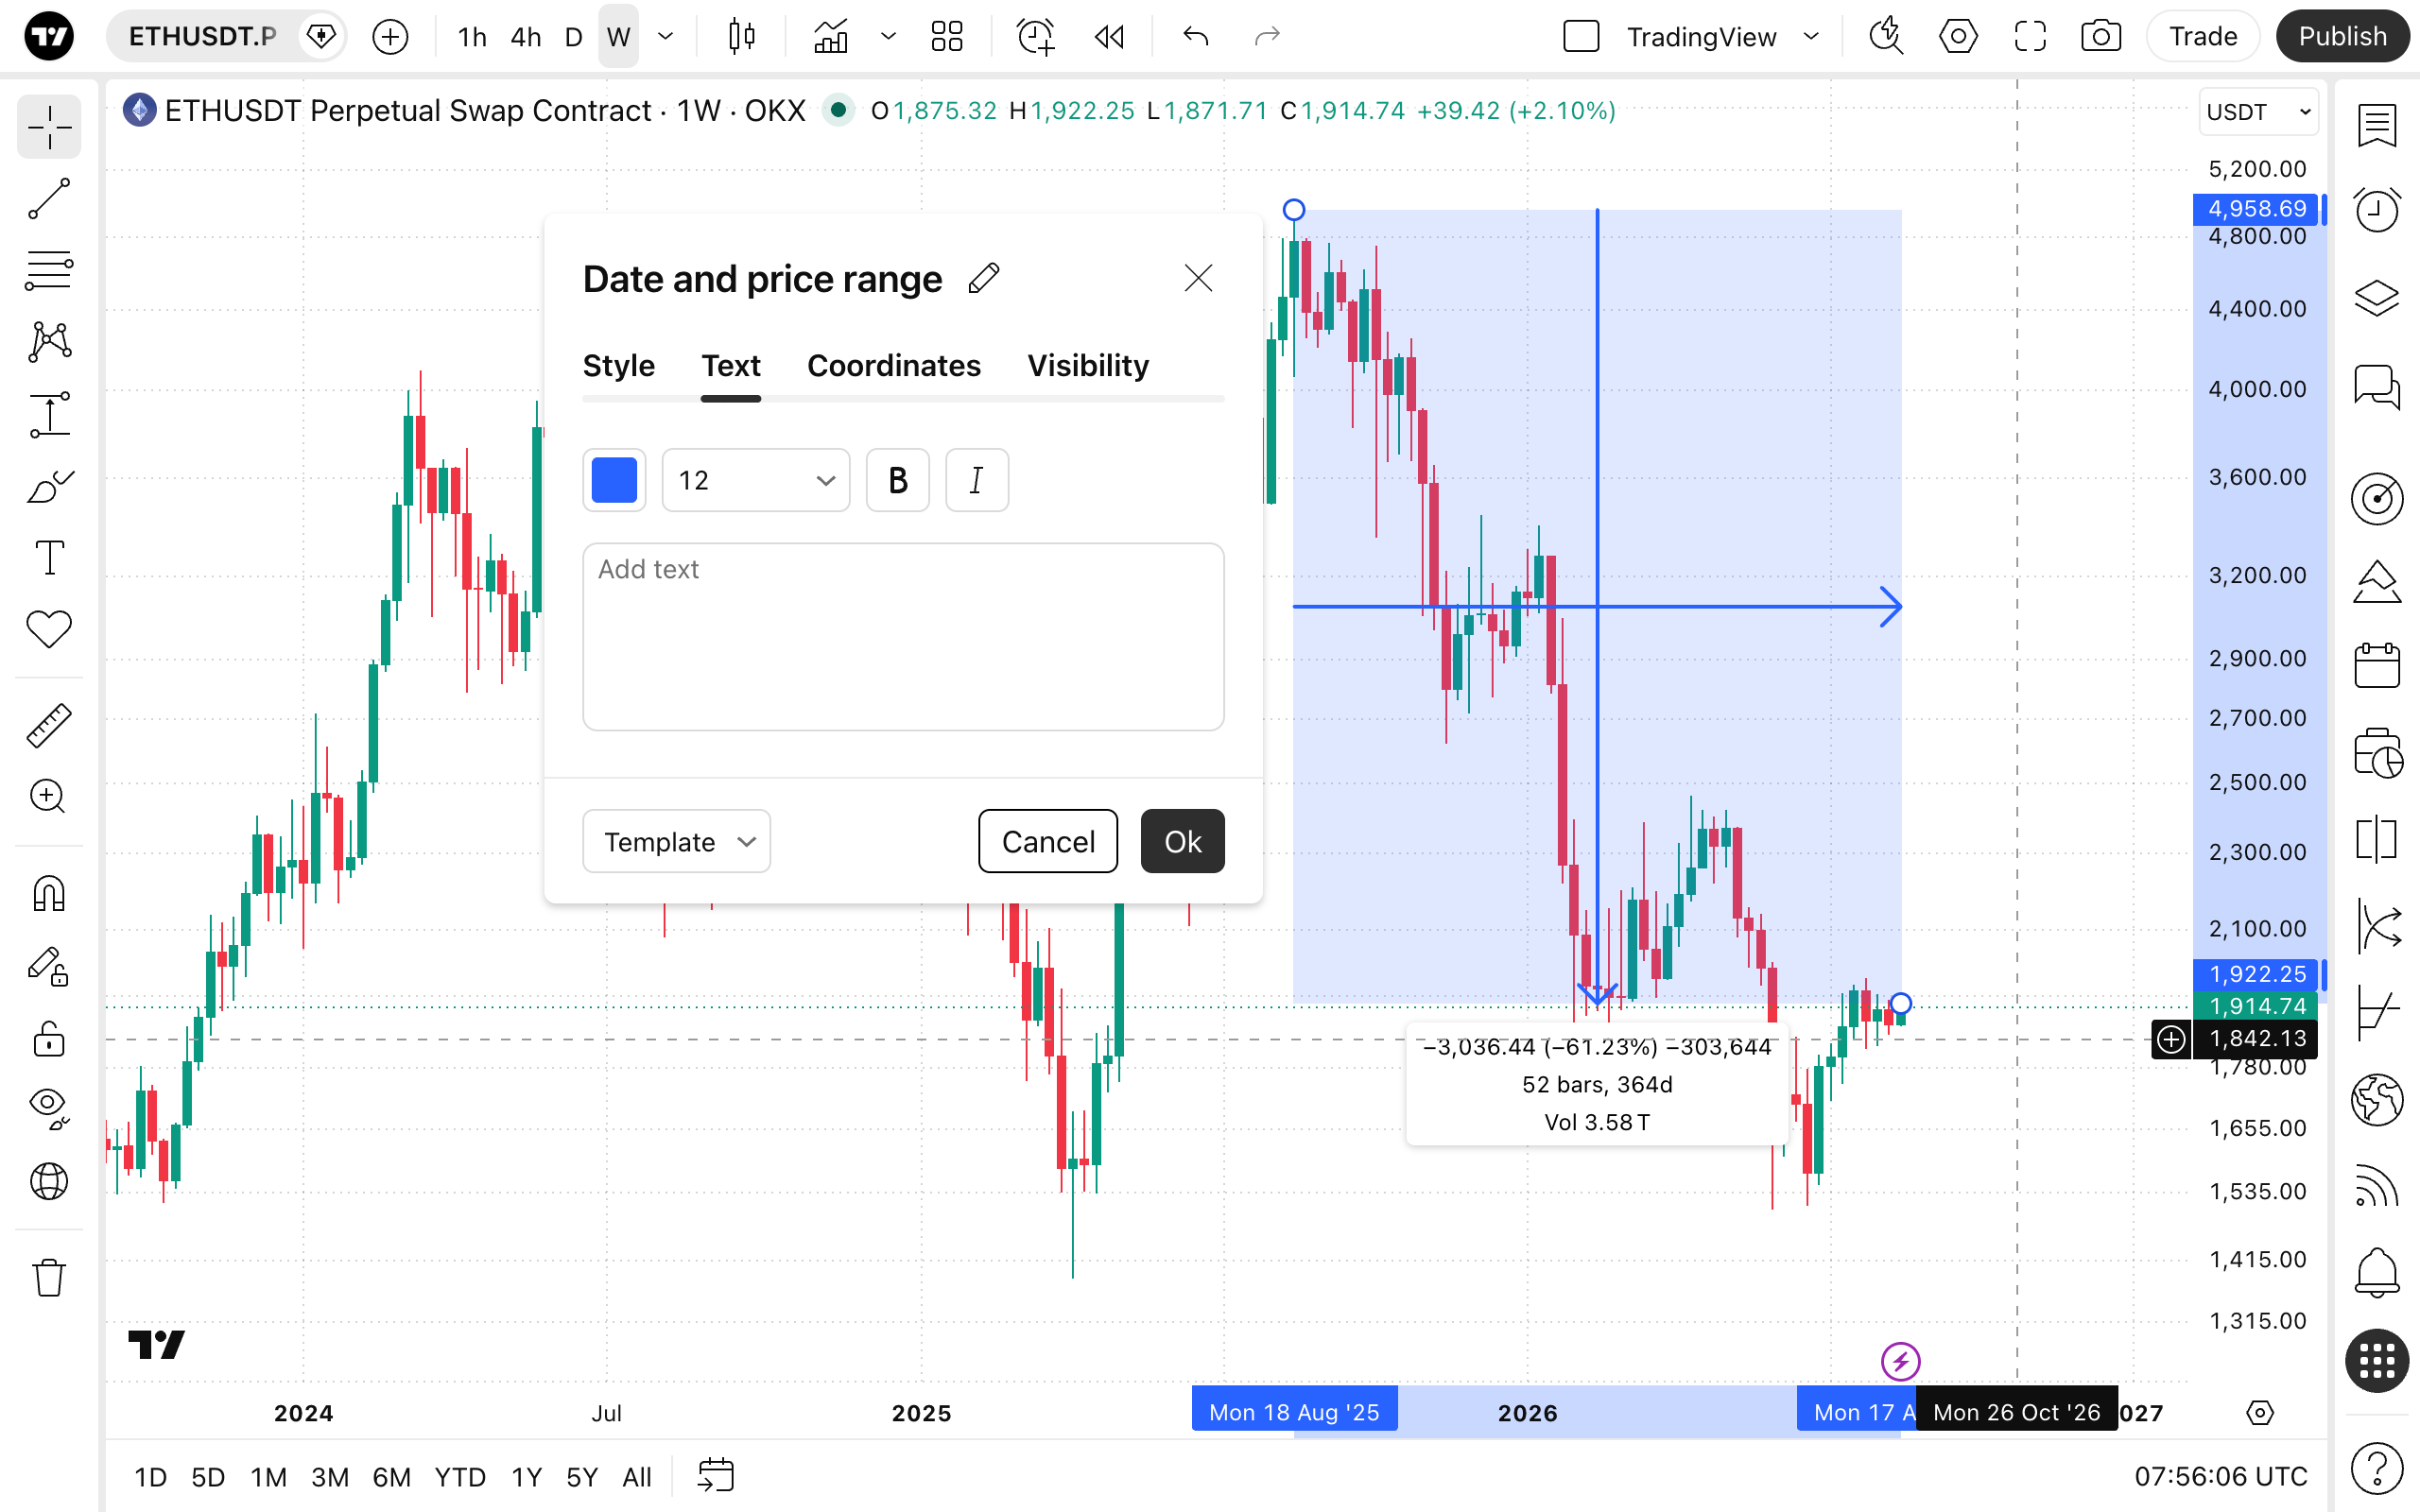
- Text formatting: Allows you to change the text color and font size using the dropdown menu. You can also apply bold and/or italic formatting to the text.
- Text box: A text entry field where you can type custom notes or labels that will be displayed directly on the chart alongside the drawn range box.
Coordinates
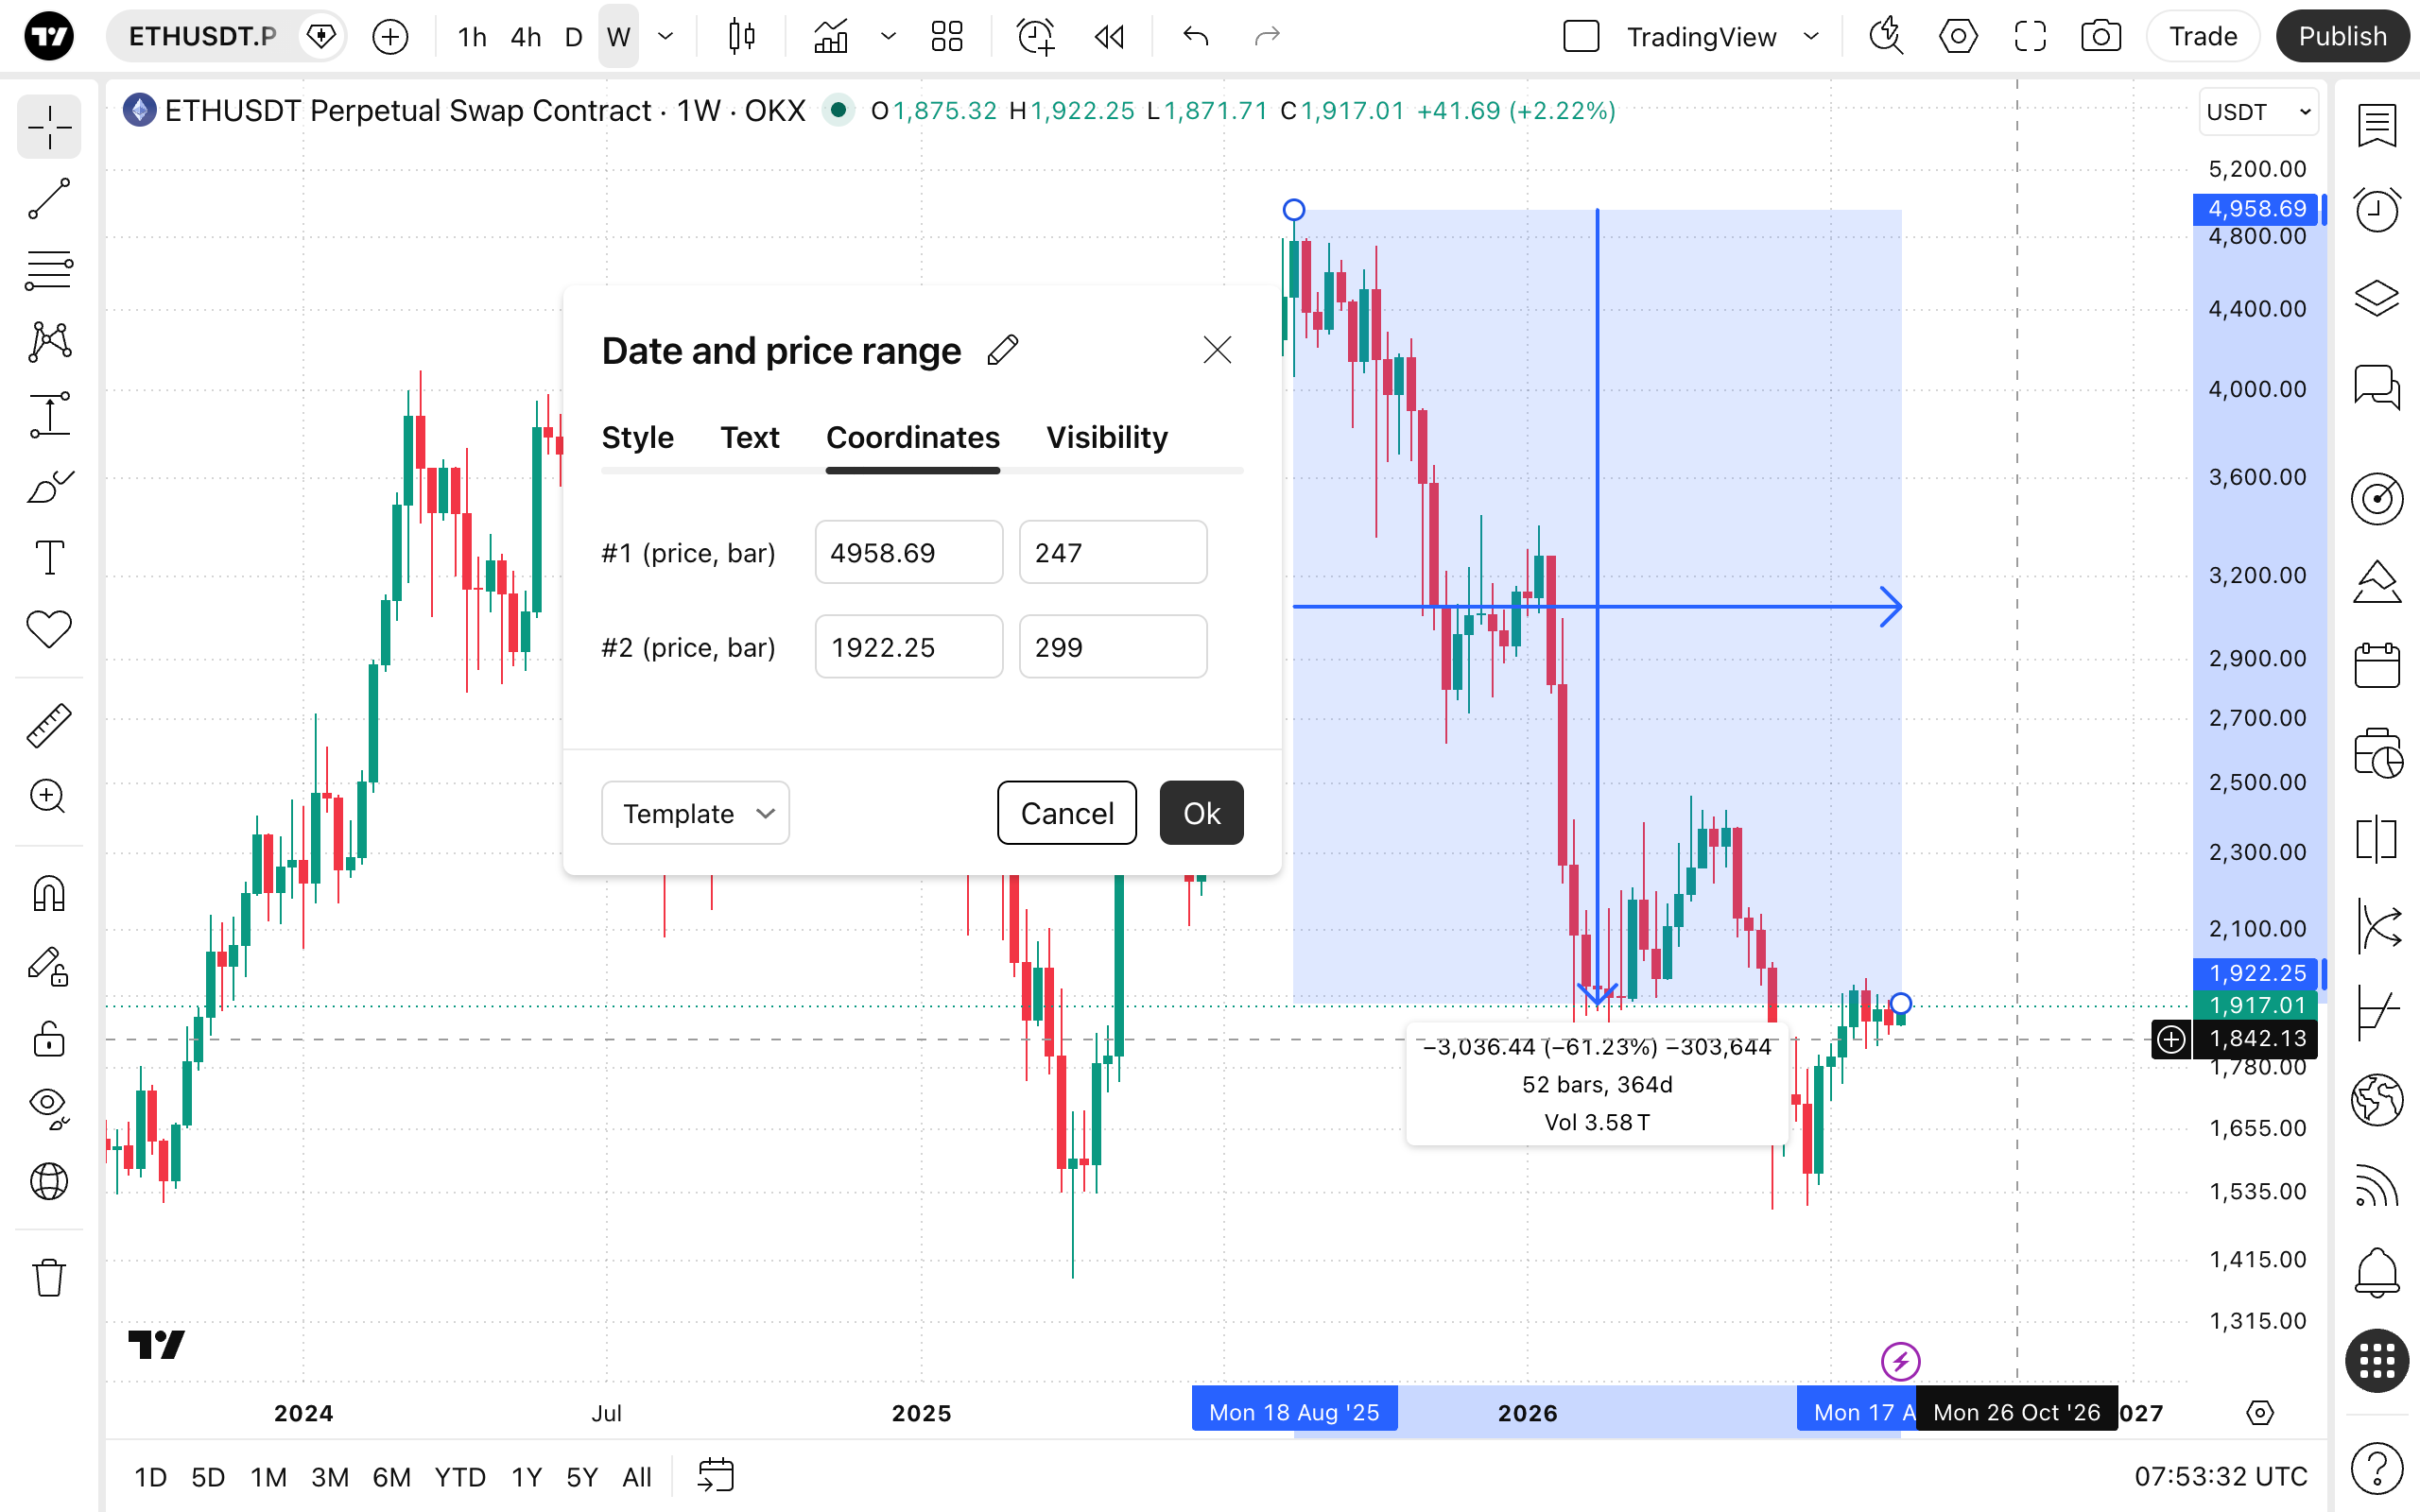
In the Coordinates properties dialog, you can set precisely the position of the tool's anchor points on the price scale (by setting the price) and the time axis (by setting the bar number):
- Price 1: Allows for the precise placement of the tool's first point using the price value and the bar number.
- Price 2: Allows for the precise placement of the tool's second point using the price value and the bar number.
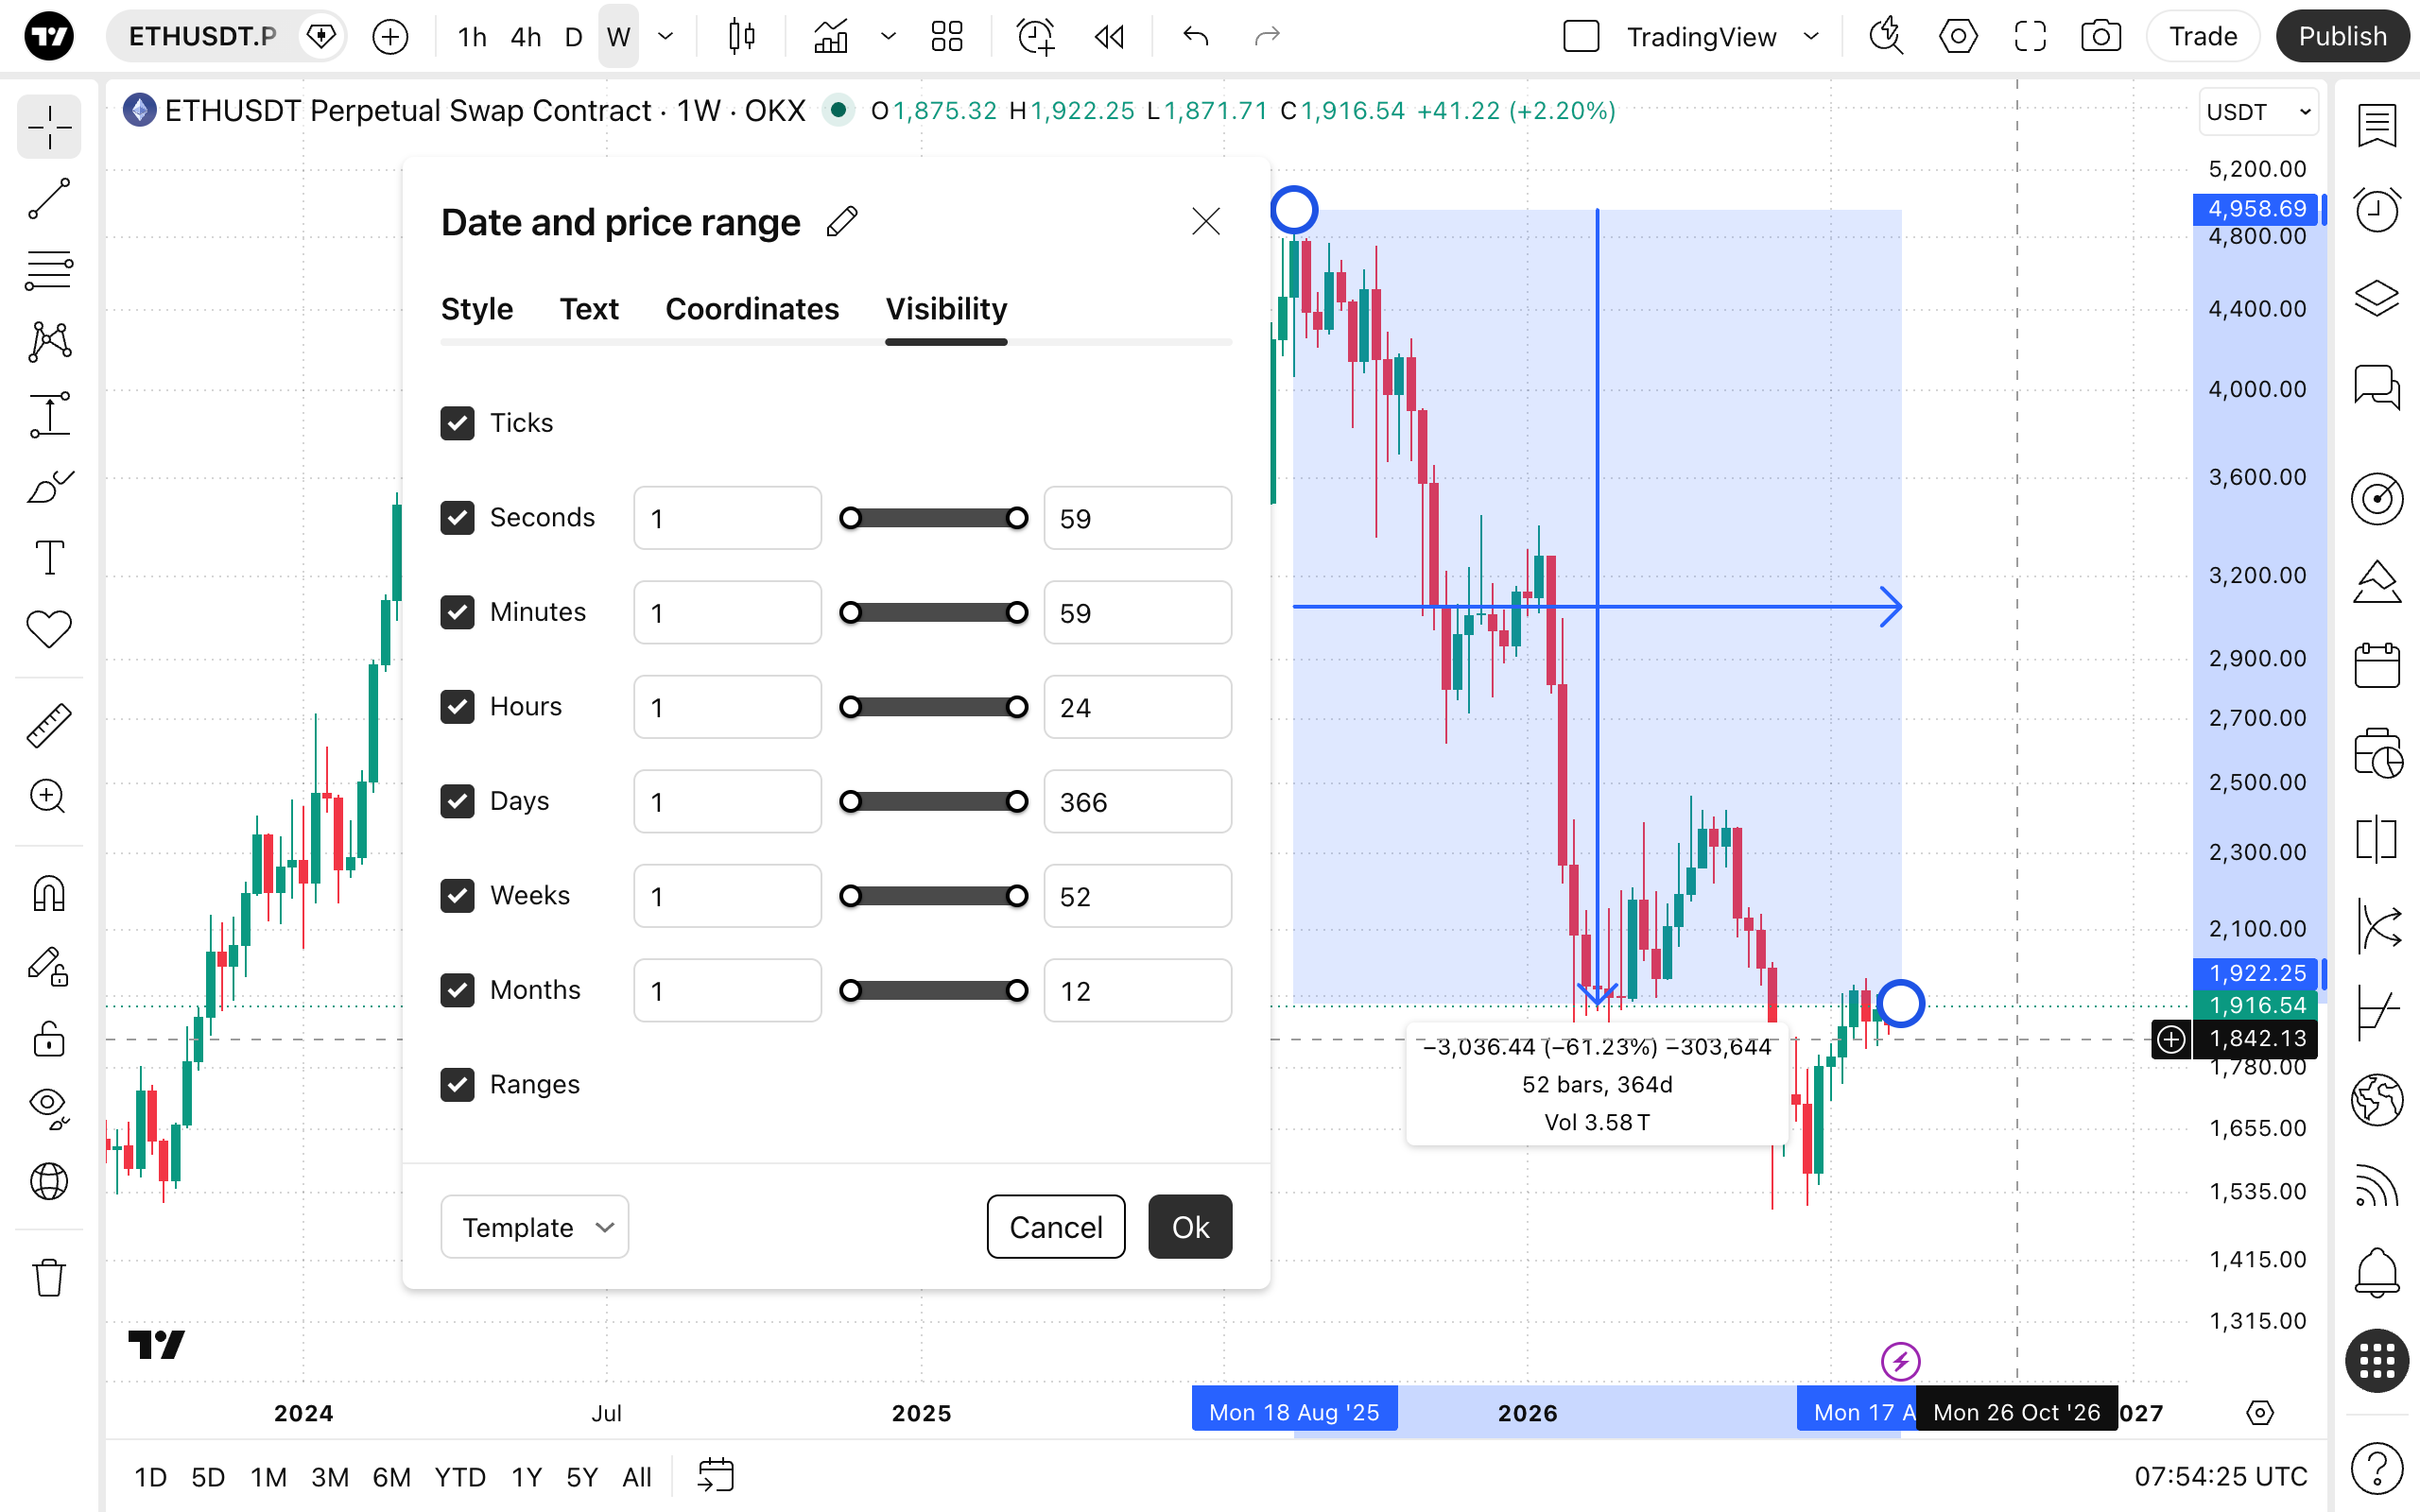
Visibility
In the Visibility properties dialog, you can switch the tool displaying on charts of different chart intervals.