What are second-based intervals
Second-based intervals show price movements in very short time windows. You can configure them to see rapid price changes even within one second. They can help you see exactly when prices jump up or down during the trading day. Essential for high-frequency trading strategies and precise entry timing, you can use them on our Supercharts along with many other tools.
CONTENTS:
- What are second-based intervals
- Second-based intervals vs tick-based intervals
- How to enable second-based intervals
- Custom second-based intervals
- Additional tools for second-based trading
What are second-based intervals
If you're an intraday trader, seconds matter. With intervals based on seconds, you can see price action almost in real time and respond quickly. They're especially helpful during high volatility and news-driven events.
The interval is displayed on the X (horizontal) axis of the Supercharts. After a certain amount of time passes, new elements are added. For example, if you select the hollow candle chart type and a 10-second interval, each candle will represent ten seconds of price movement regardless of how sharp or still it's been.
On TradingView, you can choose an interval that fits your strategy:
- Standard second-based intervals (1, 5, 10, 15, 30, and 45 seconds) are available starting from the Plus plan
- Custom second-based intervals from 1 to 299 seconds are available on the Ultimate plan
Second-based intervals vs tick-based intervals
These two intervals are similar in that they can both present the most precise data when plotting a chart's elements. A second is the smallest amount of time, and a tick is the smallest amount of price.
The core difference between these two is that the first is a time-based interval and the second is a price-based interval. Because of that, they present you with different opportunities.
Second-based intervals
- Use time on the X (horizontal) axis of the chart
- Work with any chart type
- May clutter your chart with empty and less informative elements during periods of low trading activity or for assets with low liquidity
Tick-based intervals
- Use price for the X (horizontal) axis of the chart
- Don't work with Renko, line break, Kagi, point and figure, and range charts
- Filter out quiet periods automatically
How to enable second-based intervals
These intervals are available for the most liquid symbols, including stocks, indices, cryptocurrencies, and futures.
After you've chosen one of these symbols, click on "Chart interval" on the upper toolbar and select the desired interval.
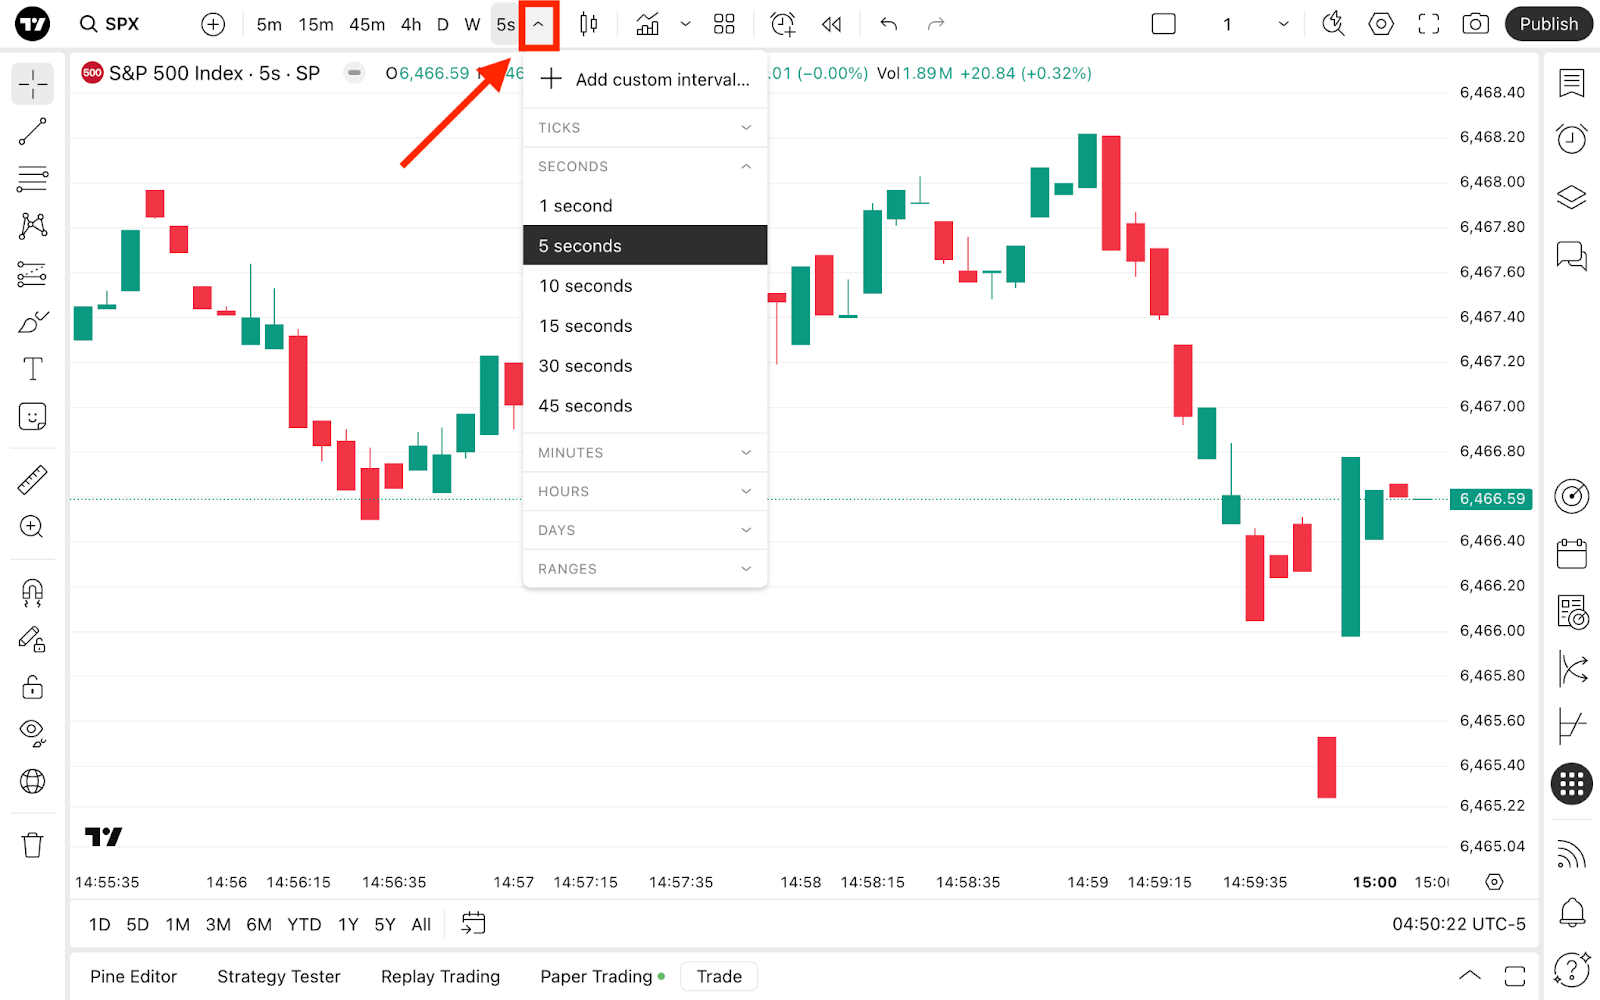
Or simply start typing the number you want to set your Supercharts to. For example, 1S, 10S, etc.
Custom second-based intervals
If the standard intervals don't fit your strategy, you can set your own. On the Ultimate plan, any second-based interval from 1 to 299 seconds is available, for example 7, 20, or 92 seconds.
To add your own second-based interval:
- Click "Chart interval" on the top toolbar
- Select "Add custom interval"
- Enter the number of seconds and select the "seconds" interval type
- Click "Add"
The new interval appears in the "Chart interval" menu and stays there after the page reloads. You can add it to favorites to keep it on the top toolbar.
Another way is to type right on the chart, for example 20S, and press Enter.
Custom second-based intervals work the same way as standard ones: on the chart, in Bar Replay, with Pine Script® indicators and strategies, and in alerts.
Additional tools for second-based trading
If you need maximum precision for scalping or momentum trading, second-based intervals can be complemented with indicators such as Stochastic RSI, MACD, or Pivot points. Also, explore our indicator templates, create your own and share them with the global community of like-minded traders.
Additionally, you can try the Fibonacci retracement and rectangle drawing tools to identify the potential pullback and resistance/support zones.
Continue exploring our custom intervals, chart types and many other tools and pages to stay sharp with the market and be prepared for the next trading opportunity.
Also read: