TradingView Strategy Report: How to start
A Strategy Report is a tool for testing trading ideas. Indicators display data and signals on the chart, while strategies automatically generate a result report.
How to launch a strategy
- On Supercharts, click the "Indicators" button in the upper toolbar or use the " / " hotkey.
- Use the search bar or select a strategy manually in Technicals → Strategies or Community.
When selected, the Strategy Report will open at the bottom of the screen.
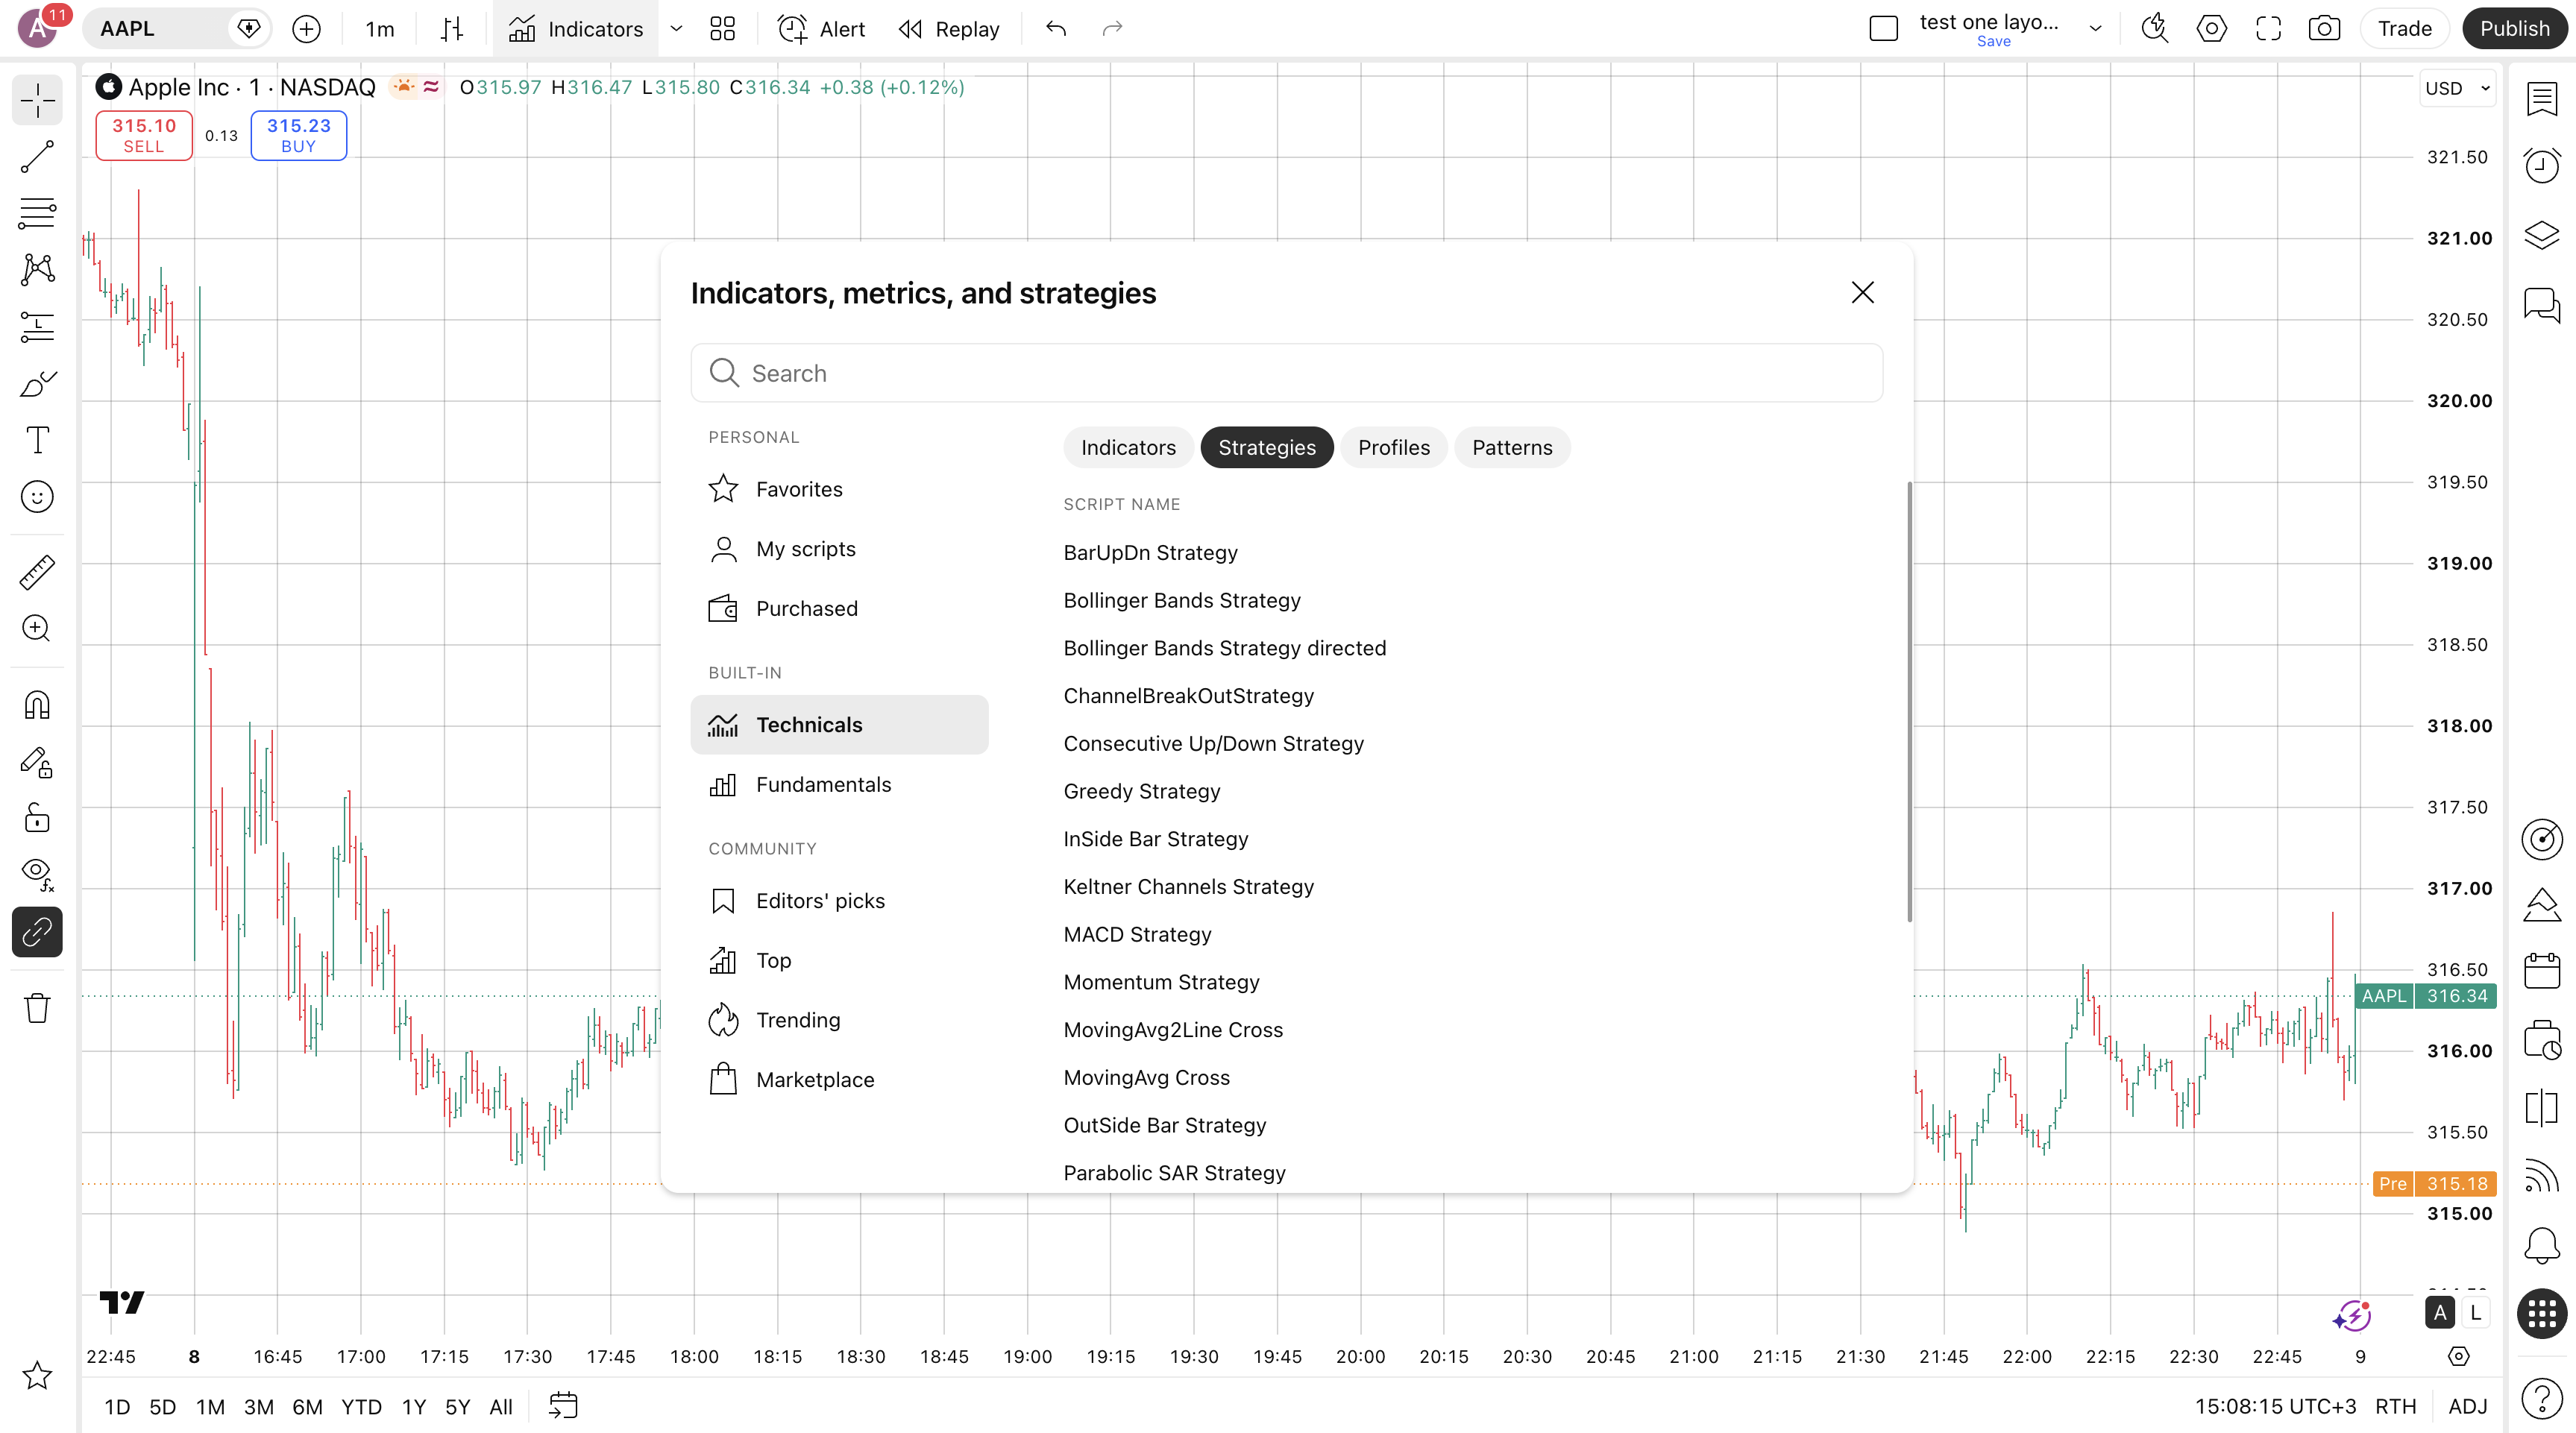
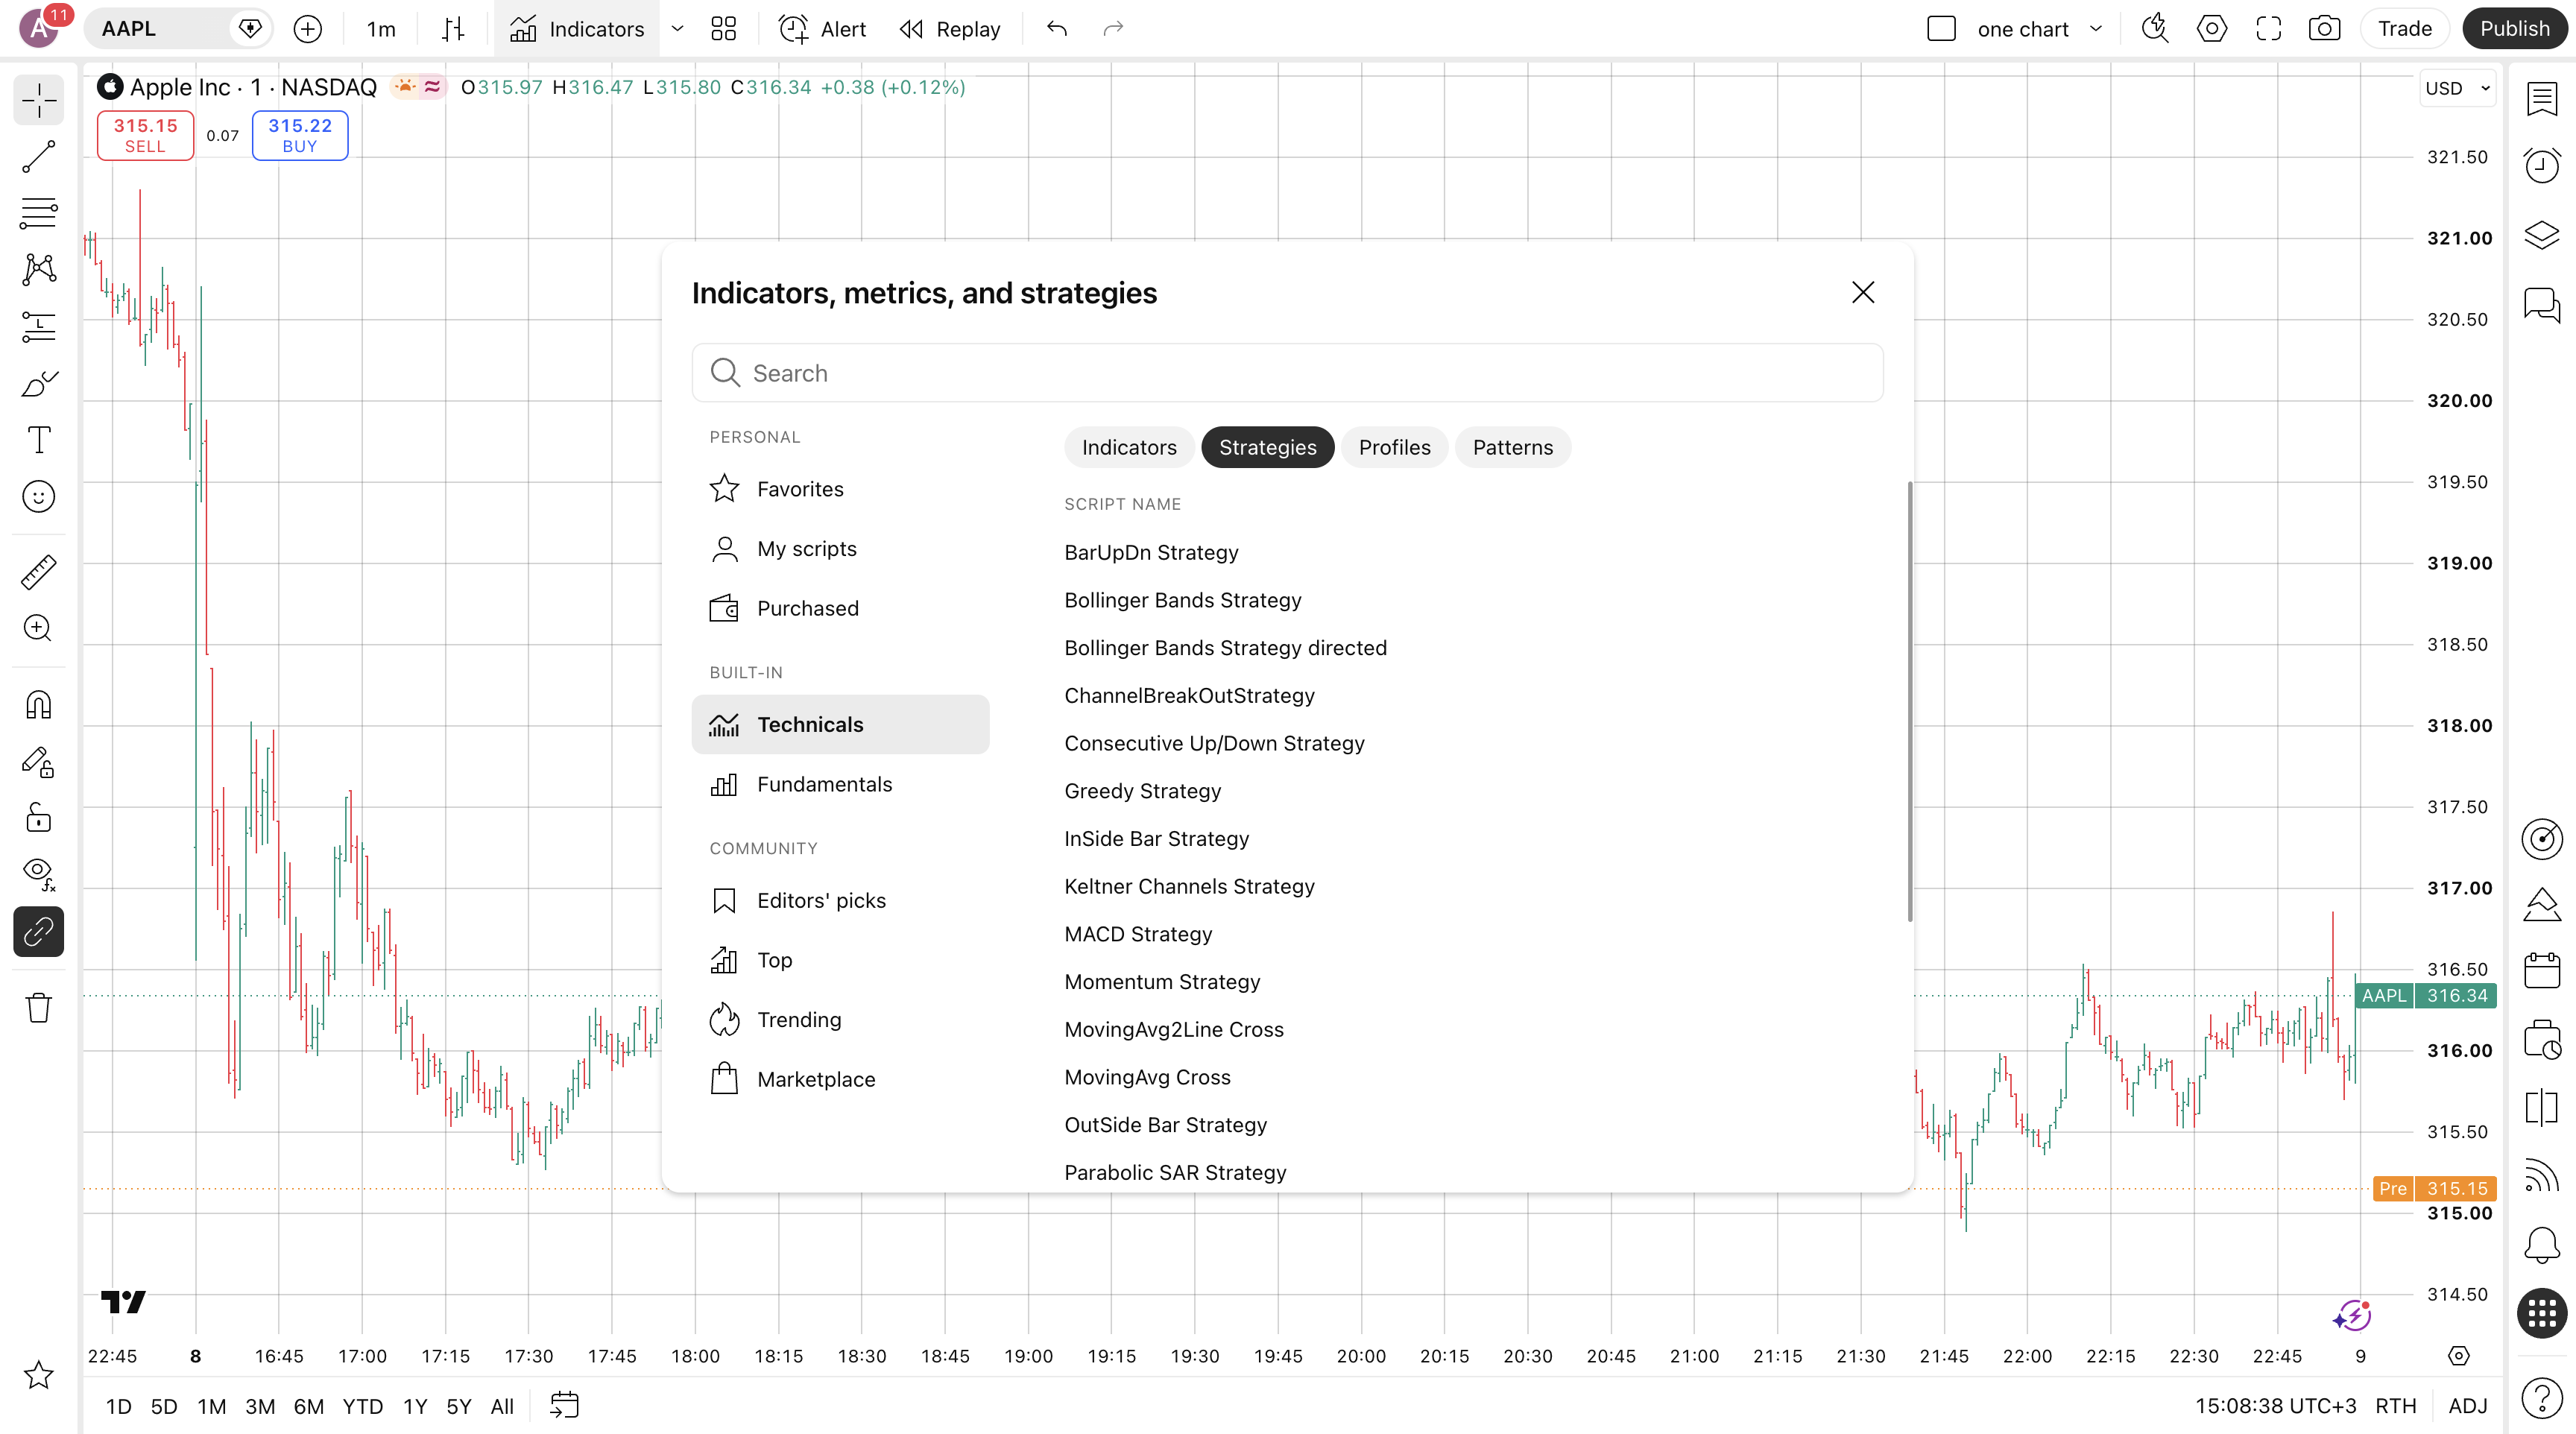
The Strategy Report opens automatically when you add any strategy and shows how your trading system would have performed on historical data. Only one strategy can run on a chart at a time.
Types of strategies
- Personal strategies: Your own strategies written in Pine Script, those you’ve saved to Favorites or those you've purchased.
- Built-in Strategies: Ready-made by TradingView for a quick start.
- Community strategies: Created by other traders and available for free, located under Indicators → Community.
Interface
Metrics
When you add a strategy, the "Metrics" tab displays the key metrics and charts:
- Equity chart: Shows how equity changes over time. Its appearance depends on the selected strategy
- Date range: Allows you to select the time period for displaying results
- Total P&L: Overall profit or loss (shown in currency and percentage)
- Max drawdown: The greatest loss drawdown, i.e., the greatest possible loss the strategy had compared to its highest profits
- Profitable trades: The percentage of winning trades, the number of winning trades divided by the total number of closed trades
- Profit factor: The amount of money the strategy made for every unit of money it lost, gross profits divided by gross losses
- Buy&hold: Adds an alternative buy-and-hold scenario to the chart for comparison with the strategy
- Trades run-up&drawdown: Displays the extreme values for each trade: maximum unrealized profit (run-up) and maximum drawdown (drawdown)
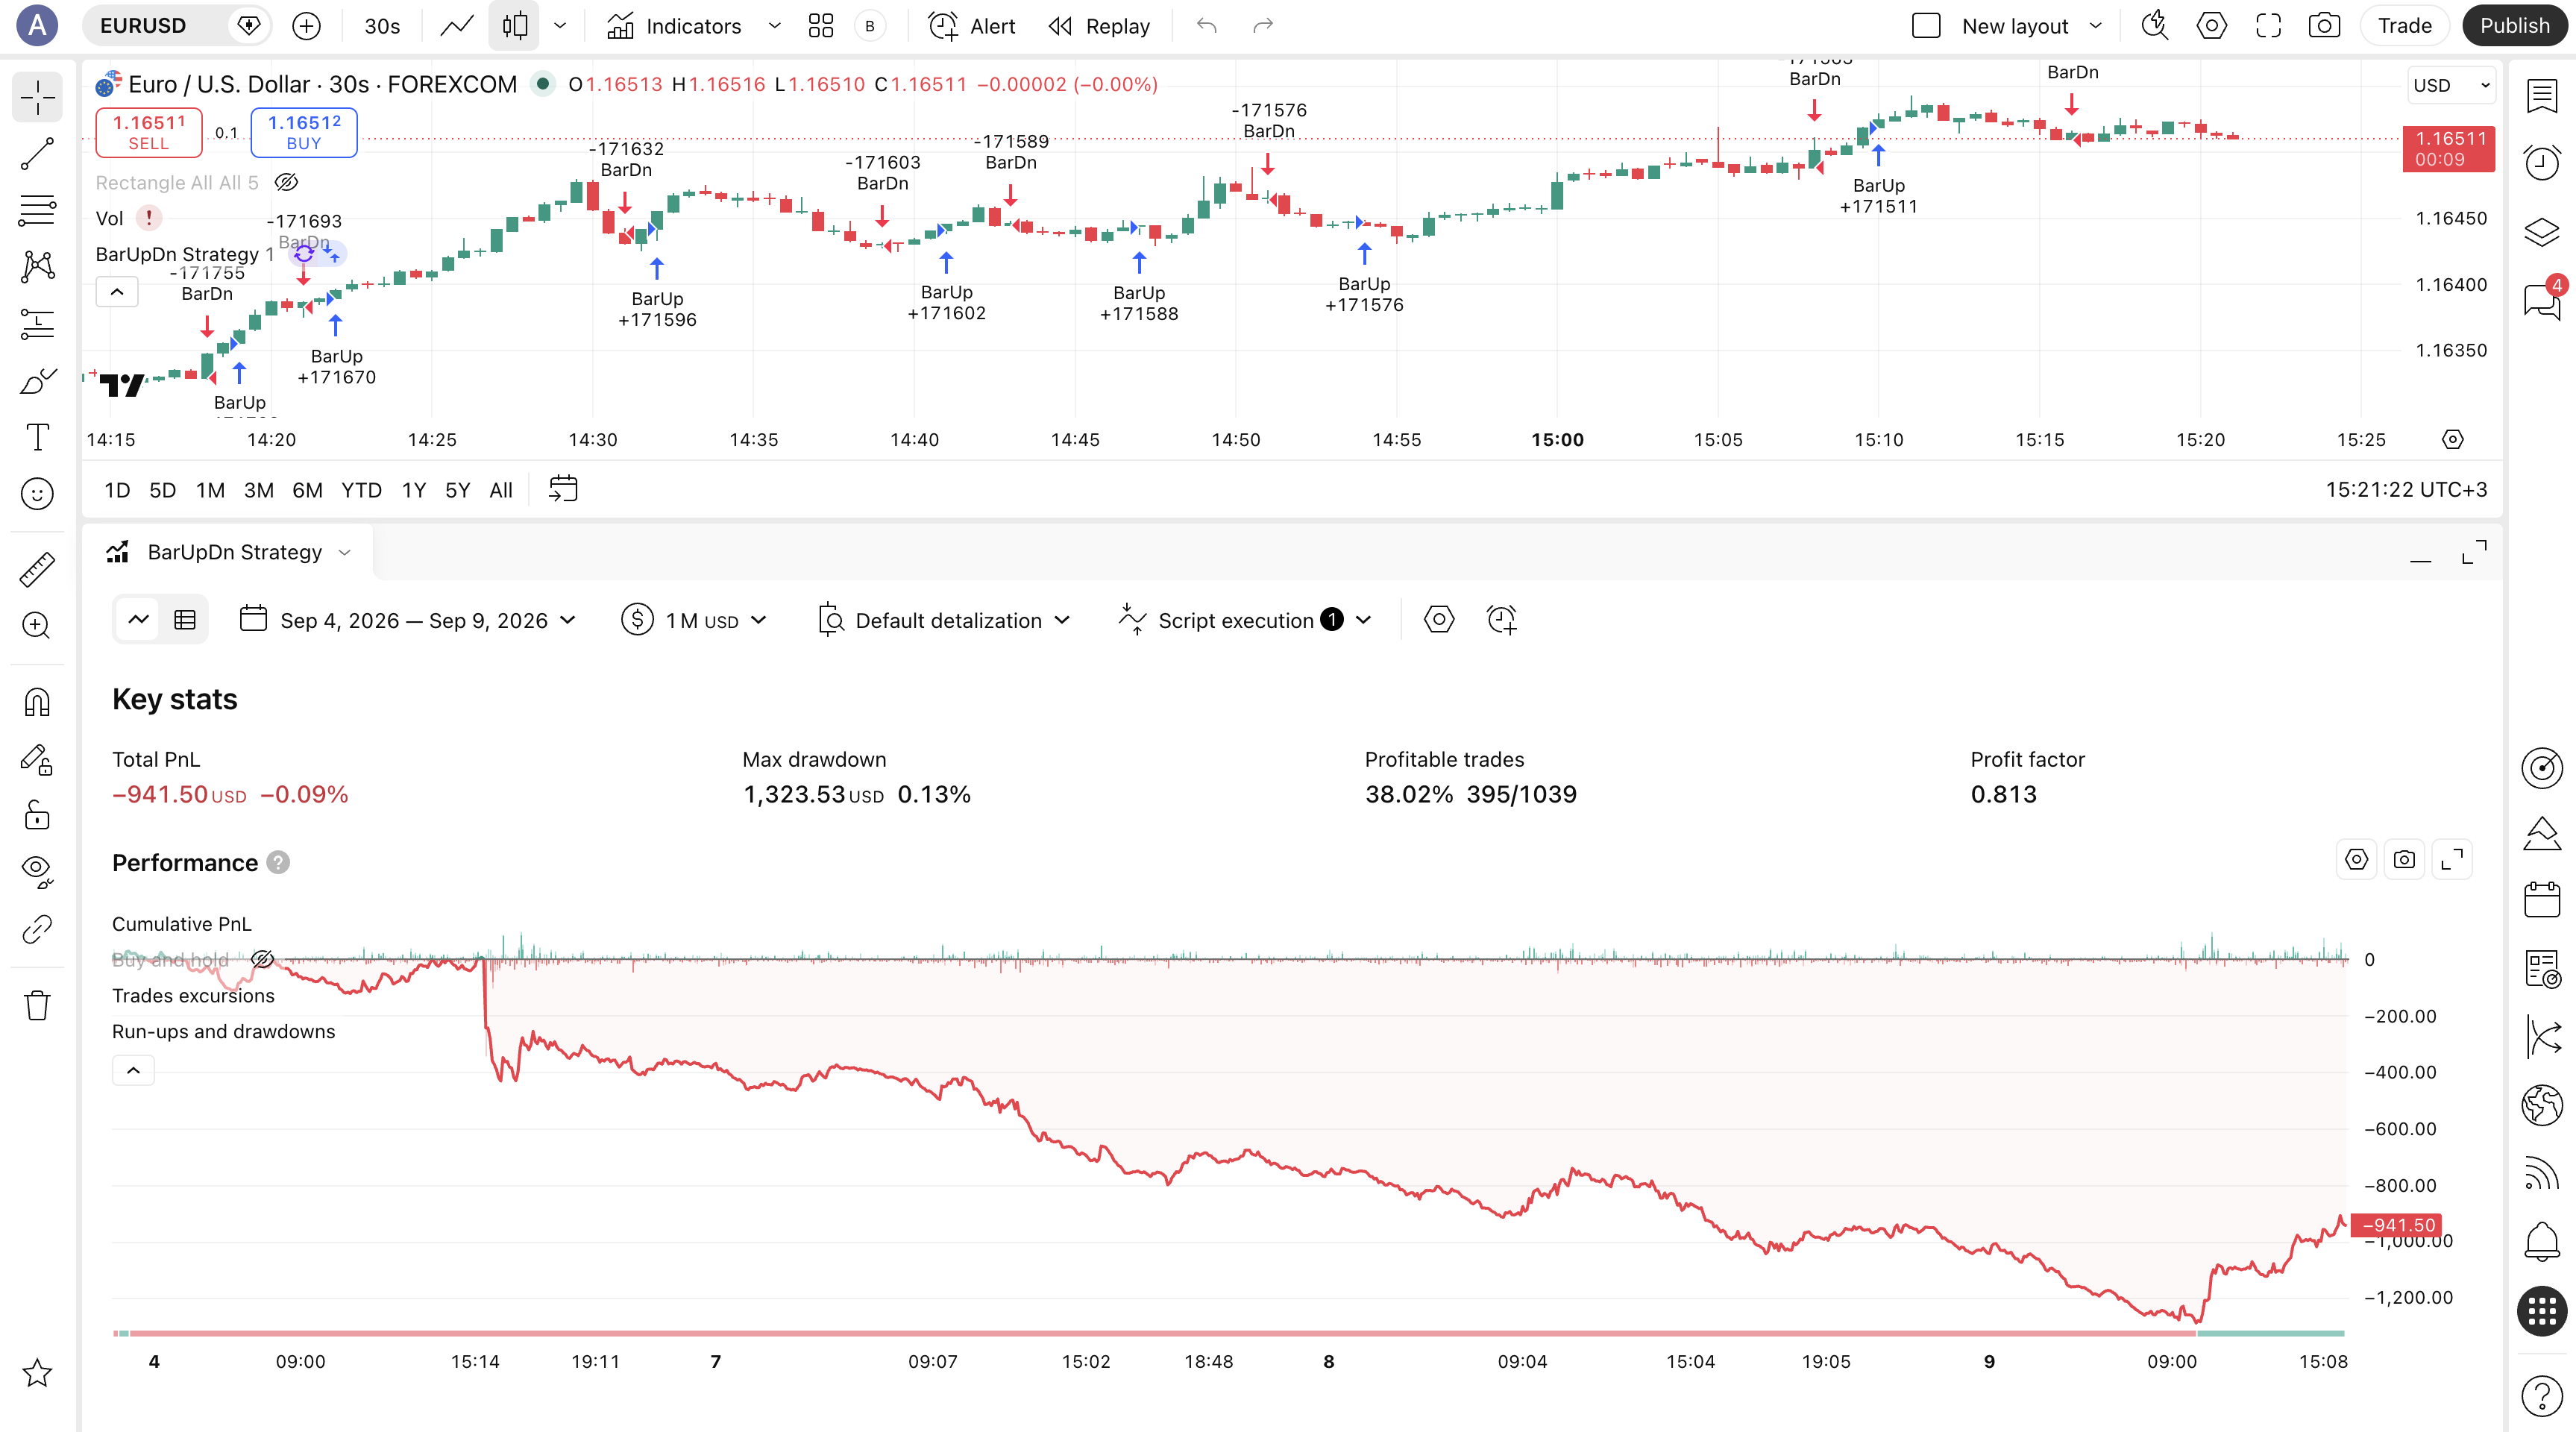
When you hover over the chart, detailed information appears:
- Trade number and type
- Cumulative P&L
- Date and time
- Buy & hold (if Buy&hold is enabled)
Performance analysis
The "Performance analysis" section provides detailed information about strategy performance on a given symbol within given period of time. It includes 5 independent tabs:
- Breakdown: visualizes gross profit vs. gross loss per signal (or side), plus net result.
- Periodical: breaks down realized profit/loss by period, with favorable/adverse excursion details on hover.
- Benchmarking: a bar chart comparing strategy PnL against buy-and-hold PnL over time (daily/weekly/quarterly/yearly), making it easy to see periods of outperformance or underperformance.
- Margin usage: a line chart showing margin usage over time (%), with trade count and exact usage shown on hover for each point.
- Growth and decline: visualizes alternating run-up/drawdown periods over time and compare their max/average/current values side by side.
Trades analysis
The "Trades analysis" section provides detailed statistics about trade outcomes, and has 3 independent tabs:
- Distribution: a histogram of trade returns split into losing and winning buckets, with dashed markers for average loss and average profit, alongside a donut chart breaking total trades into winners, losers and breakevens by count and share; topped by summary metrics — expected payoff, outliers PnL, largest profit and largest loss.
- Streaks: a bar chart showing consecutive streaks of winning and losing trades over time, viewable by trade count or by amount.
- Time patterns: a stacked bar chart showing winning and losing trades grouped by entry time, viewable by hour, day of week or month; topped by summary metrics — best hour, best day and best month for entries with their win rates, plus average trade duration in bars.
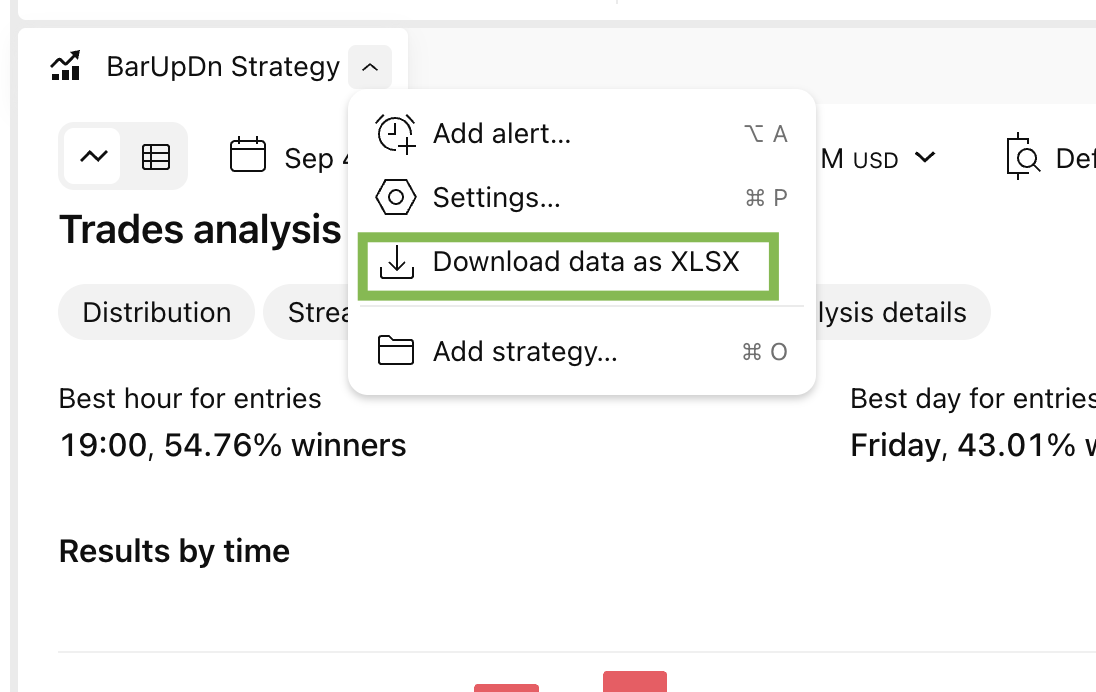
Additional trade analysis metrics can be exported through strategy menu:
List of trades
The "List of trades" tab shows a complete record of all executed trades with detailed parameters in table format:
- Trade #
- Type
- Date/Time
- Signal
- Price
- Position size
- Net P&L
- Run-up
- Drawdown
- Cumulative P&L
Related strategy settings
A few strategy-properties options worth knowing when reading the report:
- Deep backtesting: an option that unlocks a symbol's full price history for a fuller performance view, available on premium plans.
- Bar detalization: an option that feeds higher-resolution data into intrabar order execution for more precise fills.
- Limit order execution: a selector that replaces the old "verify price for limit orders" toggle, with a choice between "Requested price" and "Requested price and 1 tick beyond".
- Script execution mode: a selector controlling when the script's logic runs, affecting how realistically trades are simulated.
- Order execution delay: a value that postpones order execution by a set interval to mimic real-world latency.
Also read: