Options Volume: visualize trading activity
Options volume is a tool that helps you see where options trading activity is concentrated — across strikes, expirations, and option types — so you can quickly spot the contracts the market is most focused on.
Suppose you want to understand how traders are positioned in Apple ahead of the nearest expirations. Are they buying calls above the current price, or hedging with puts below it? Which strikes attract the most interest, and how does activity change as you move further out in time?
Options volume answers these questions at a glance. It aggregates the number of contracts traded and presents it in three complementary views: a heatmap, a breakdown by expiration, and a breakdown by strike.
Options volume view
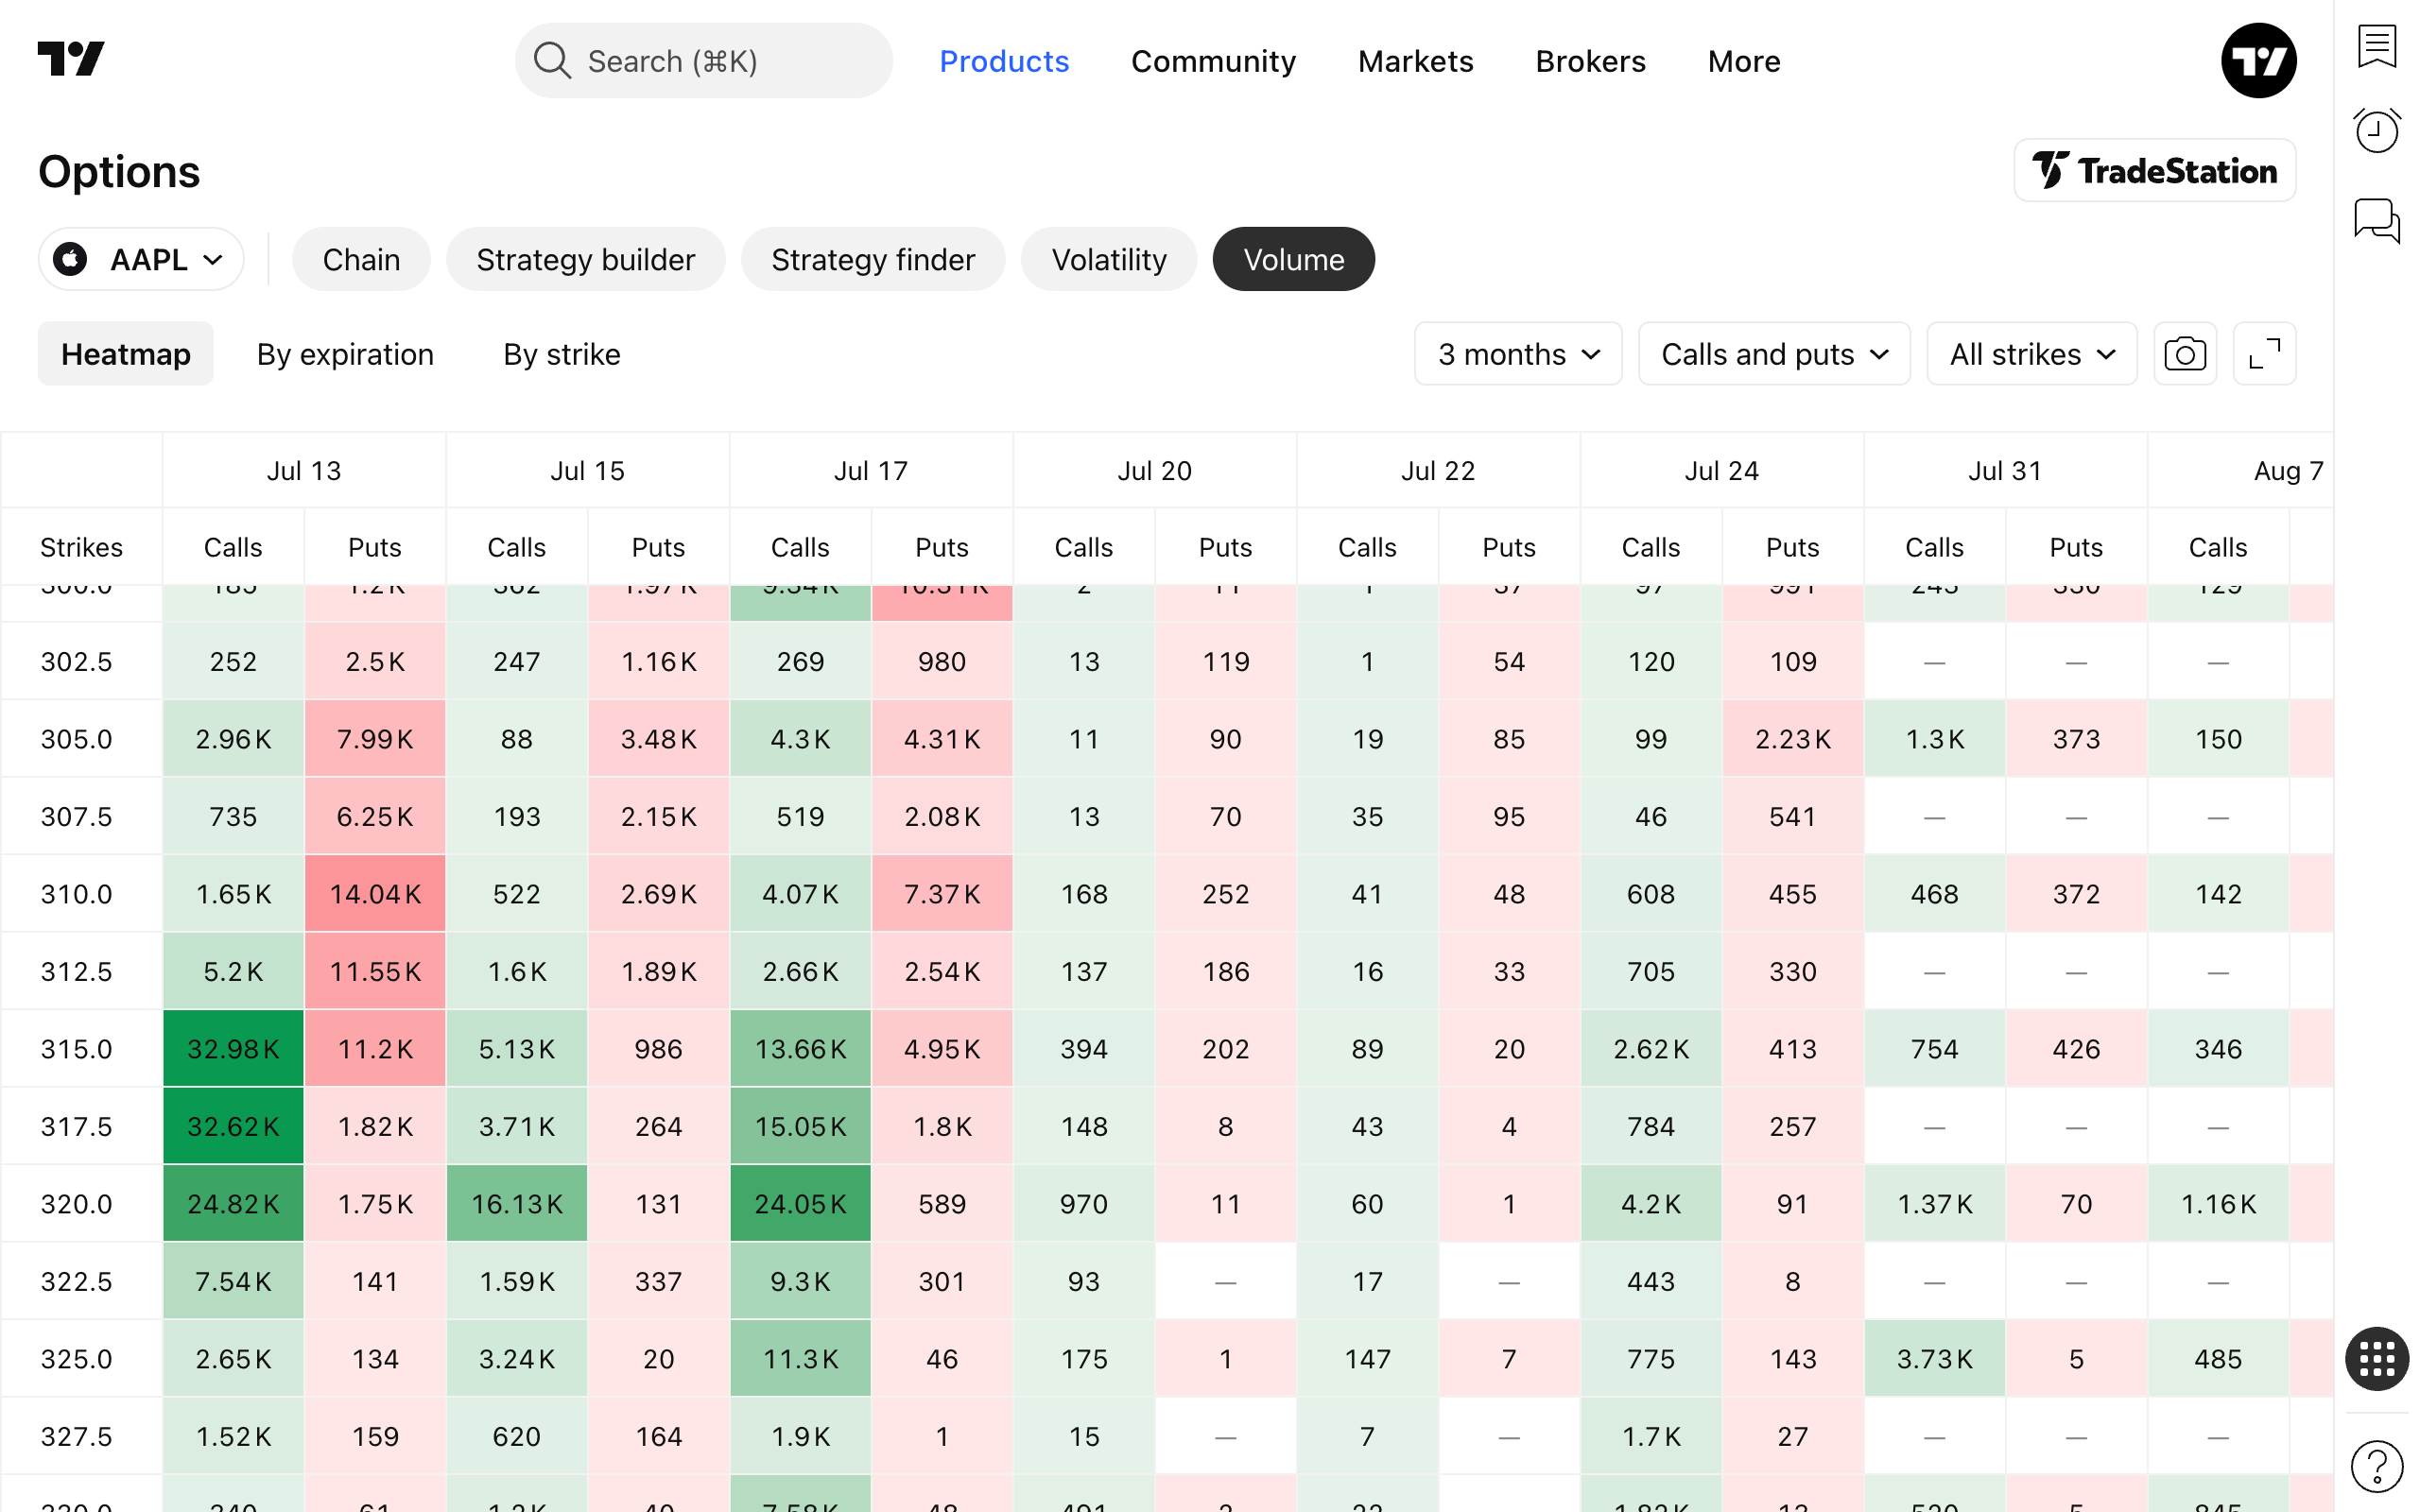
Once you open the Volume tab, the Heatmap view is displayed by default. It shows a table where rows are strikes, columns are expiration dates, and each cell contains the volume of calls or puts for that strike and expiration.
Cells are color-coded by intensity: call volume is shaded in green and put volume in red — the darker the color, the higher the volume relative to other cells. This makes unusual concentrations of activity immediately visible. For example, a deep-green cell at a strike above the current price may indicate strong demand for upside calls at a specific expiration.
You can switch between three views at any time:
- Heatmap — a strike-by-expiration table with color-coded volume, useful for spotting exactly which contracts are the most active.
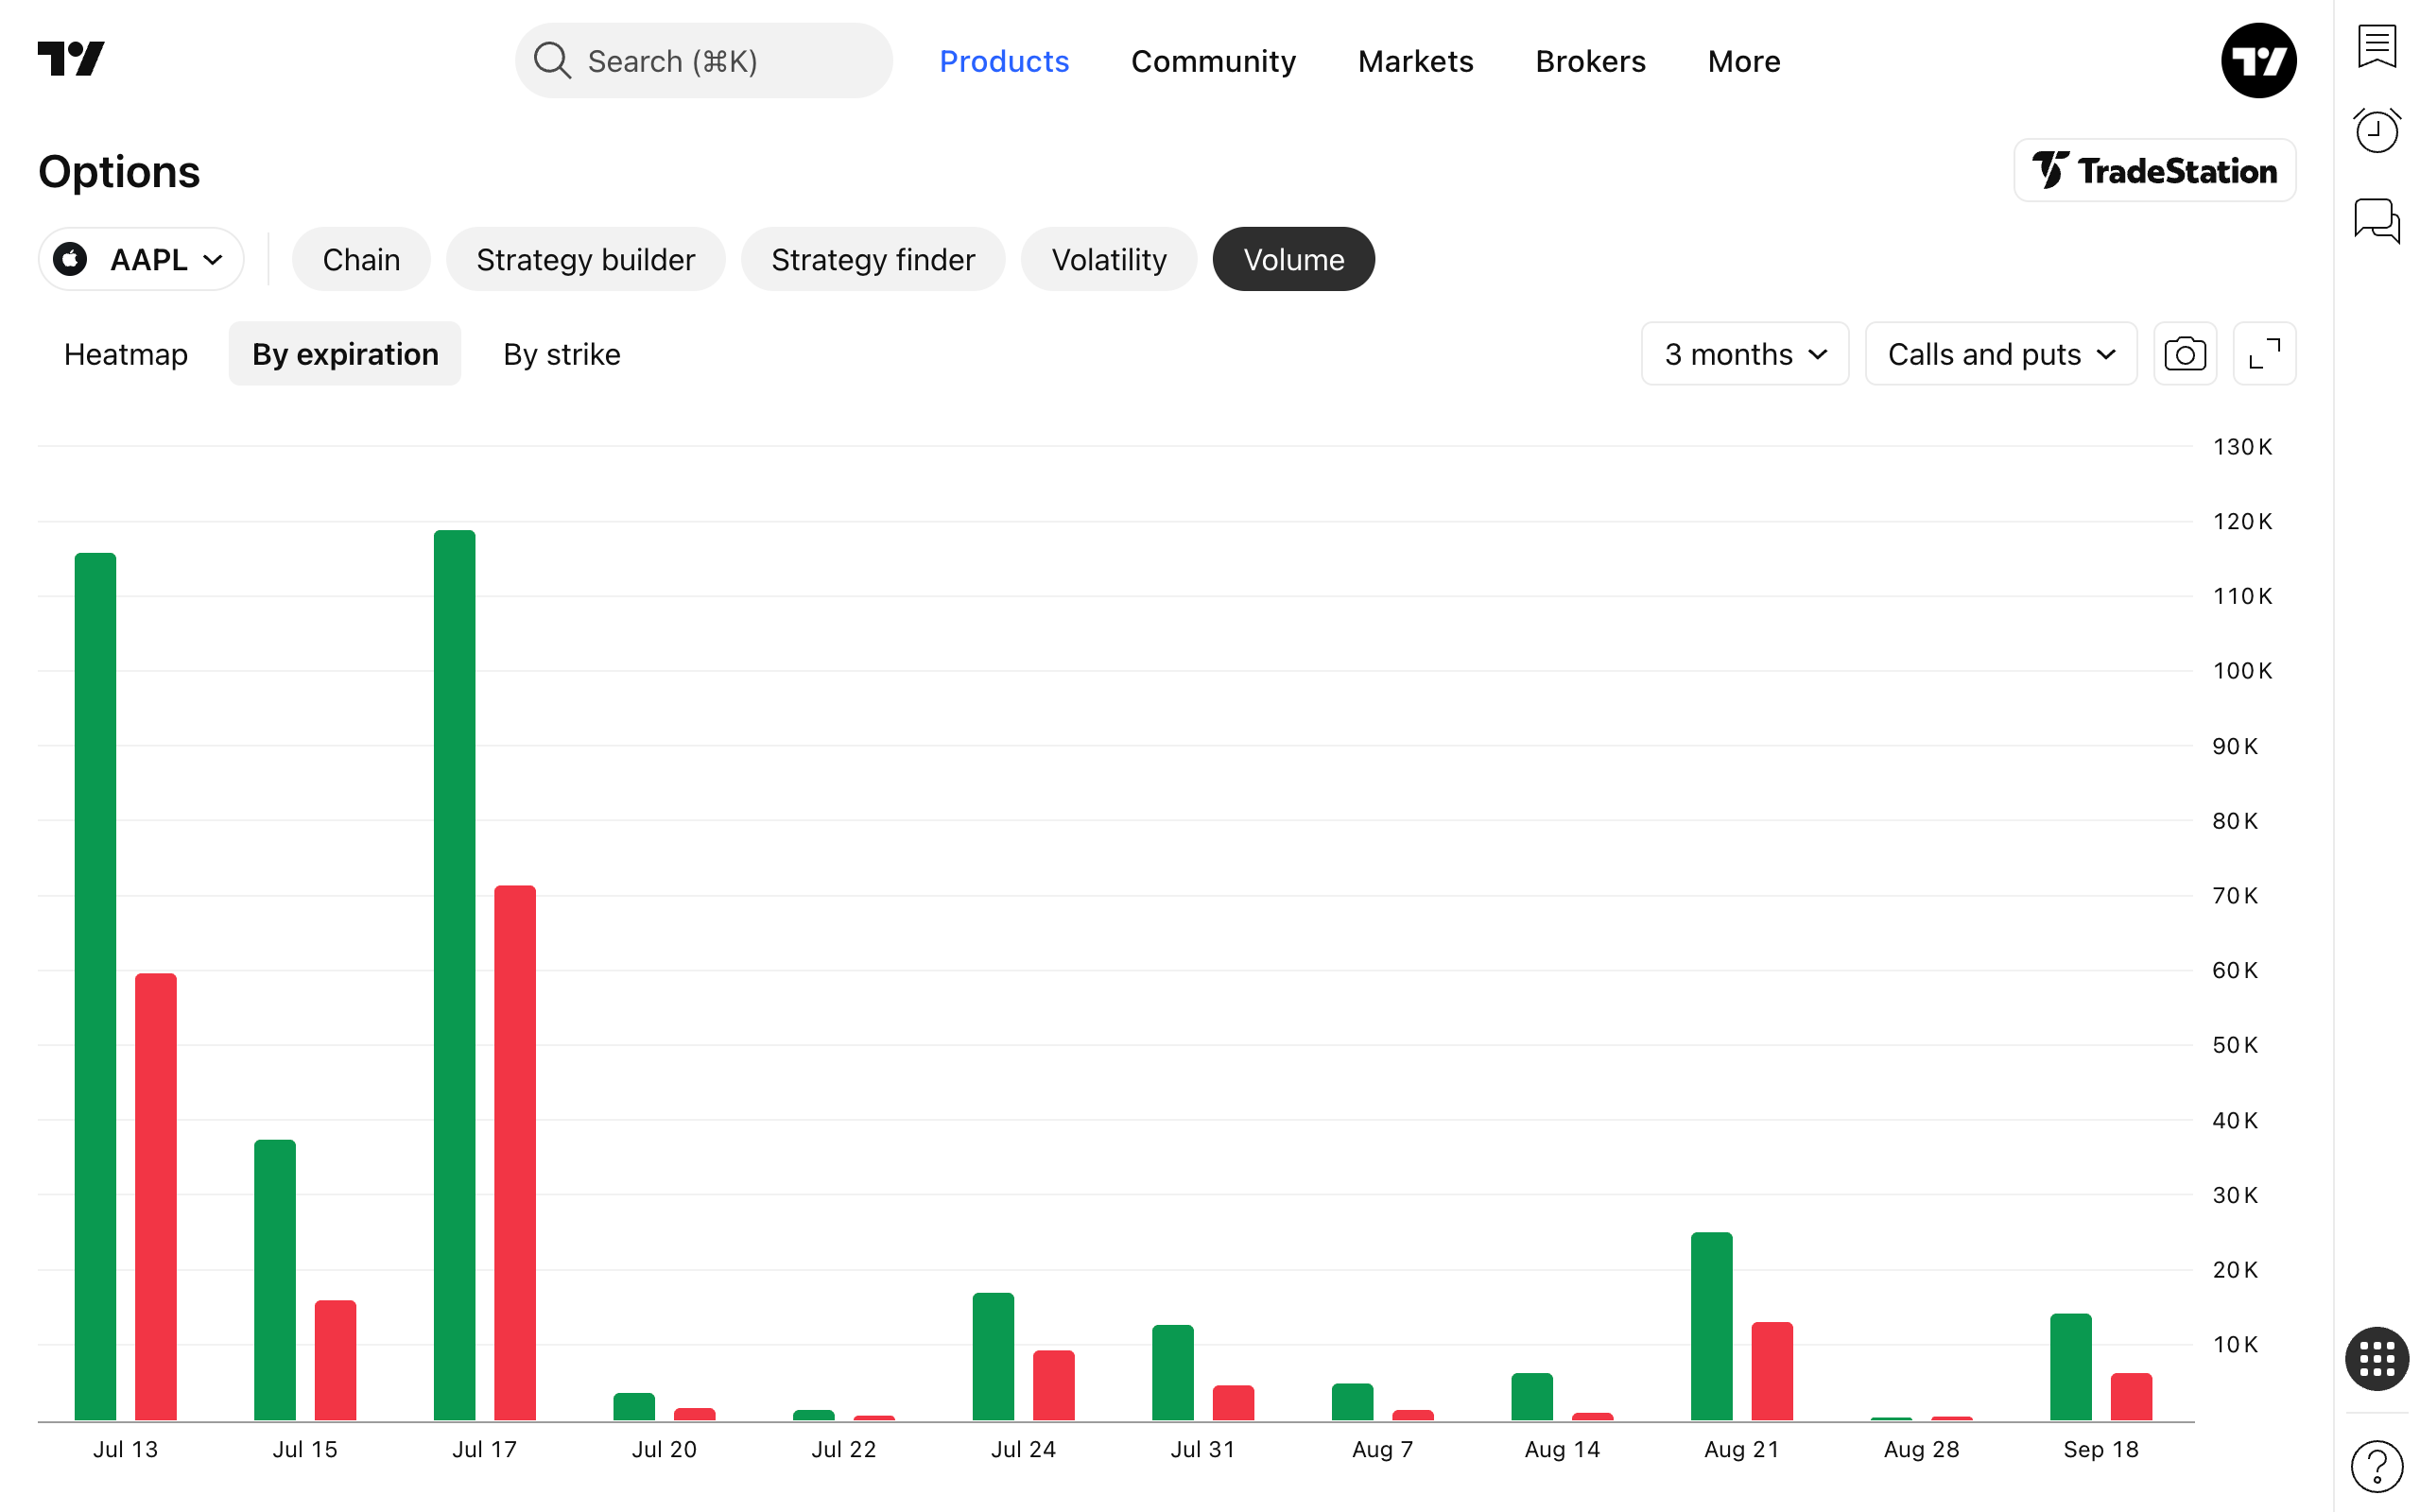
- By expiration — a bar chart that aggregates volume for each expiration date, with calls shown in green and puts in red. Use it to see which expirations concentrate the most activity and how the call/put balance shifts over time.
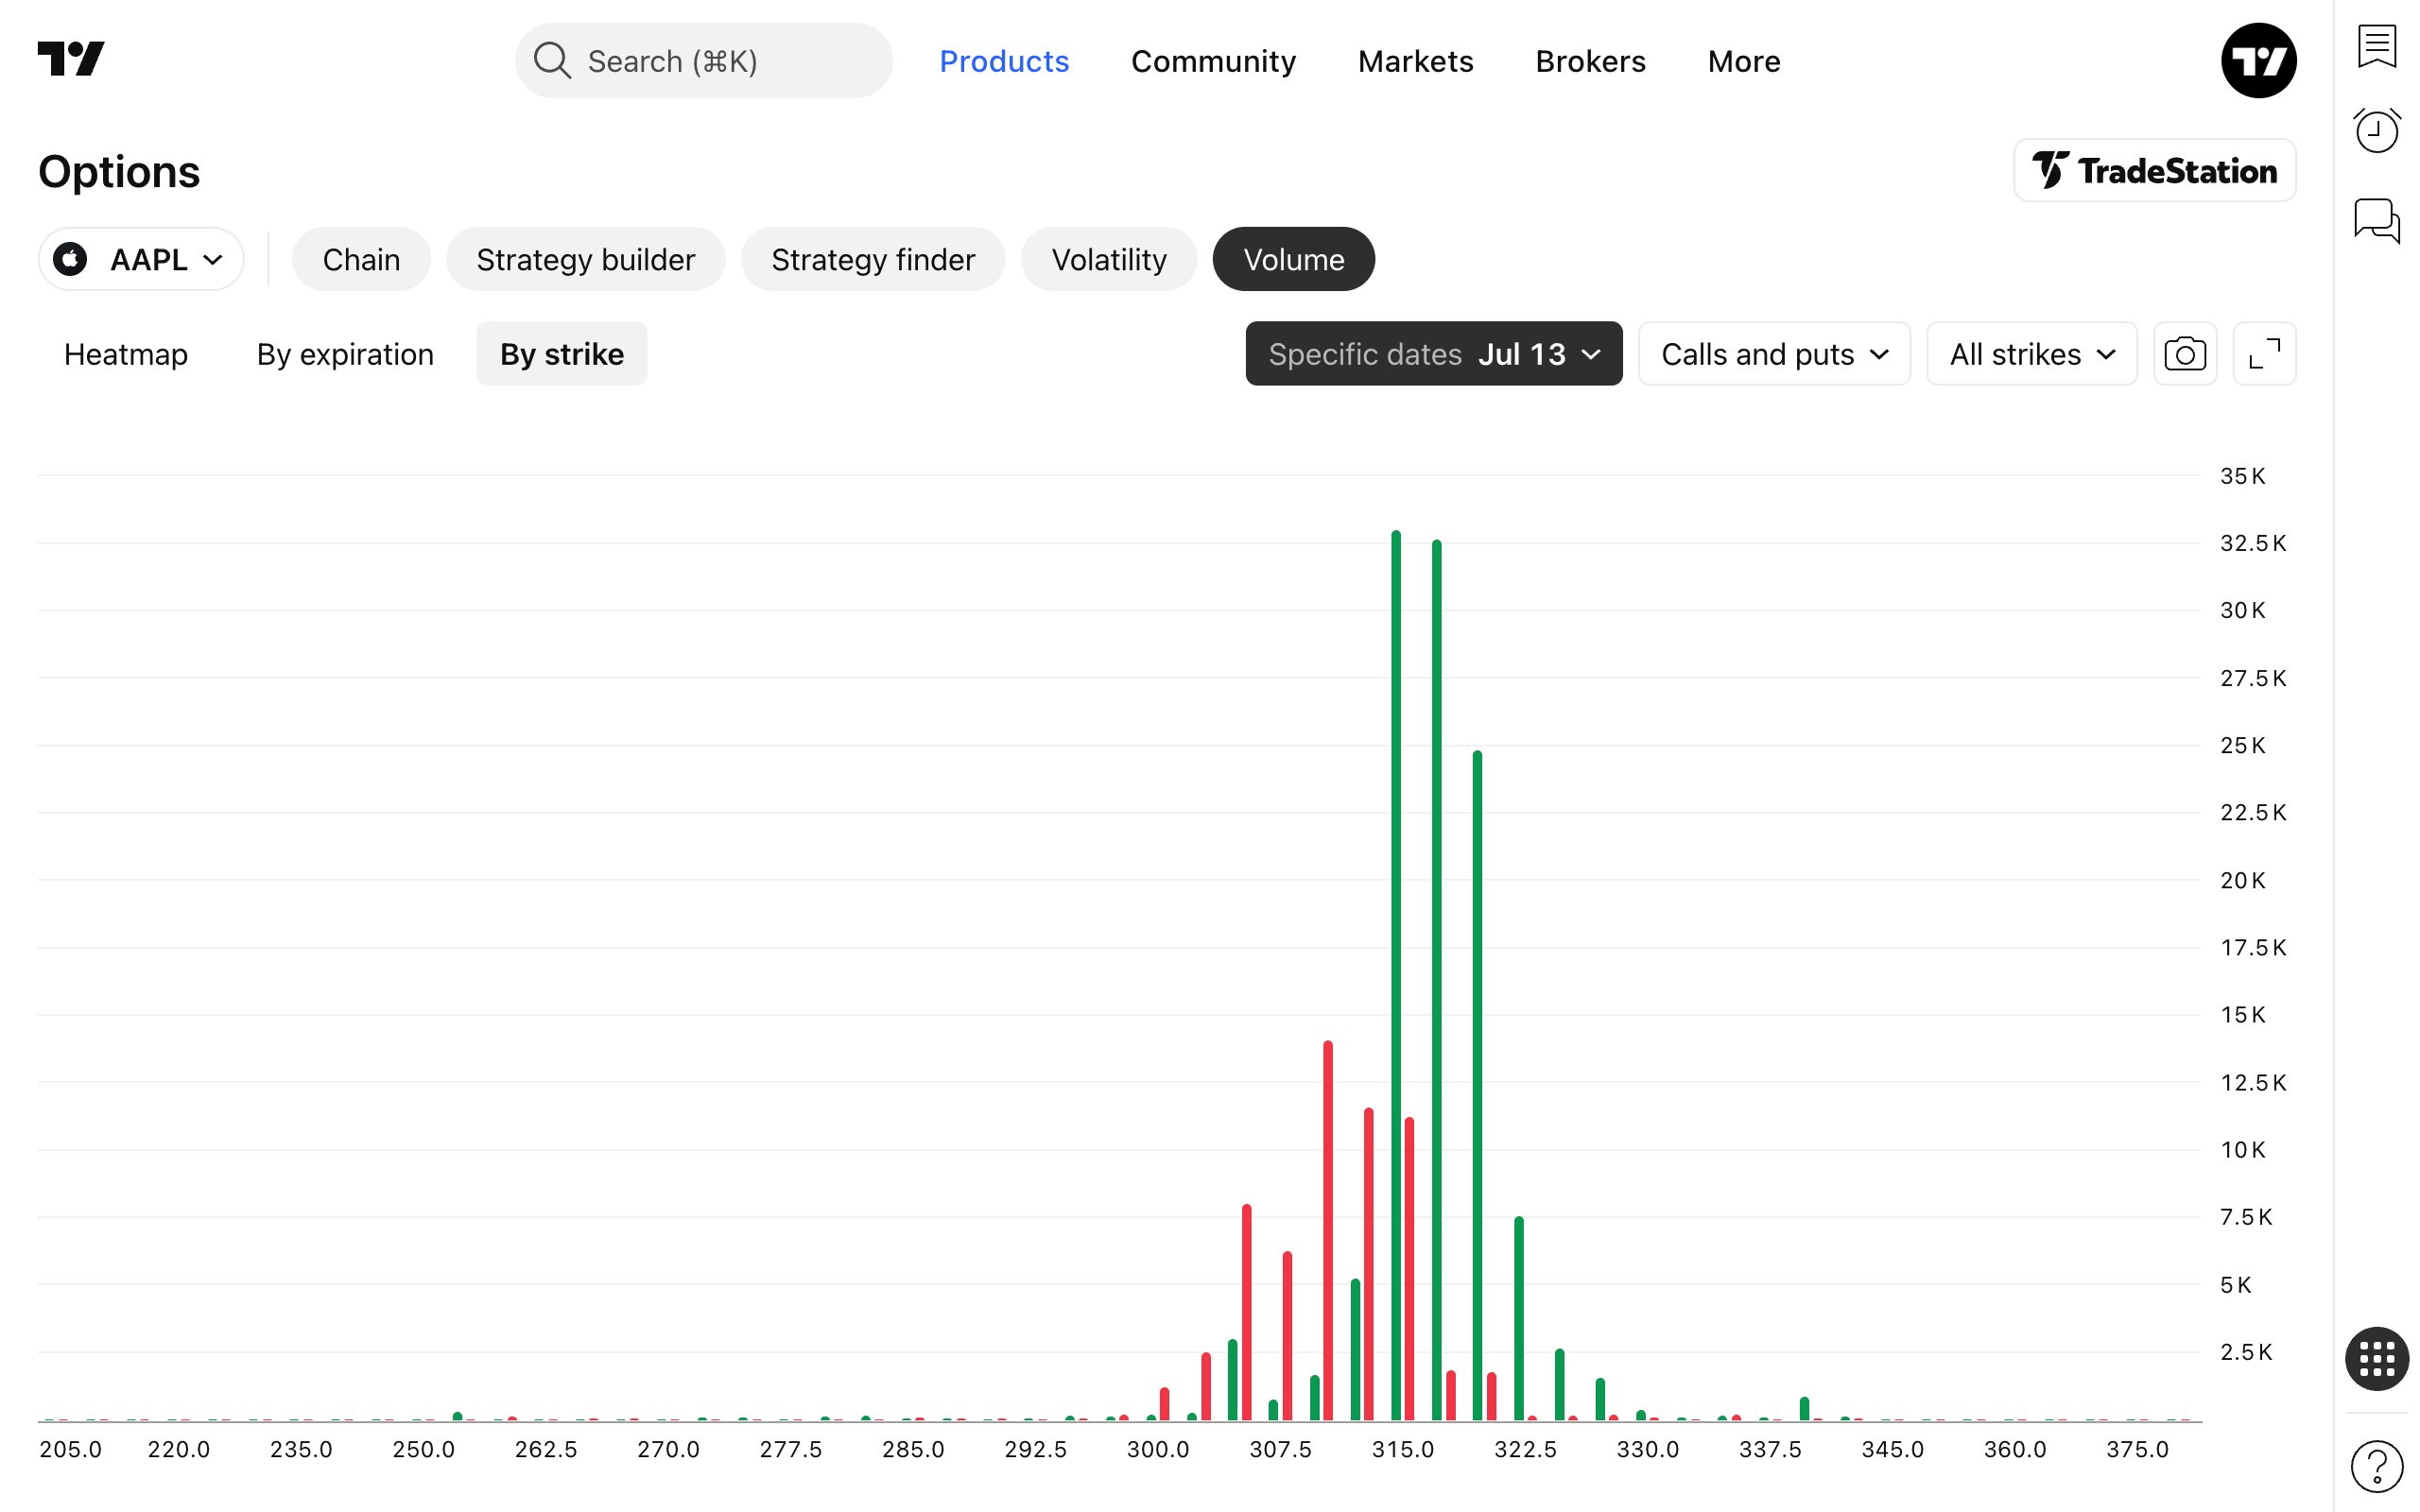
- By strike — a bar chart that aggregates volume for each strike across the selected expirations, useful for identifying key price levels where traders are positioned.
Settings and filters
You can adjust what data is displayed using the selectors above the table.
The interval filter defines the range of expirations included in the view. Choose between 1 week, 1 month, 3 months, 6 months, 1 year, or All to focus on near-term activity or take in the full expiration curve.
The display filter controls which side of the market is shown:
- Calls — call volume only
- Puts — put volume only
- Calls and puts — calls and puts side by side for each expiration
- Sum of calls and puts — total combined volume per strike and expiration
The strikes filter narrows the range of strikes. Select Around current price (±10 strikes), (±20 strikes), or (±30 strikes) to focus on contracts near the money, or choose All strikes to see the entire chain.
You can apply the filters in any combination — for example, put volume only, within one month, at strikes near the current price.
Also read: