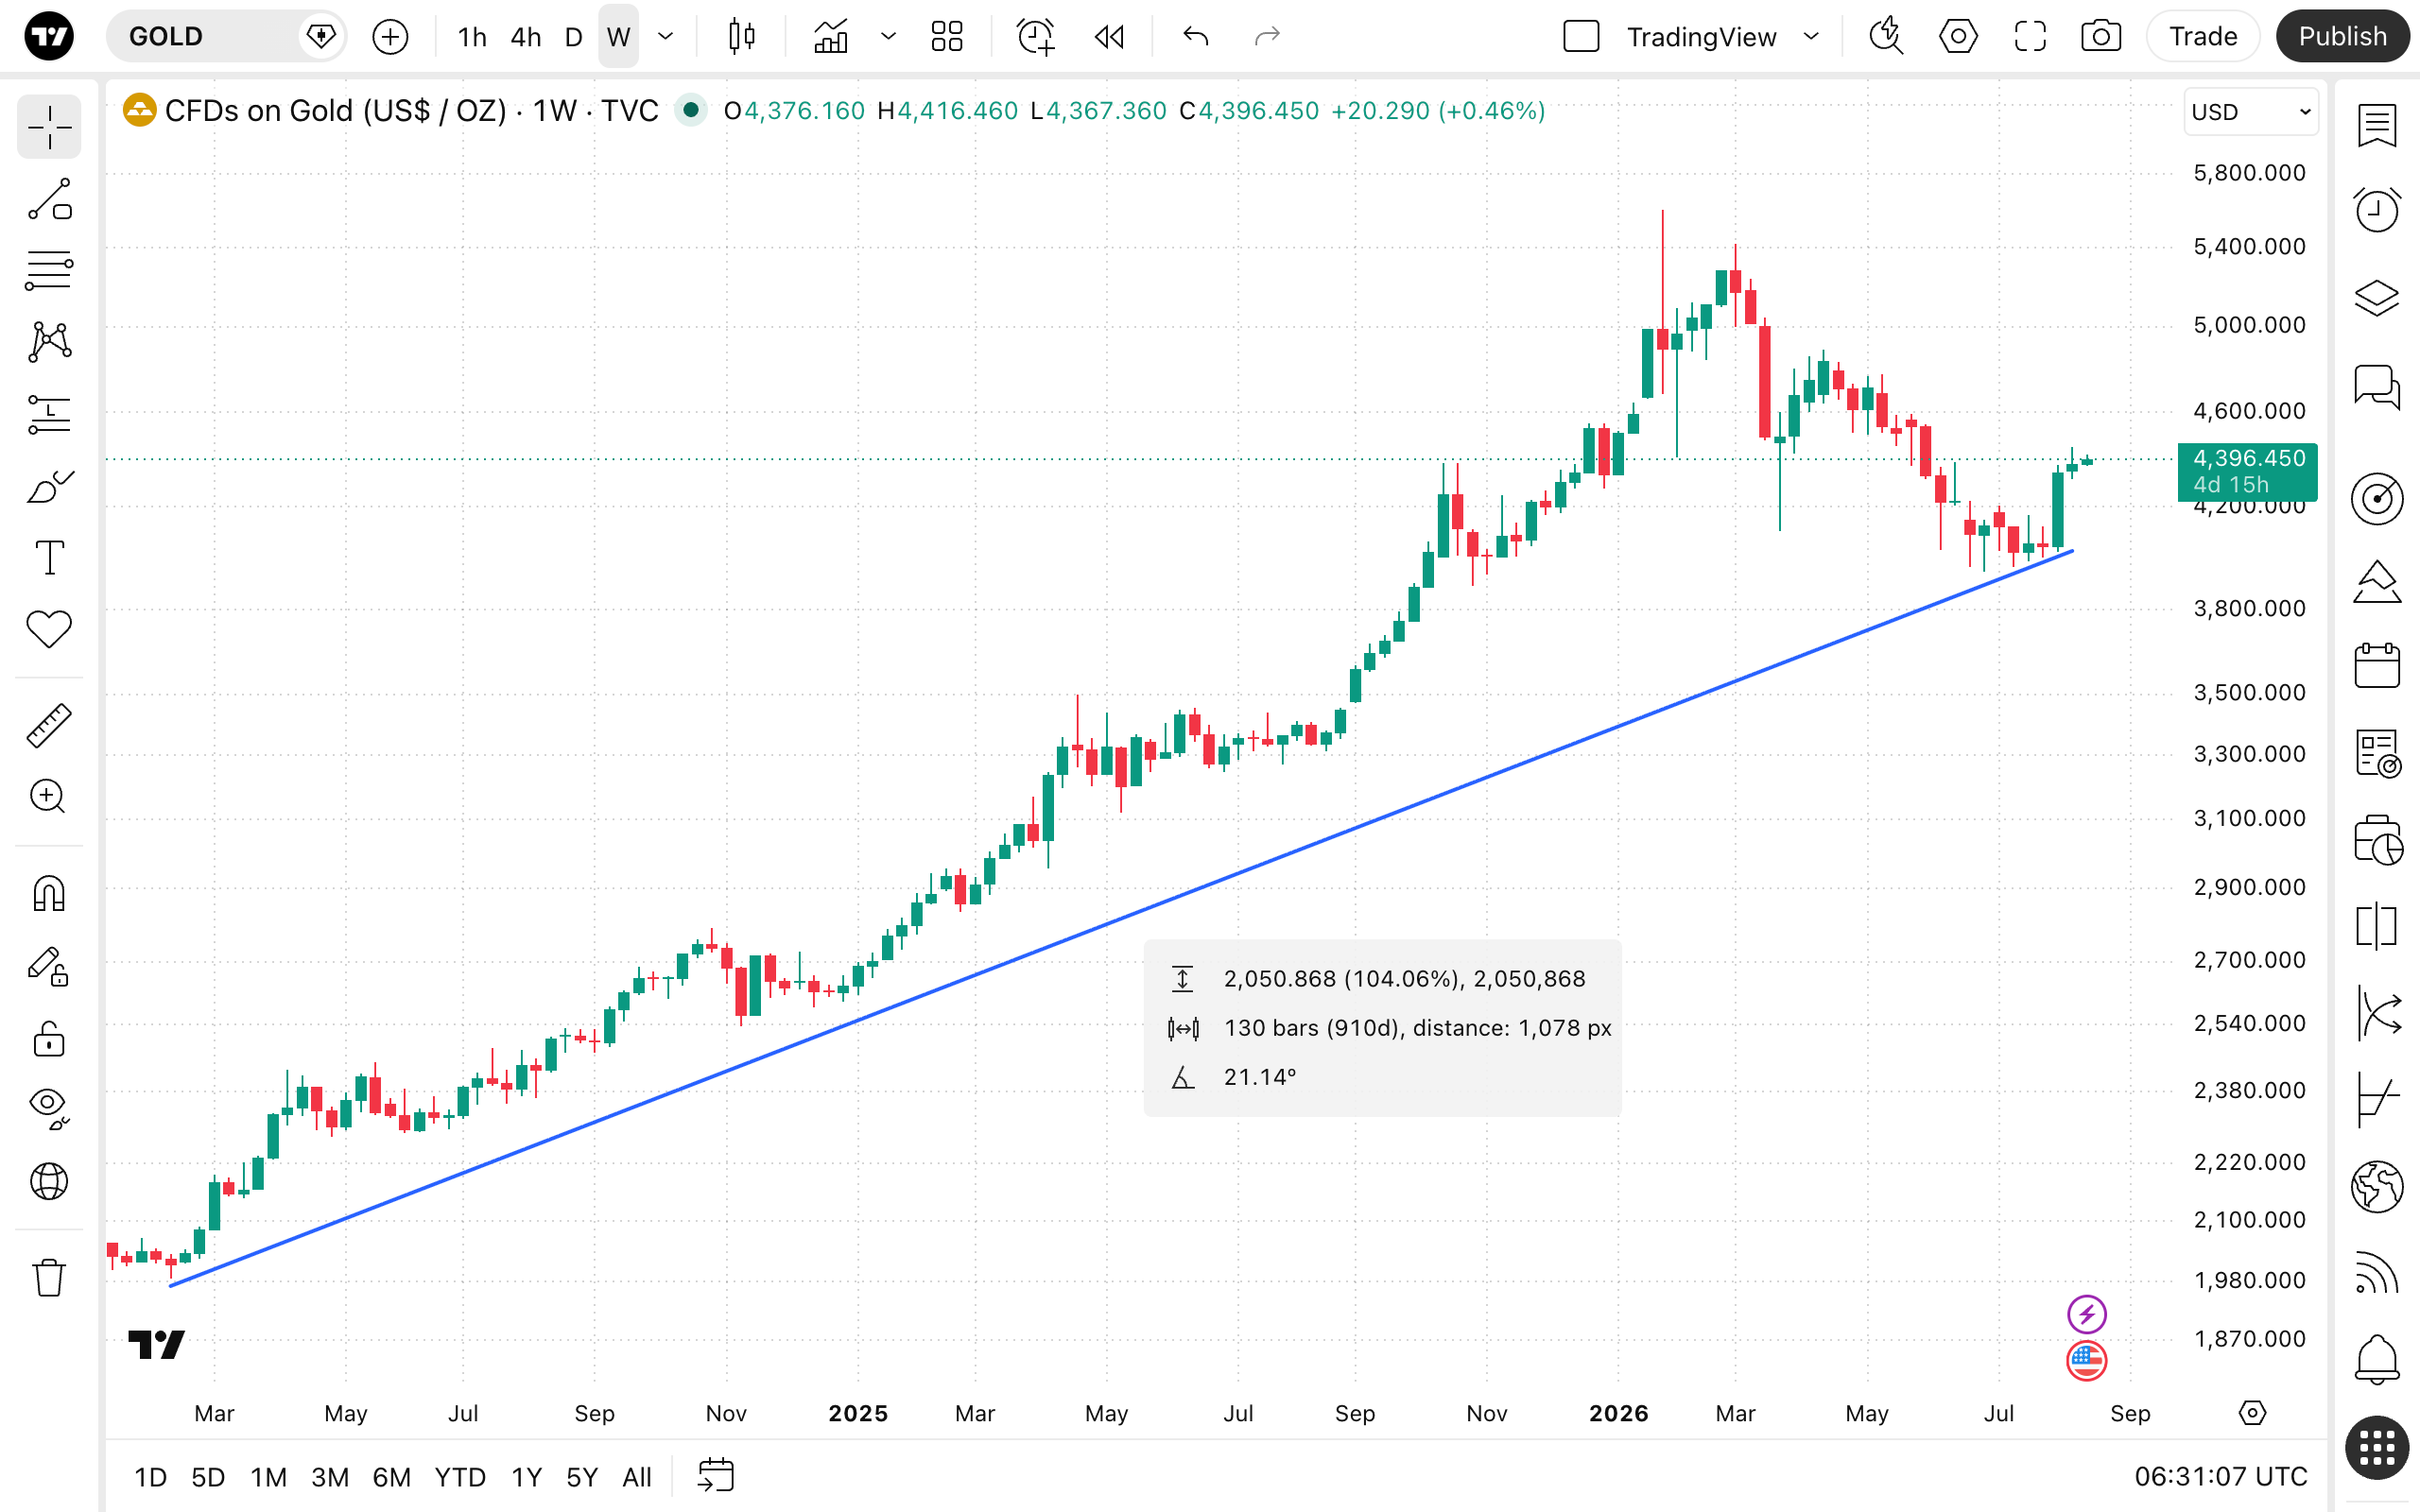
Info line drawing tool
Application
The Info line drawing tool functions similarly to a standard trendline, but with the added benefit of generating an attached informational window. When drawn between two points on a chart, this window automatically calculates and displays valuable data, such as the absolute price change, percentage change, distance in bars and time, and the angle of the line. This makes it an excellent instrument for quickly measuring an asset's performance over a specific period while simultaneously marking a trend or support/resistance levels.
To draw an Info line, select the tool from the left toolbar, click on the chart to set the starting point, drag your cursor, and click again to place the second point.
Style
In the Style properties dialog, it is possible to change the visual appearance of the Info line and its corresponding data box.
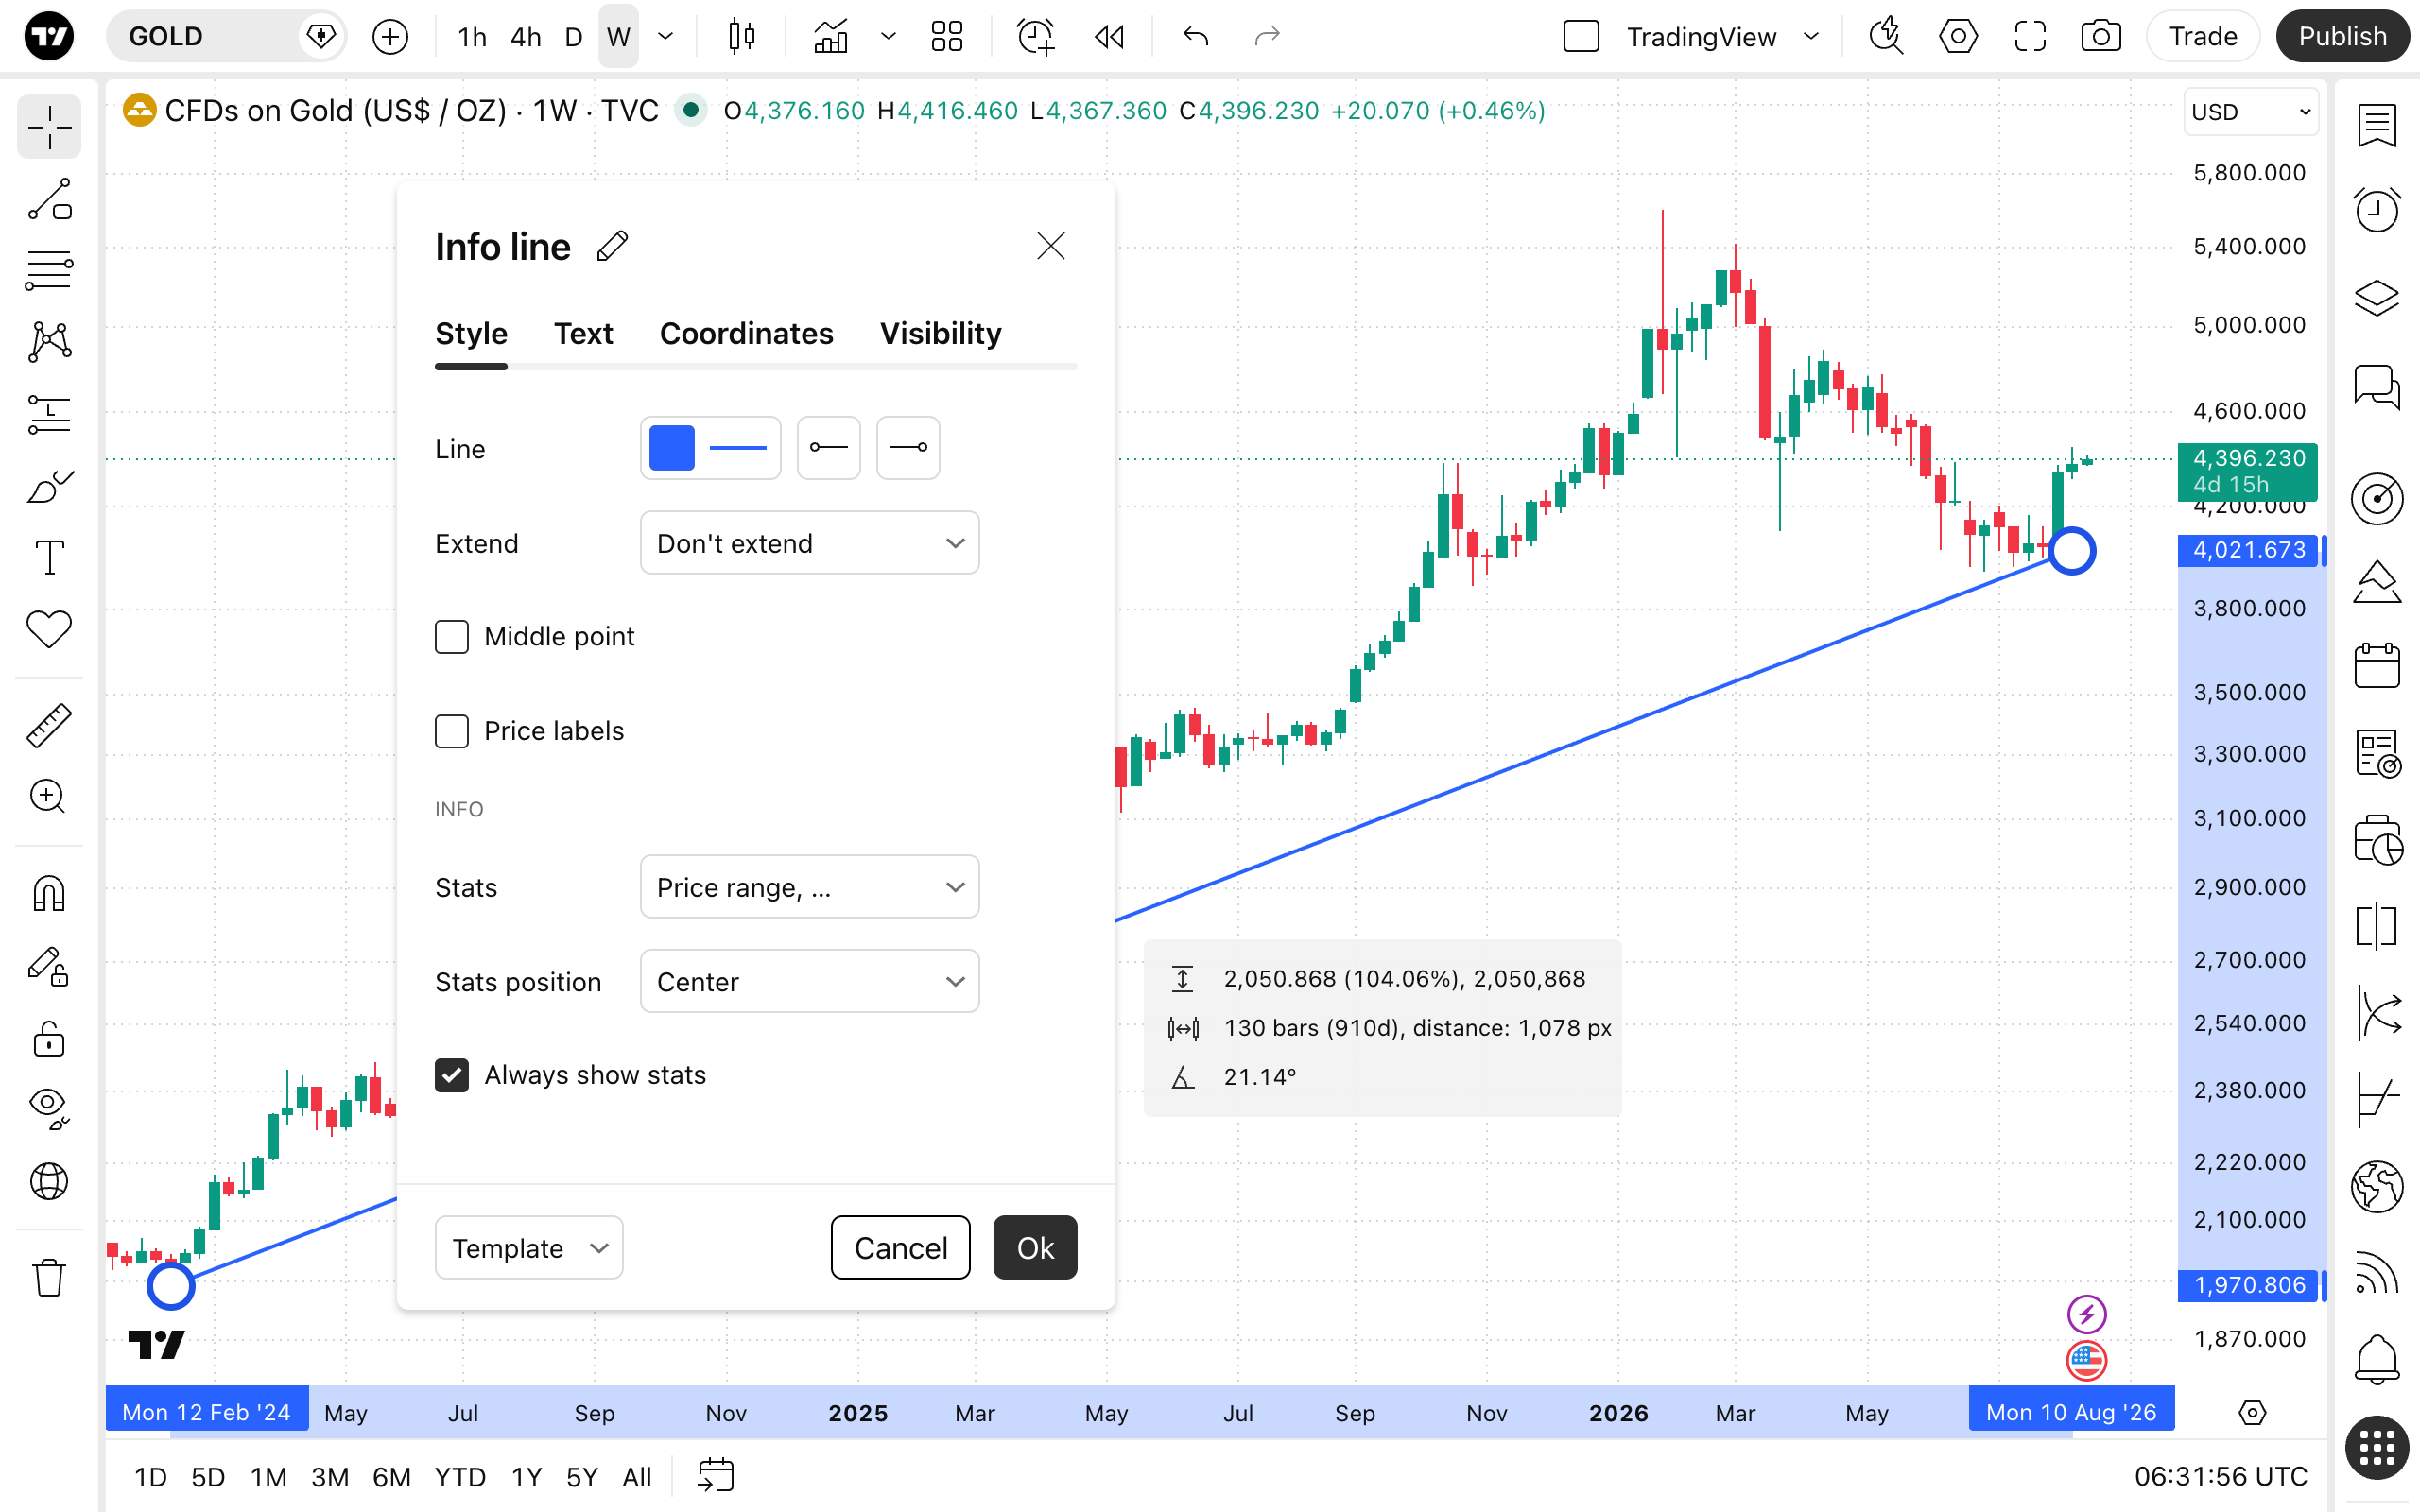
- Line: Sets the color, opacity, thickness, and style (solid, dashed, or dotted) of the drawn line. You can also add arrows to the left or right ends of the line.
- Extend: Toggles whether the line extends indefinitely to the left or right of the selected points.
- Stats: Toggles the visibility of the informational data box attached to the line.
- Stats position: Keeps the statistics box visible on the chart at all times, even when the drawing tool is not actively selected.
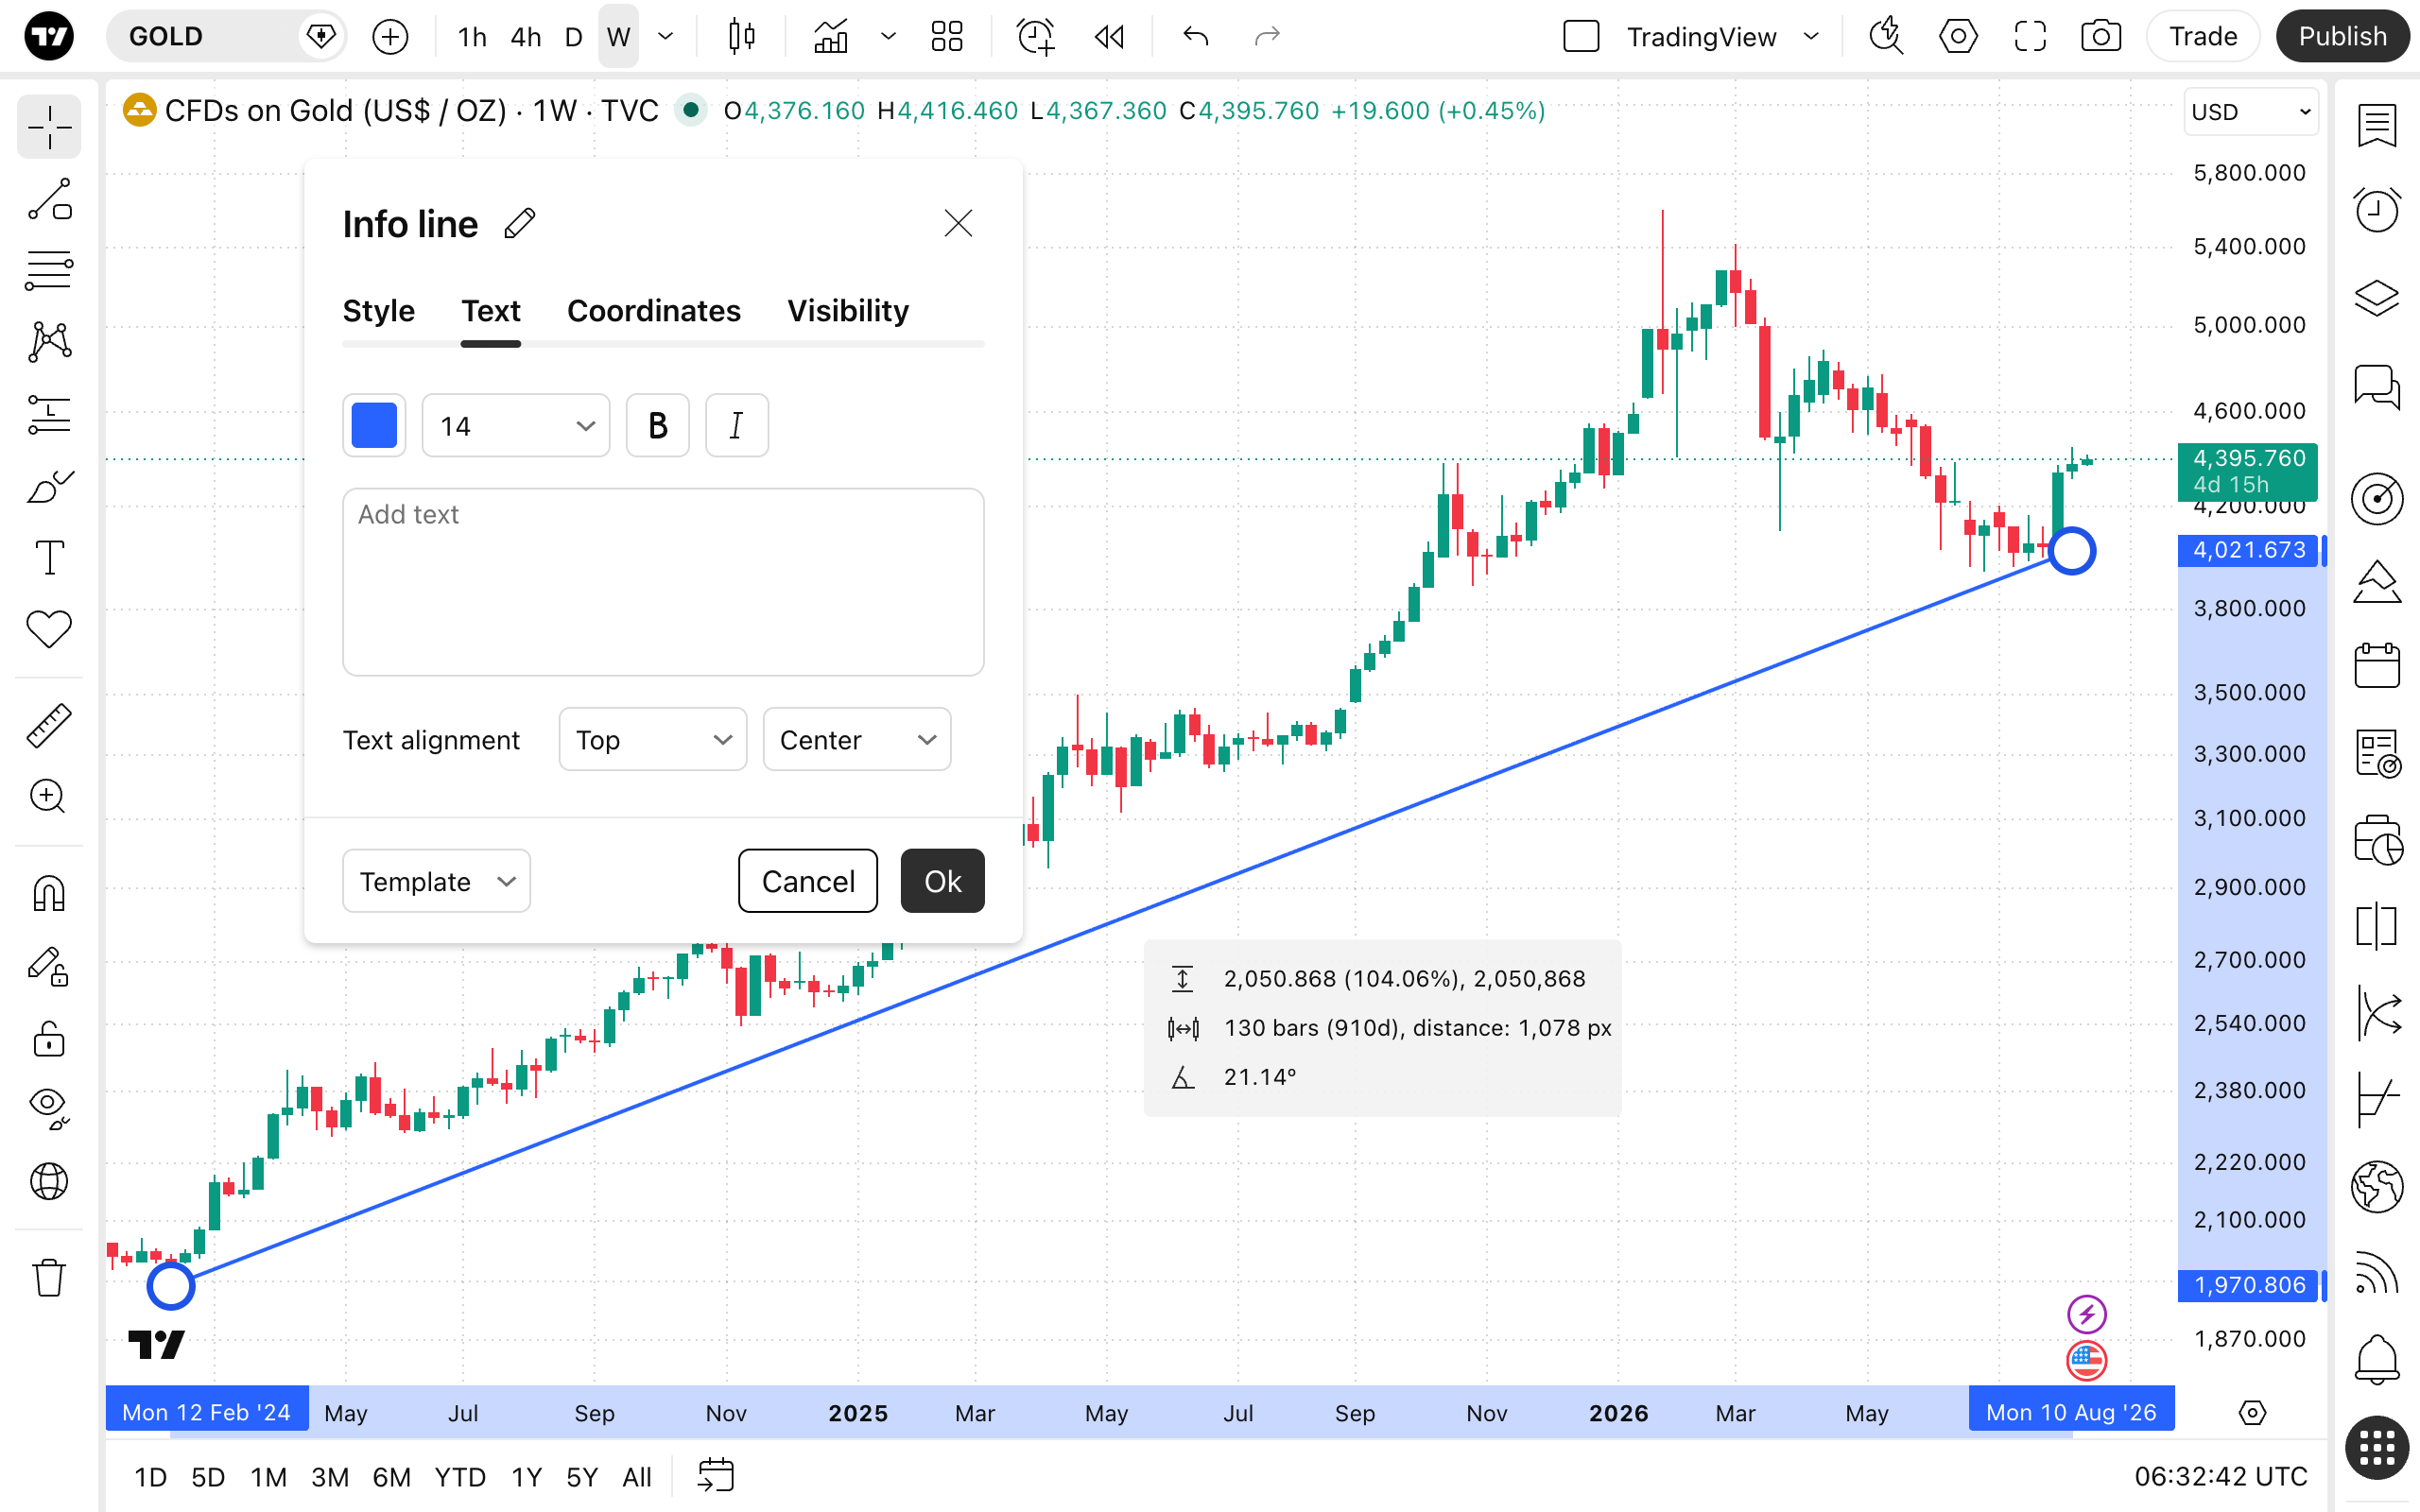
Text
Allows you to change the text color, opacity, and font size within the data box. You can also choose to bold and/or italicize the text to make the data stand out.
Coordinates
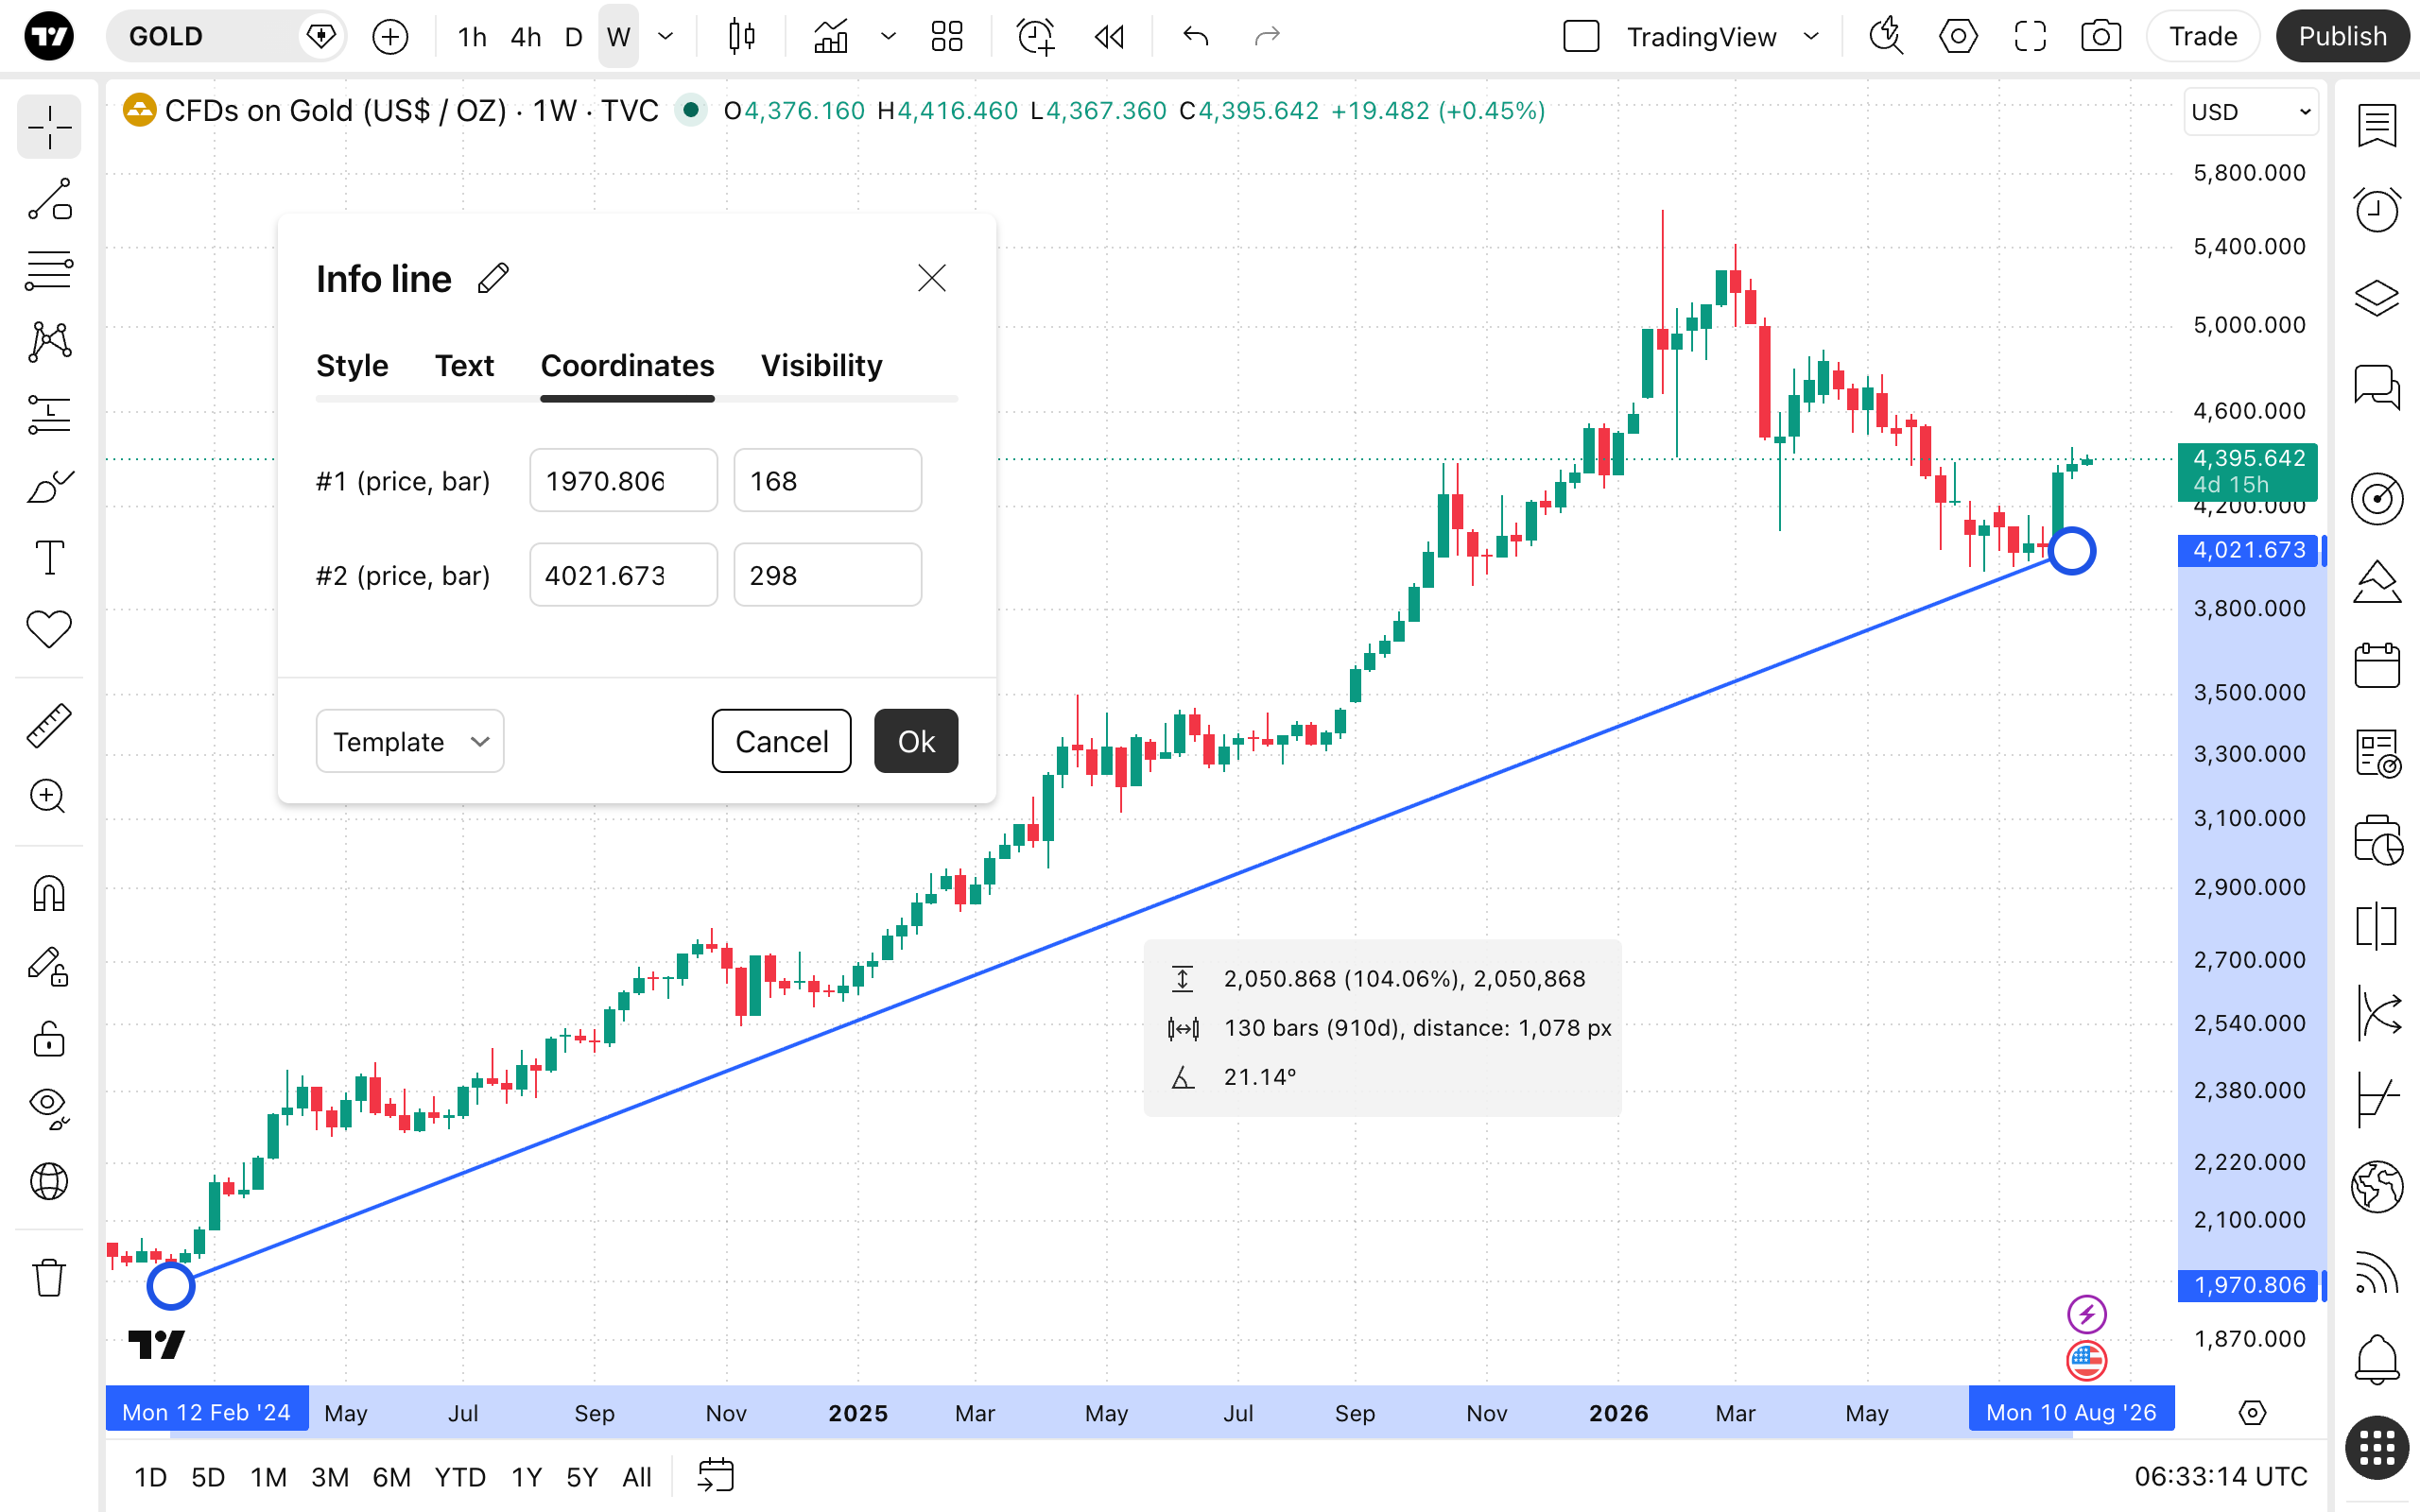
In the Coordinates properties dialog, you can set precisely the position of the Info line's endpoints on the price scale (by setting the price) and the time axis (by setting the bar number):
- Price 1: Allows for the precise placement of the line's first point (Price 1) using a specific bar number and price.
- Price 2: Allows for the precise placement of the line's second point (Price 2) using a specific bar number and price.
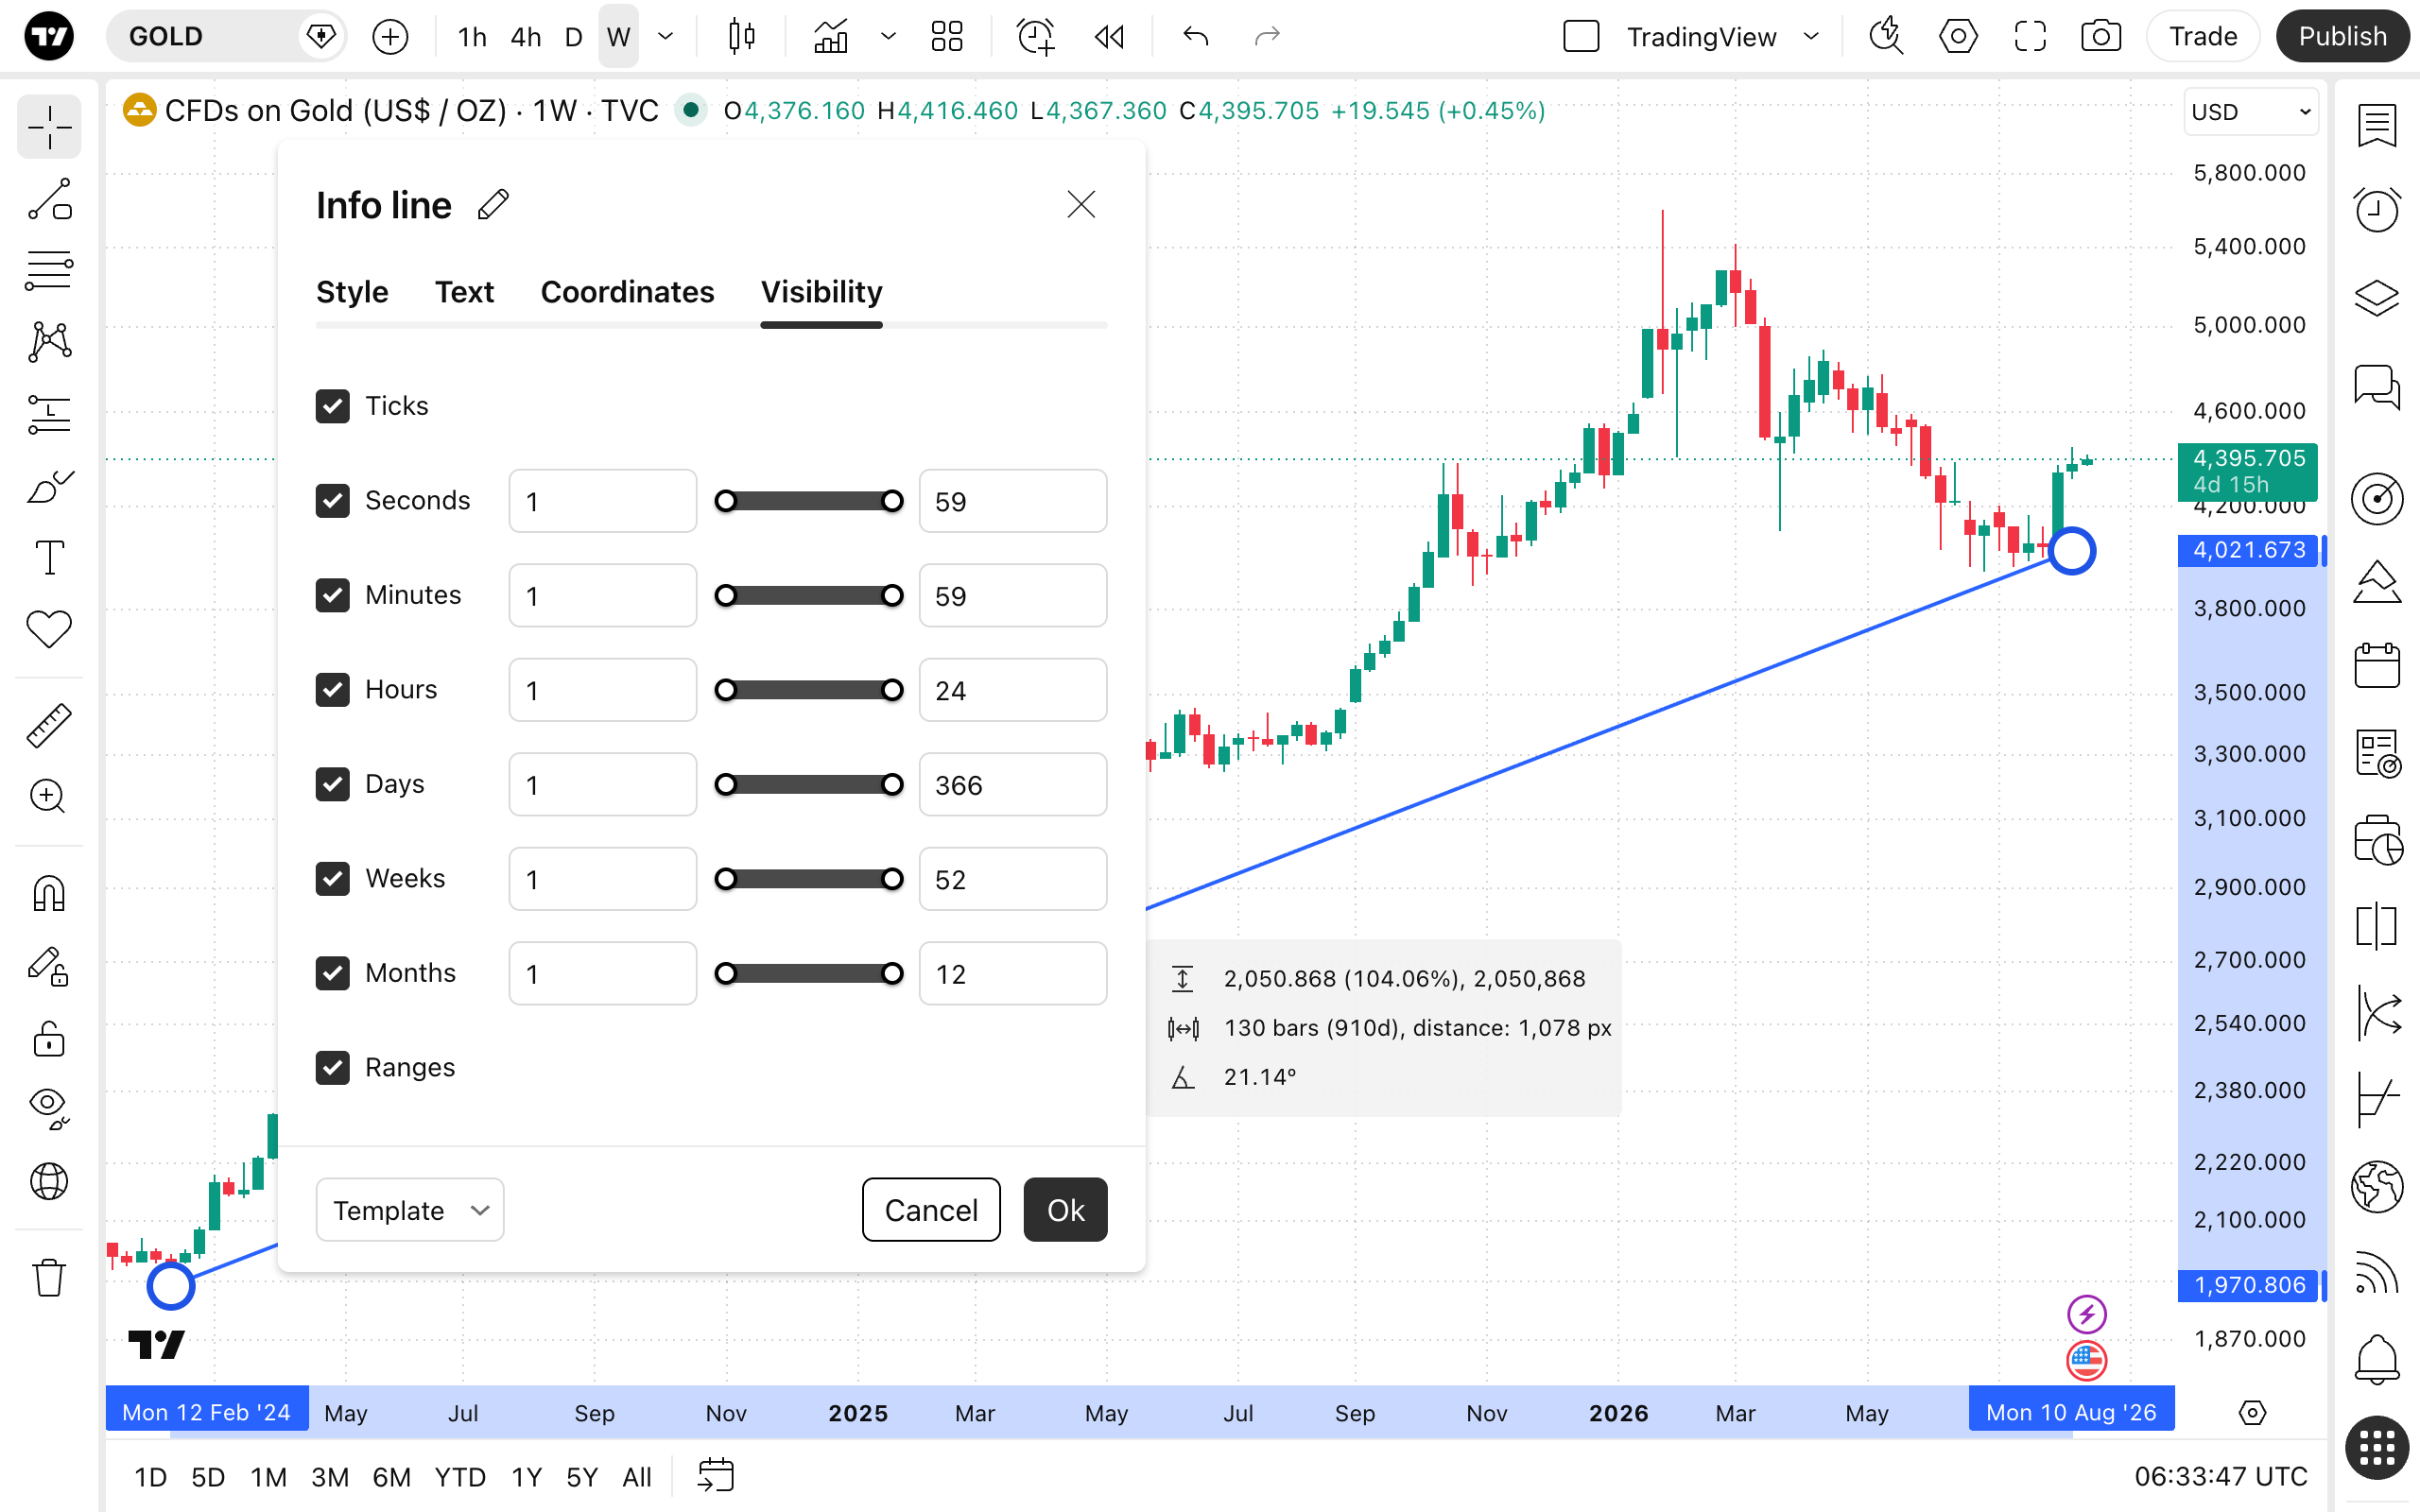
Visibility
In the Visibility properties dialog, you can switch the Info line tool displaying on charts of different chart intervals.