Trend angle drawing tool
Application
The Trend angle drawing tool allows users to identify and measure the exact angle of a trend on the chart. By drawing a line that follows a specific price movement, the tool automatically calculates and displays the angle in degrees relative to the horizontal axis. This is particularly useful for traders who want to gauge the steepness, momentum, or rate of change of a current trend.
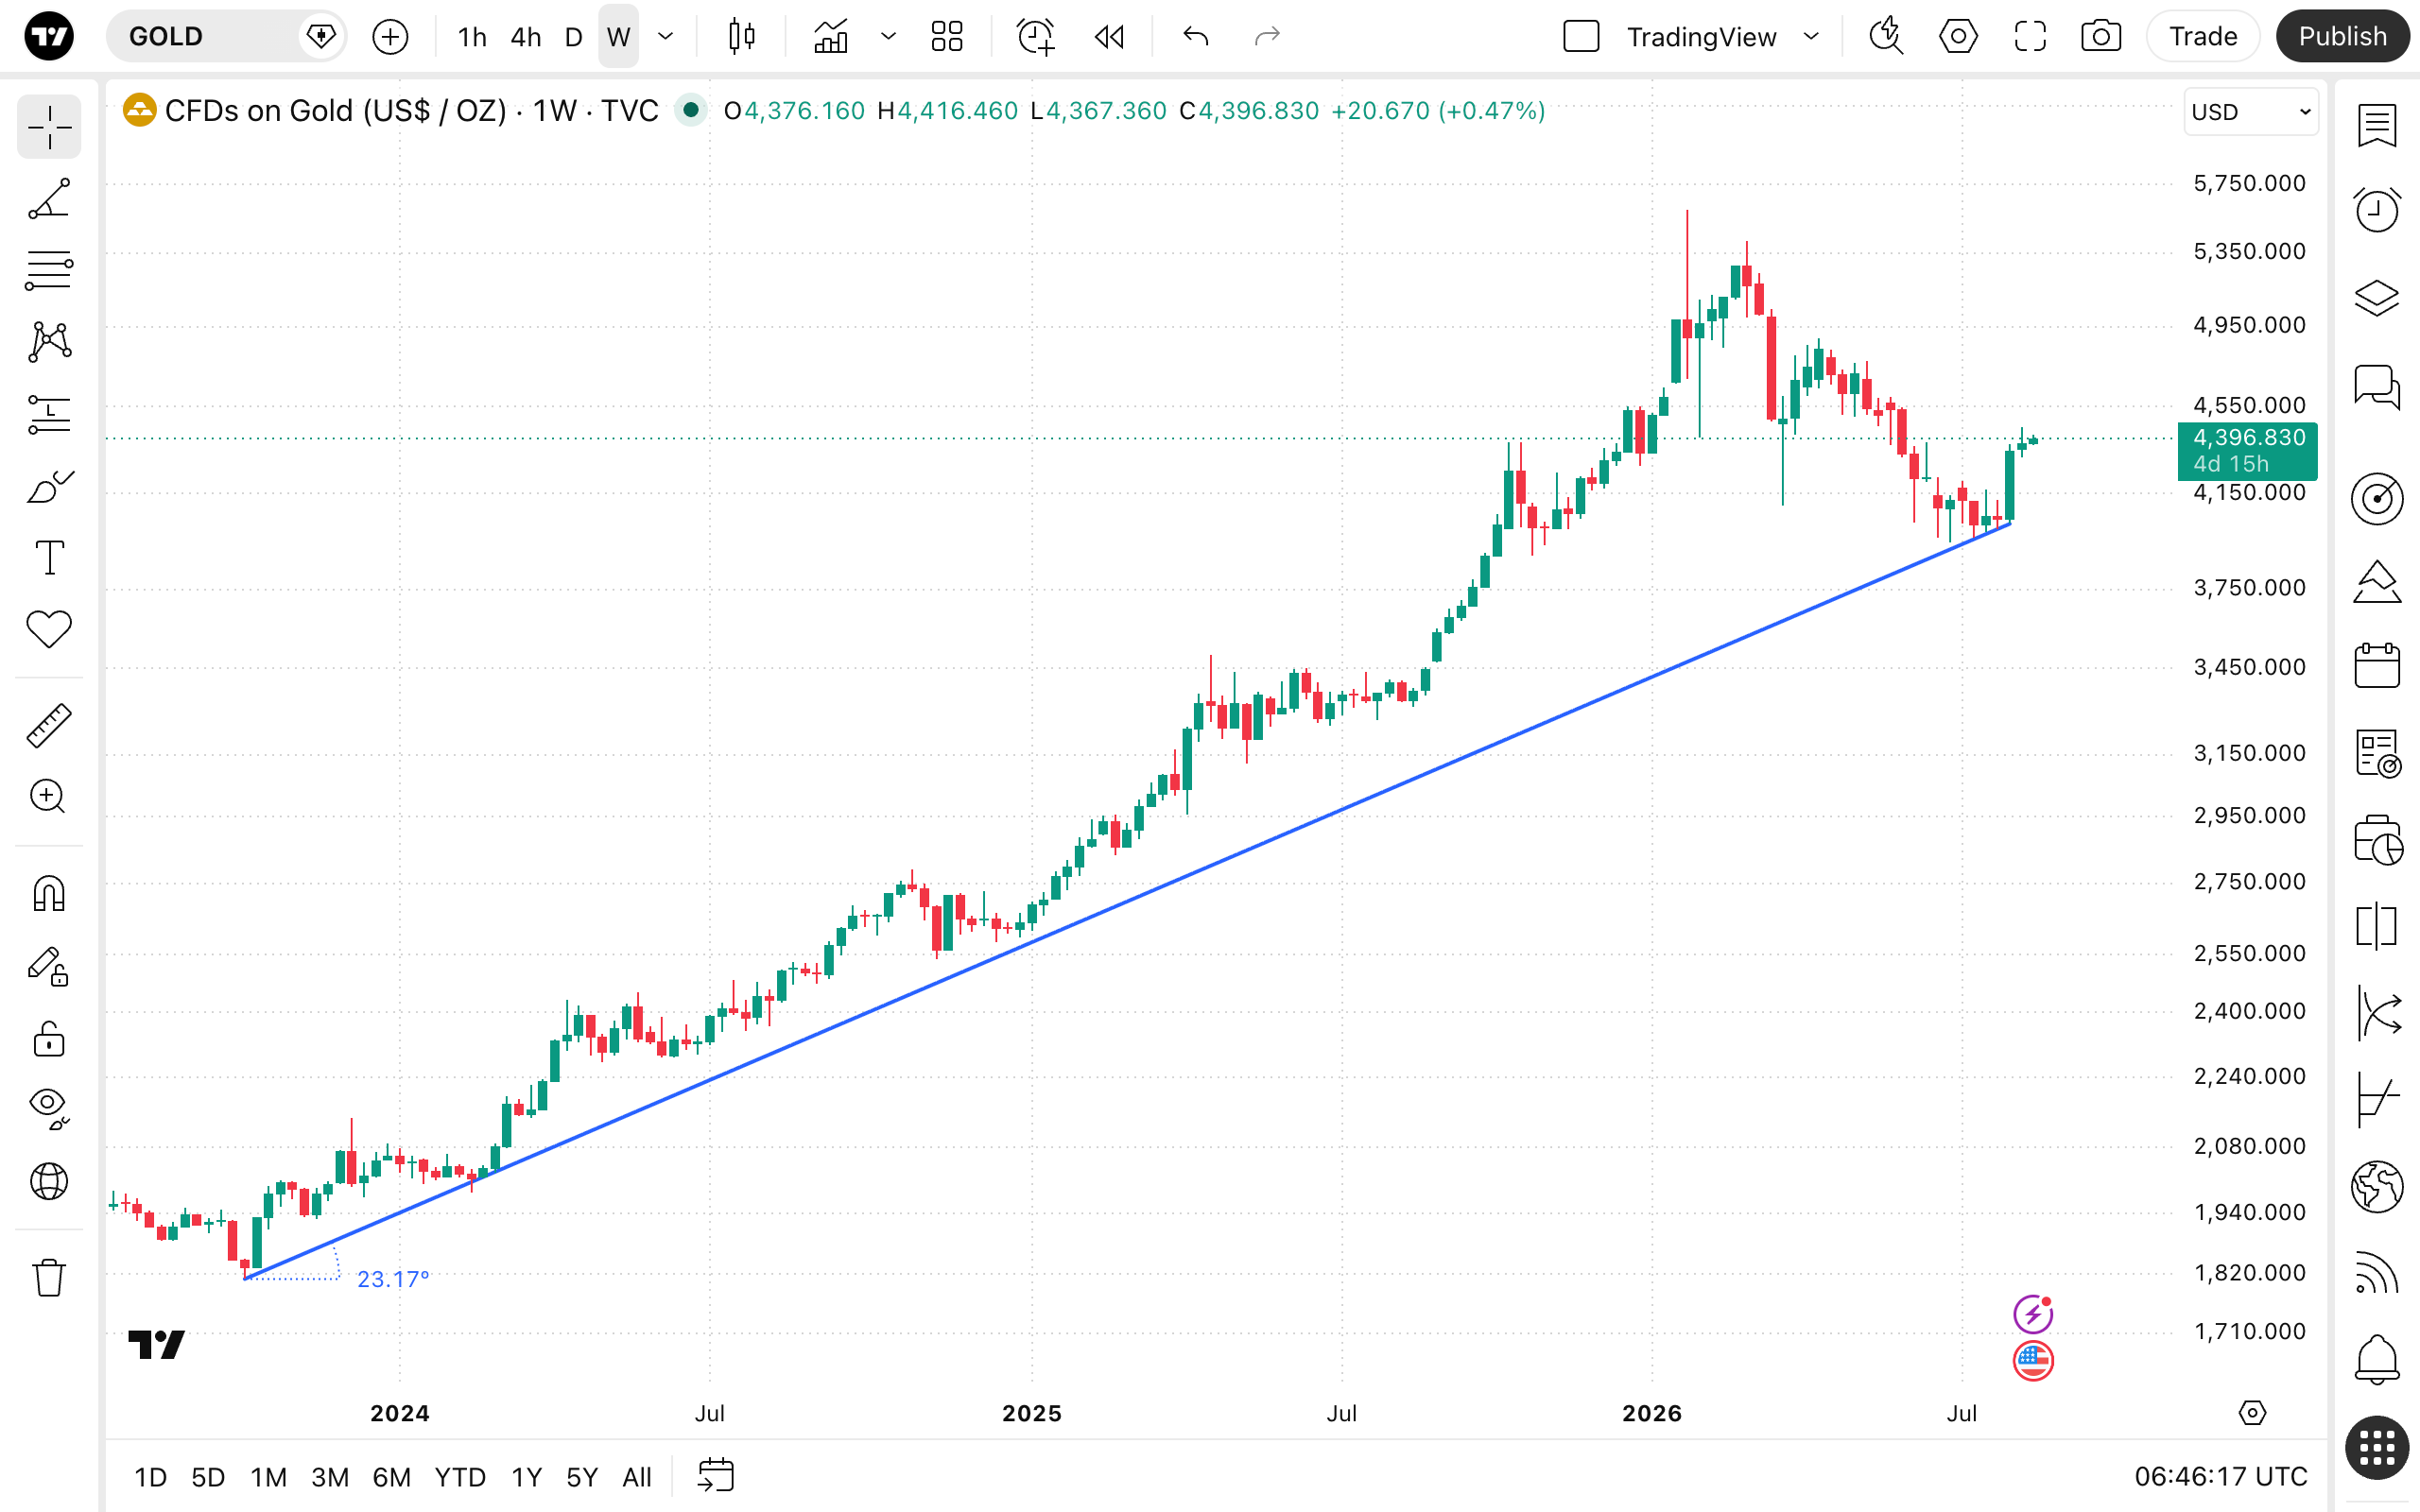
To draw a Trend angle, select the tool from the drawing panel, click on the chart to set the starting point, drag your cursor along the trend, and click again to set the second point. A line will appear connecting the two points, accompanied by a label showing the angle.
Style
In the Style properties dialog, it is possible to change the visual appearance and configuration of the Trend angle tool:
- Line: Allows you to set the color, opacity, thickness, and style (solid, dashed, dotted) of the trendline.
- Extend: Offers a dropdown menu to extend the trendline indefinitely to the left, right, or both, or to not extend it.
- Middle point: Toggles the visibility of a center point on the trendline.
- Price labels: Toggles the visibility of price value labels at the start and end points of the trendline.
- Info section:
- Stats: Provides a dropdown menu to select which statistical information is displayed:
- Price range.
- Percent change.
- Change in pips.
- Bars range.
- Stats position: Offers a dropdown menu to define where the statistical text box is positioned relative to the trendline:
- Left.
- Center.
- Right.
- Auto.
- Always show stats: When checked, the statistics text box remains visible on the chart even when the drawing tool is not selected.
- Stats: Provides a dropdown menu to select which statistical information is displayed:
Coordinates
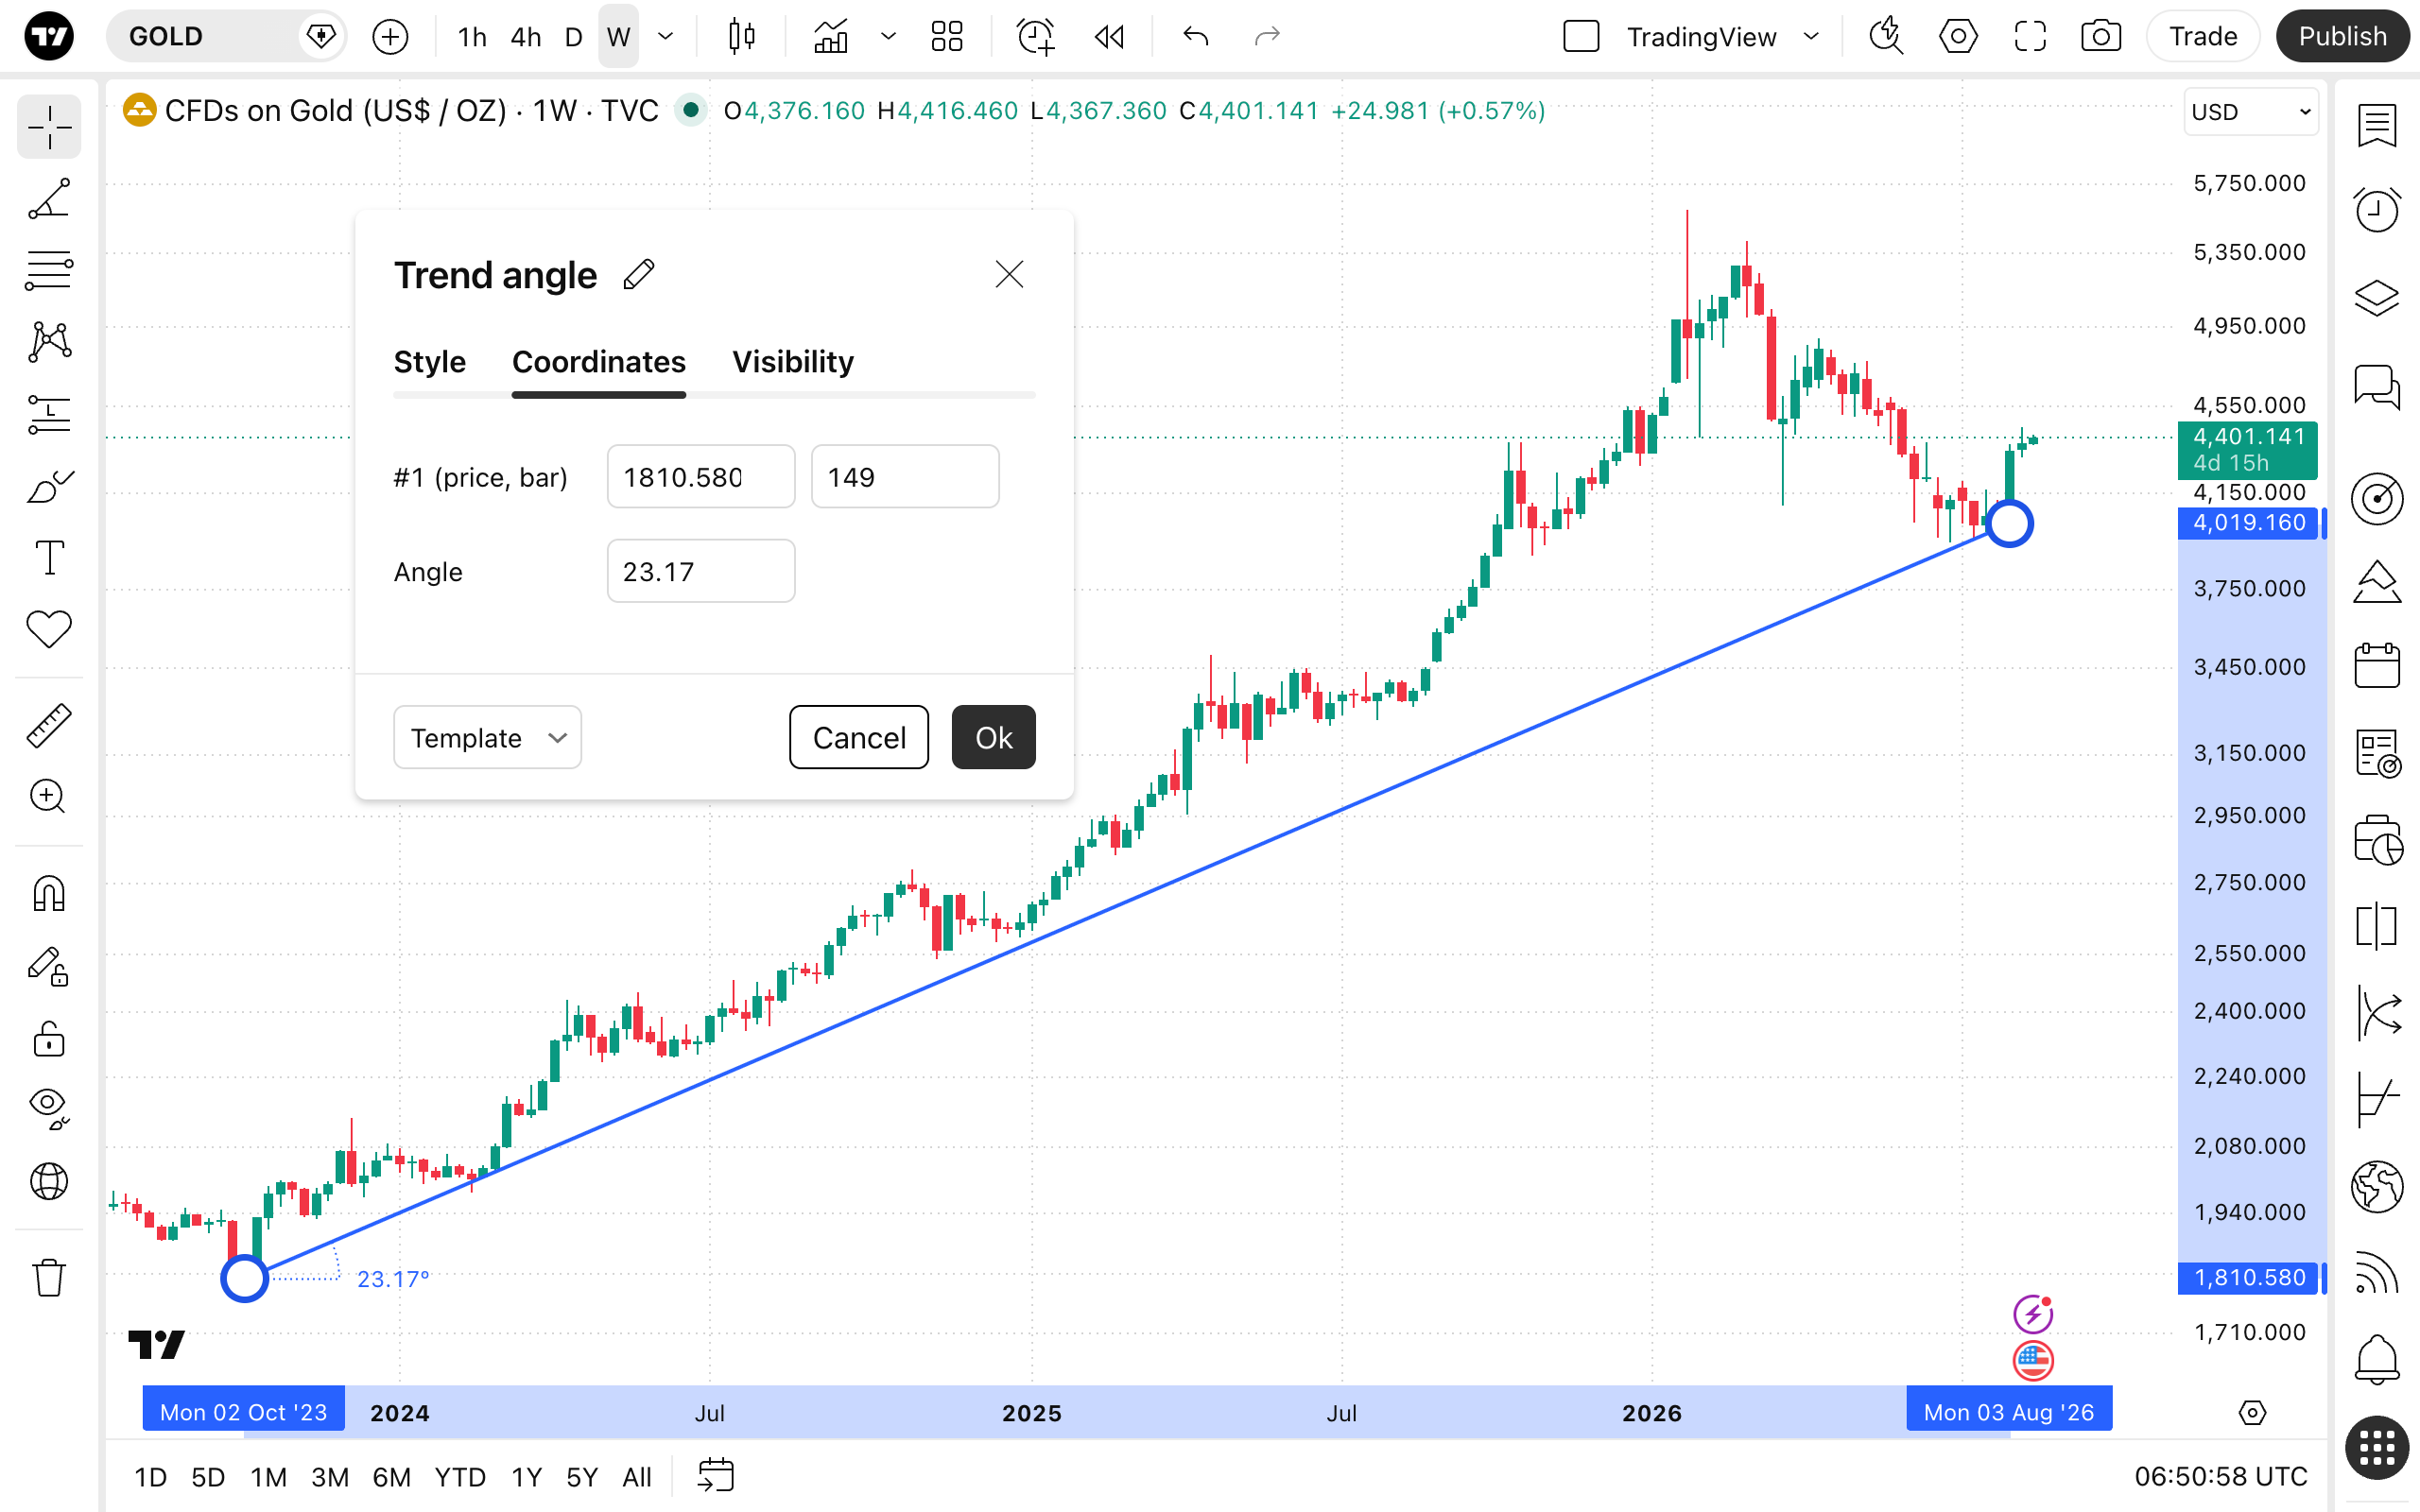
In the Coordinates properties dialog, you can set precisely the position of the Trend angle's endpoints on the price scale (by setting the price) and the time axis (by setting the bar number):
- Price 1: Allows for the precise placement of the line's first point (Price 1) using a bar number and price.
- Angle: Allows you to set the exact angle (in degrees) at which the line will be drawn relative to the horizontal axis, strictly defining the line's slope.
Visibility
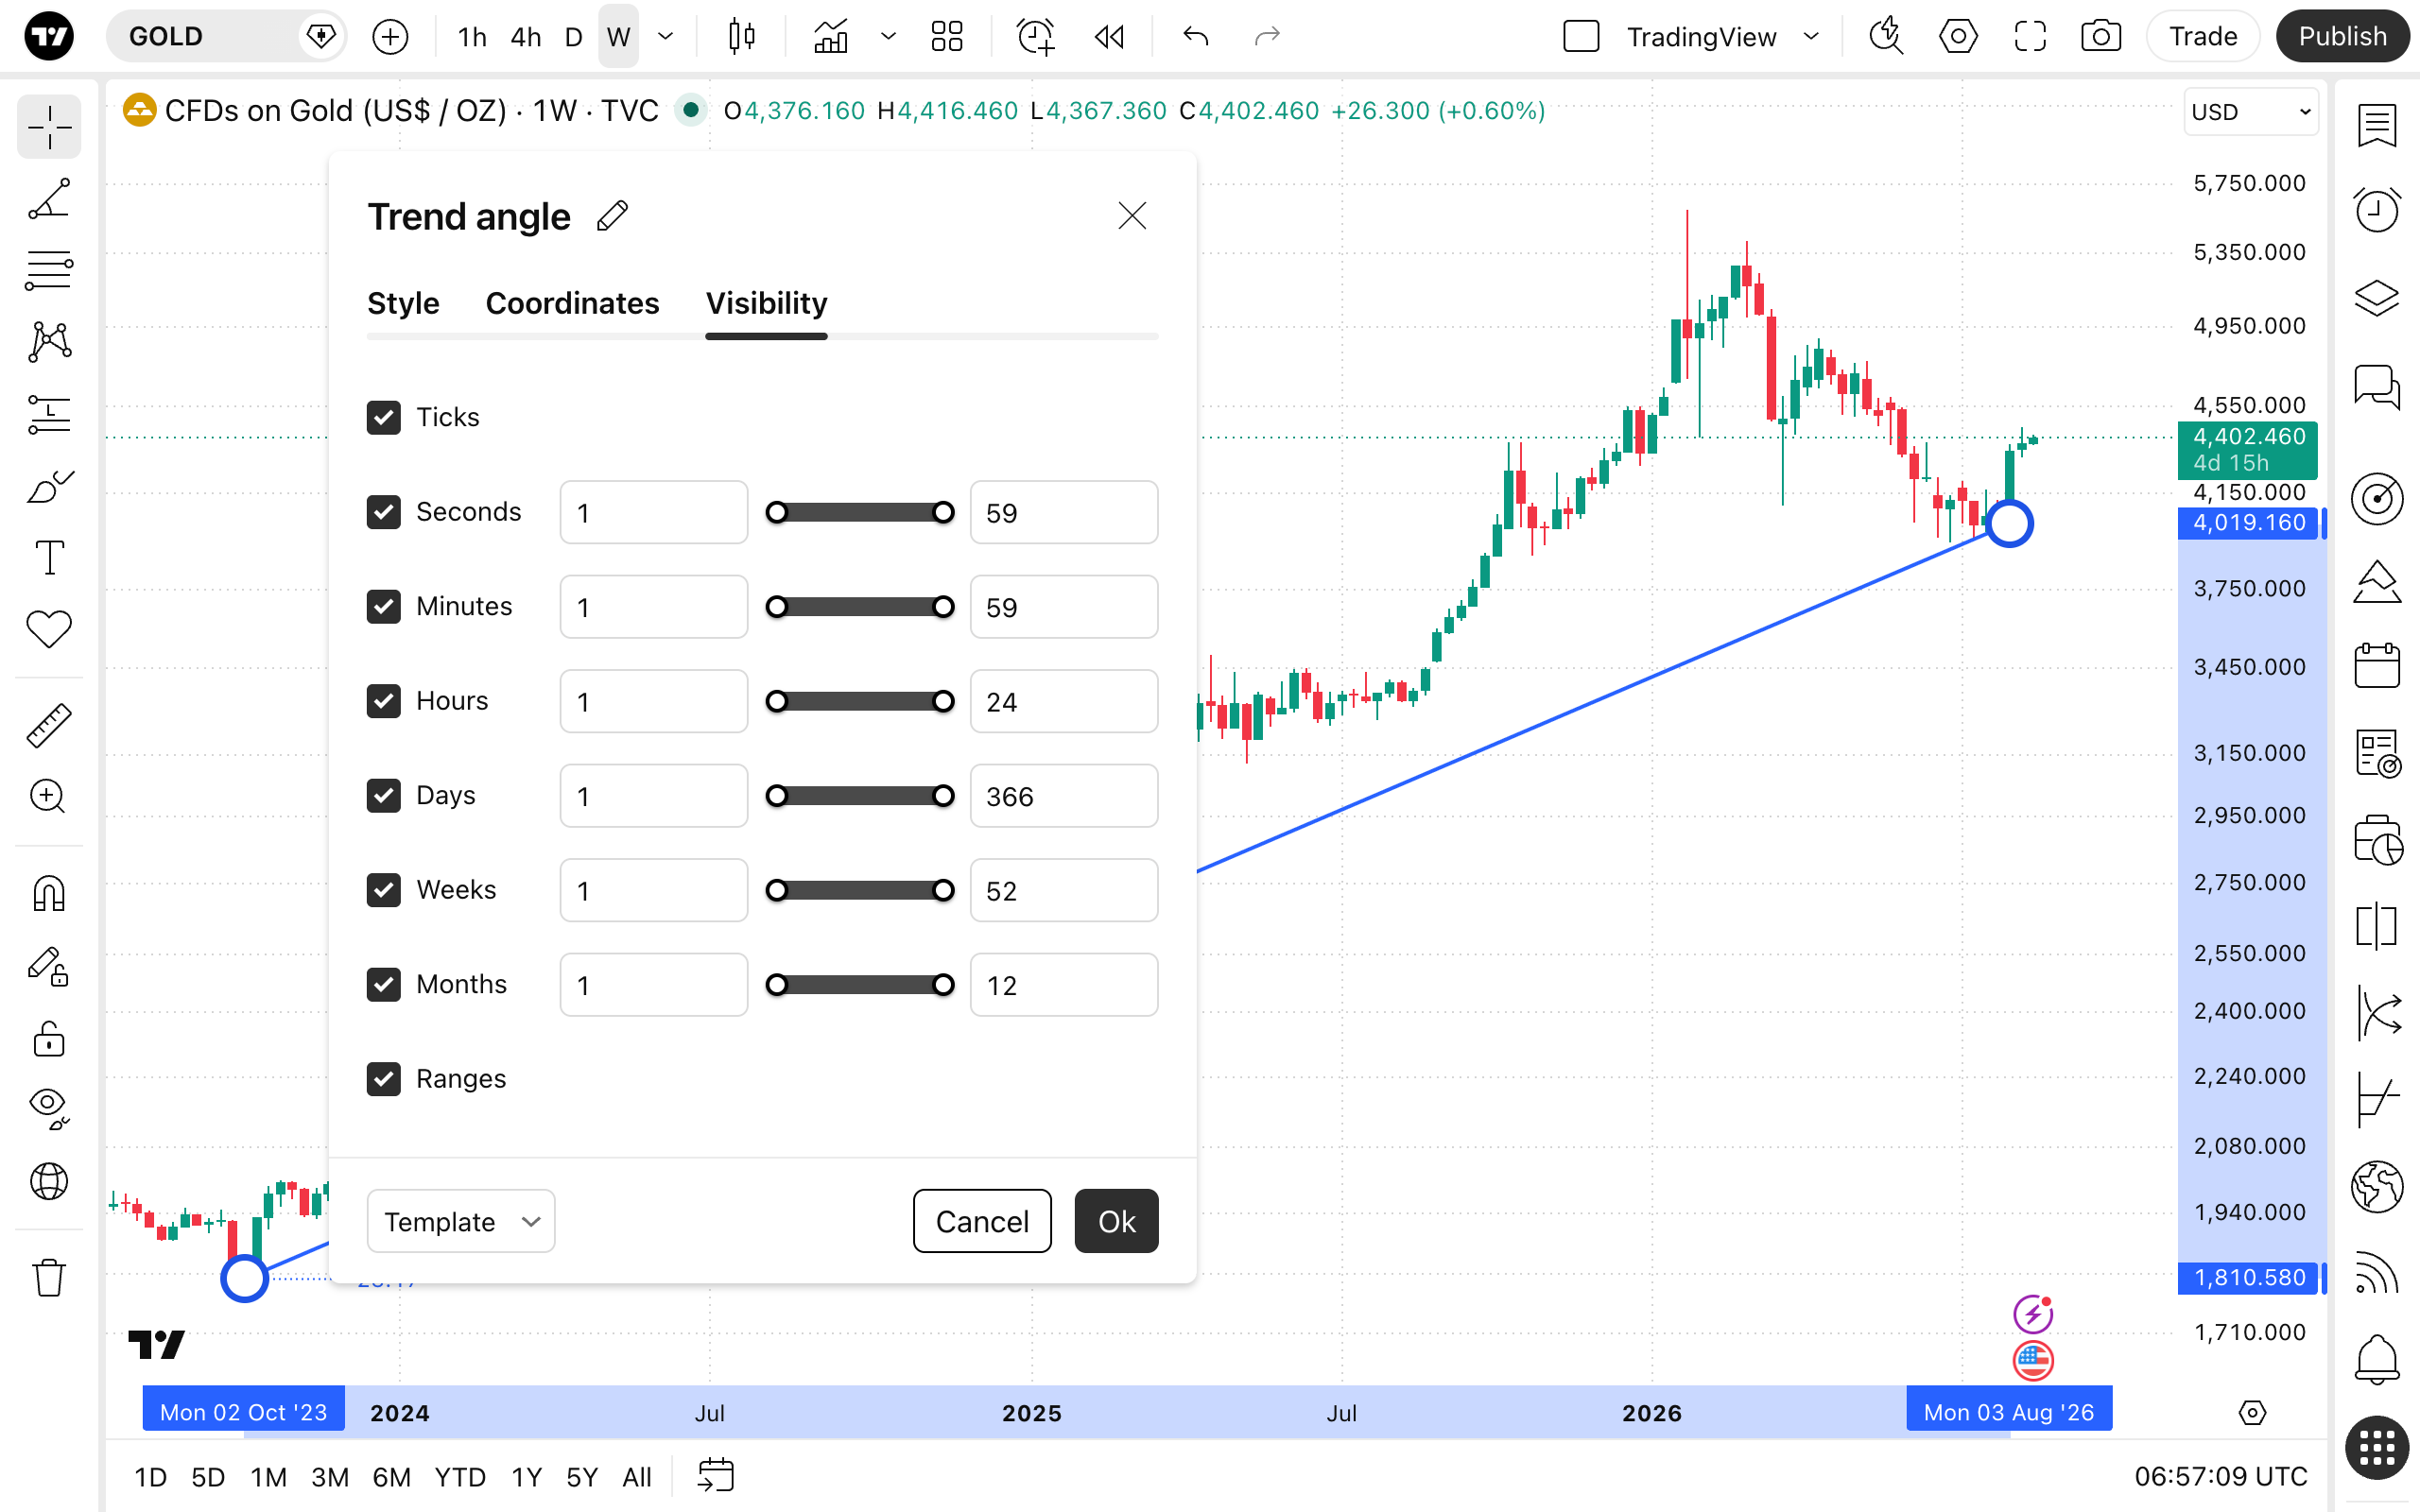
In the Visibility properties dialog, you can switch the Trend angle tool displaying on charts of different chart intervals.