Fibonacci channel drawing tool
Application
The Fib channel drawing tool is an advanced version of the standard parallel channel. It allows traders to project Fibonacci ratios as parallel lines to a base trendline, helping to identify potential support and resistance levels within a trending market.
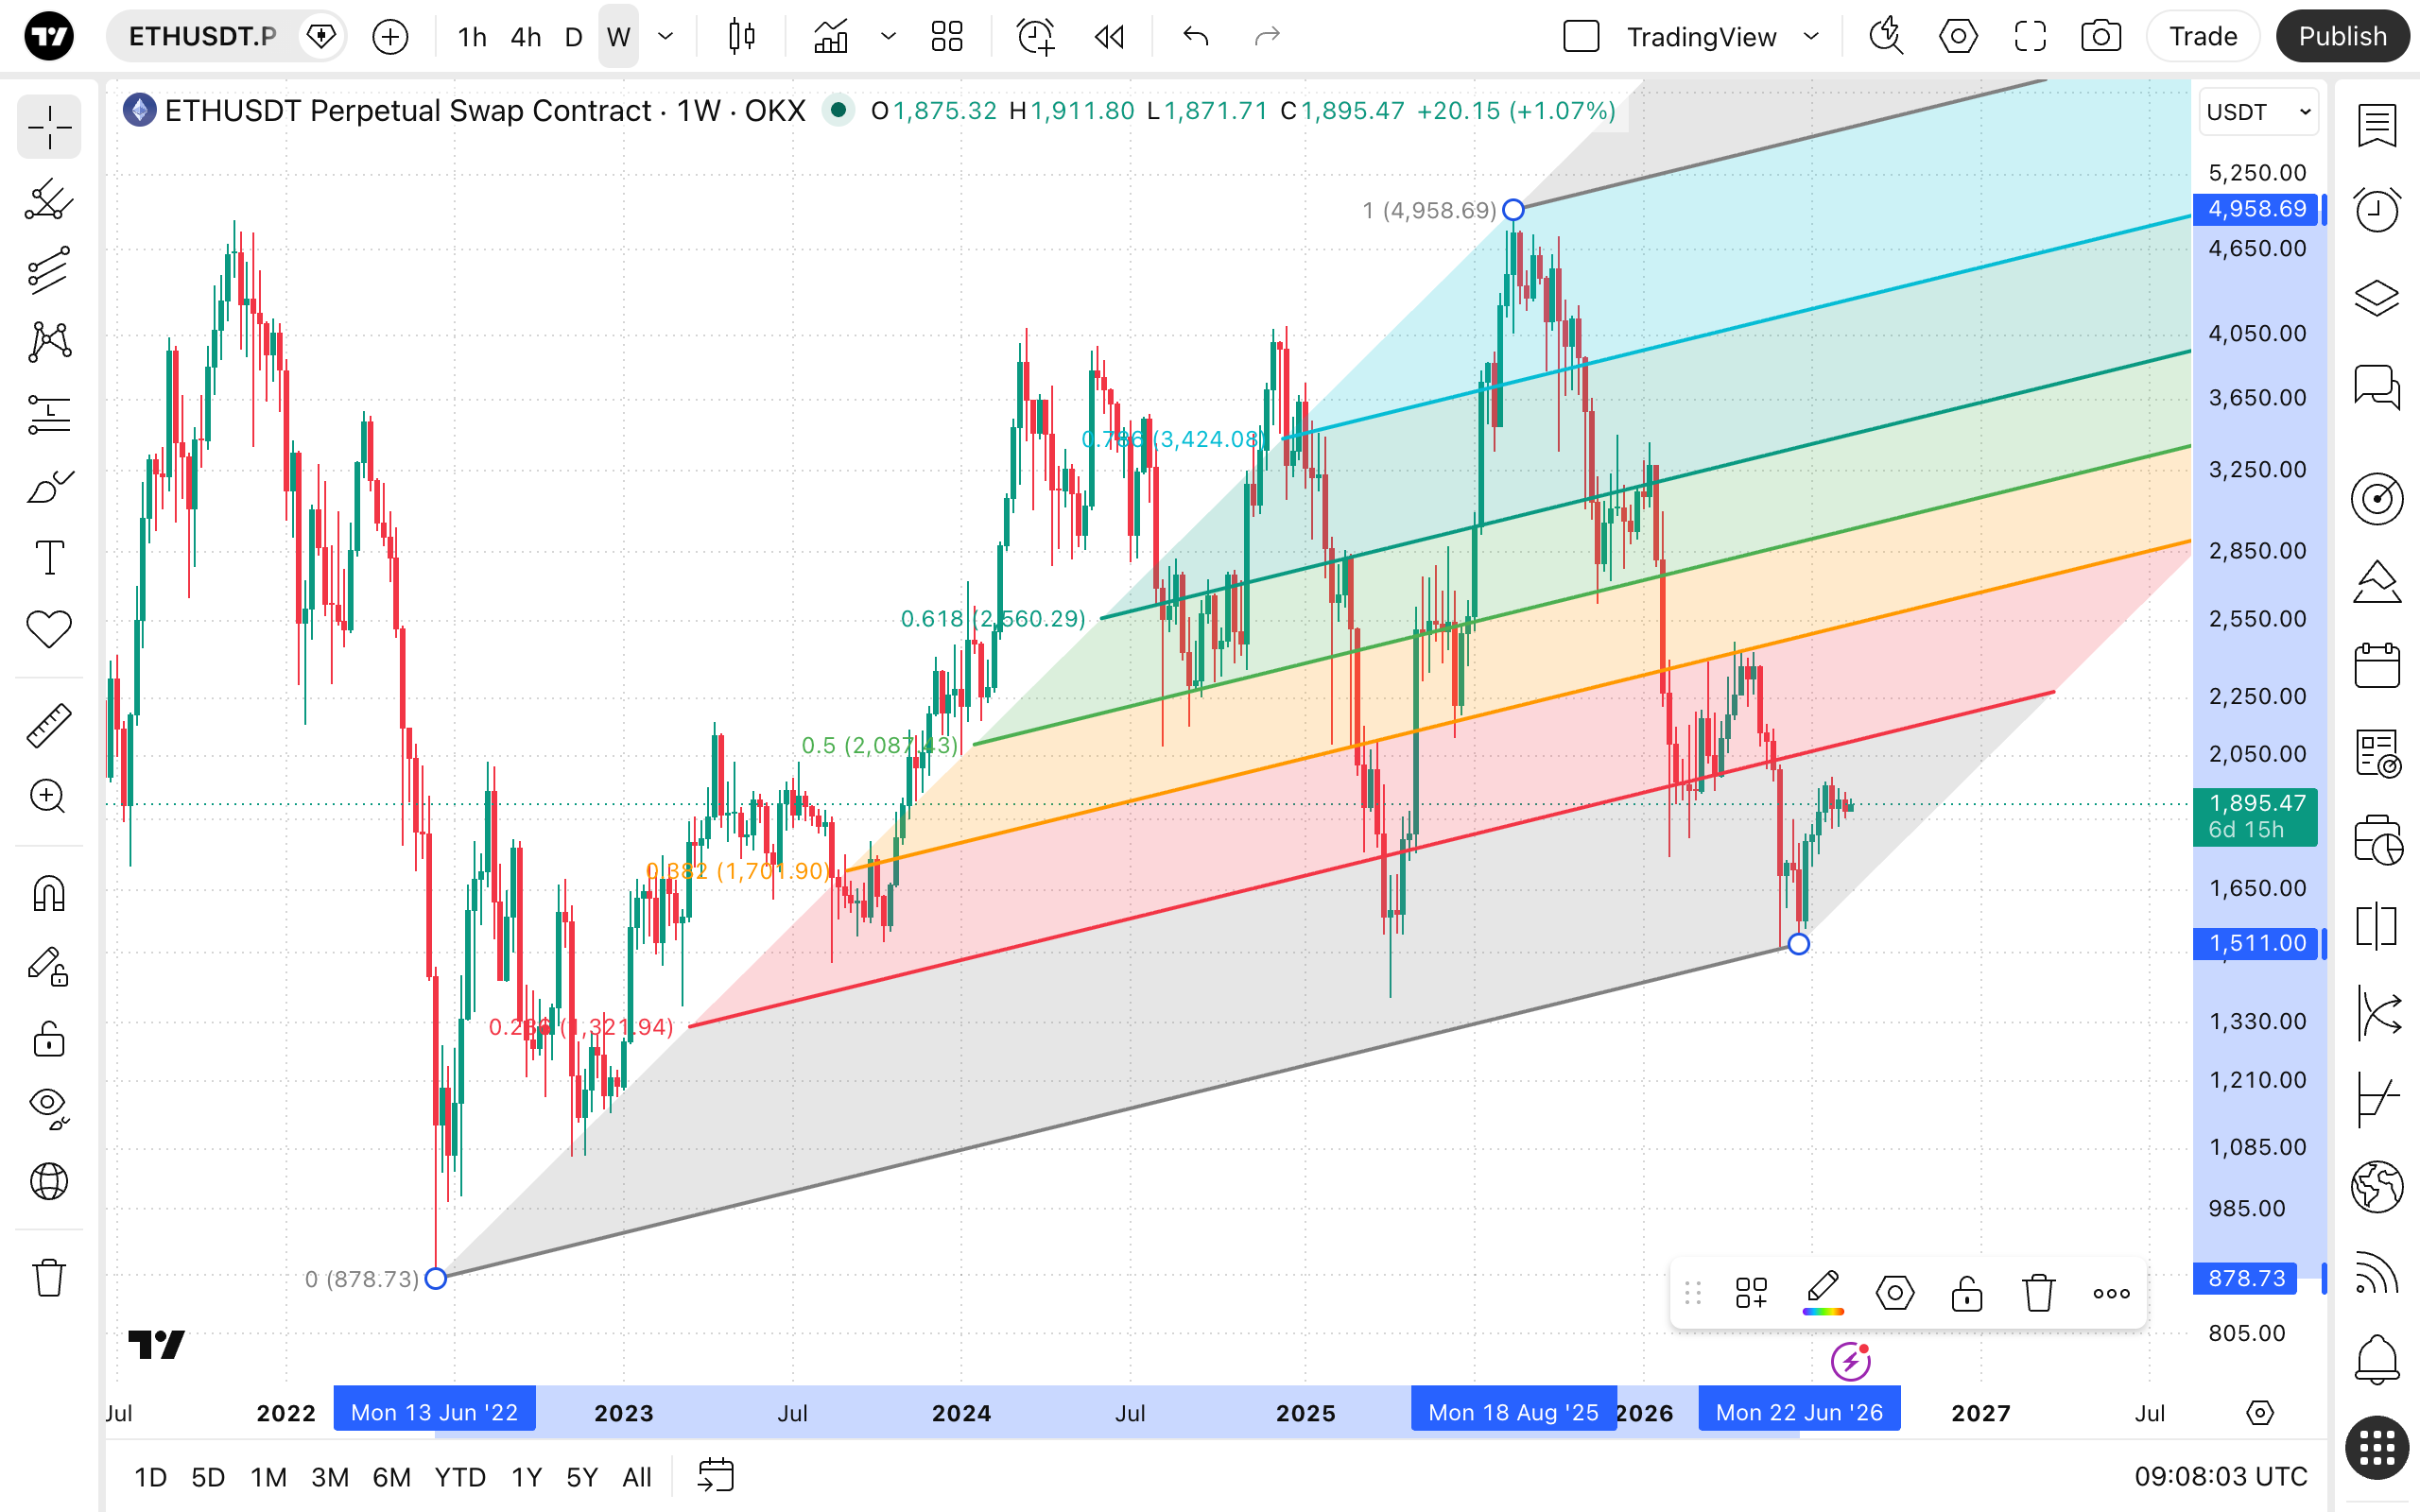
To draw a Fib channel, select the tool from the drawing panel. Click the first two points on the chart to establish the primary trendline (usually connecting two major peaks or troughs). Then, click a third point to define the width of the base channel (which establishes the 0 and 1 levels). The tool will automatically calculate and draw the remaining parallel Fibonacci levels based on your selected settings.
Style
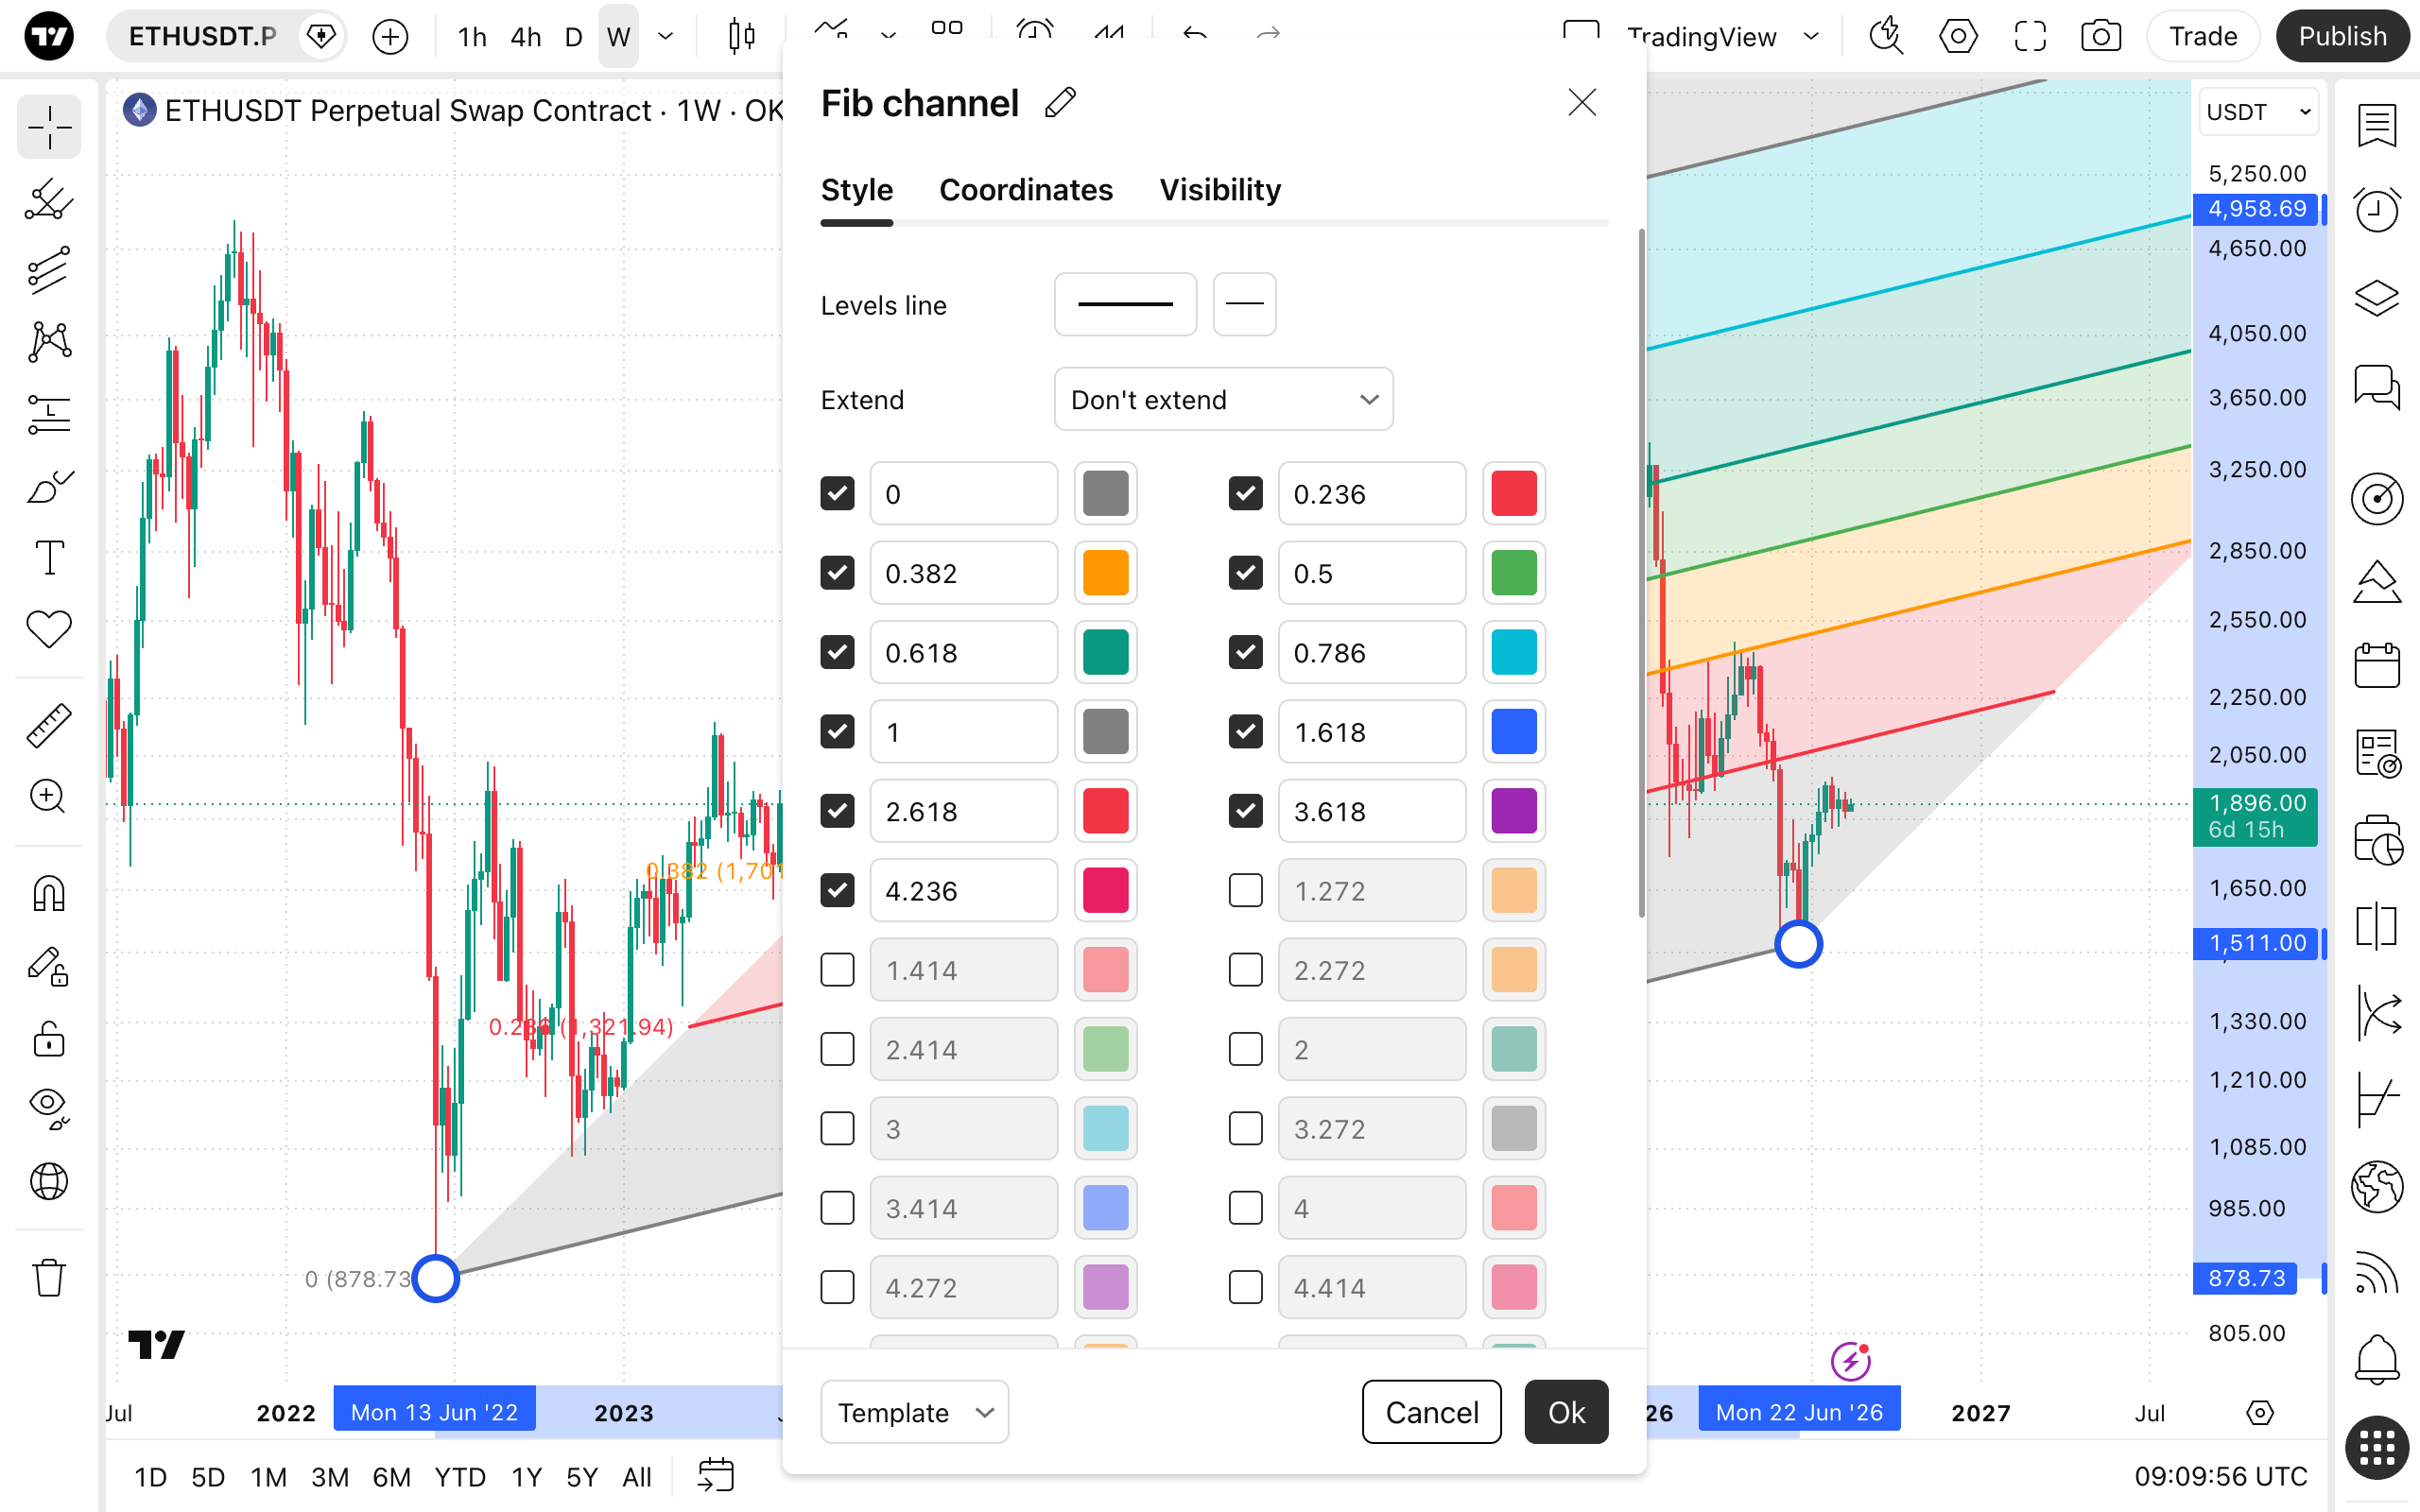
In the Style properties dialog, it is possible to change the visual appearance and configuration of the Fib channel tool:
- Levels line: Sets the thickness and line style (solid, dashed, dotted) for all the lines in the channel.
- Extend: Offers a dropdown menu to choose whether to extend the channel lines indefinitely to the left, right, both, or not at all.
- Fib levels: A grid of checkboxes allows you to toggle the visibility of specific Fibonacci levels (e.g., 0, 0.382, 0.618, 1, 1.618, etc.). You can manually adjust the ratio values in the input boxes and individually change the color for each active level using the color pickers.
- Use one color: A convenient button that, when clicked, applies a single uniform color to all active lines and background fills within the tool.
- Background: Toggles the visibility of the shaded background fill between the channel lines. You can use the adjacent slider to adjust the opacity level.
- Prices: Toggles the visibility of the exact price values displayed alongside each channel line.
- Levels: Toggles the visibility of the Fibonacci ratio labels. A dropdown menu allows you to choose whether to display these levels as standard Values (e.g., 0.618) or Percents (e.g., 61.8%).
- Labels: Provides two dropdown menus to customize the positioning of the text labels on the lines. You can adjust horizontal placement (e.g., Left, Right, Center) and vertical placement (e.g., Top, Middle, Bottom).
- Font size: Allows you to change the text size of the labels on the chart.
Coordinates
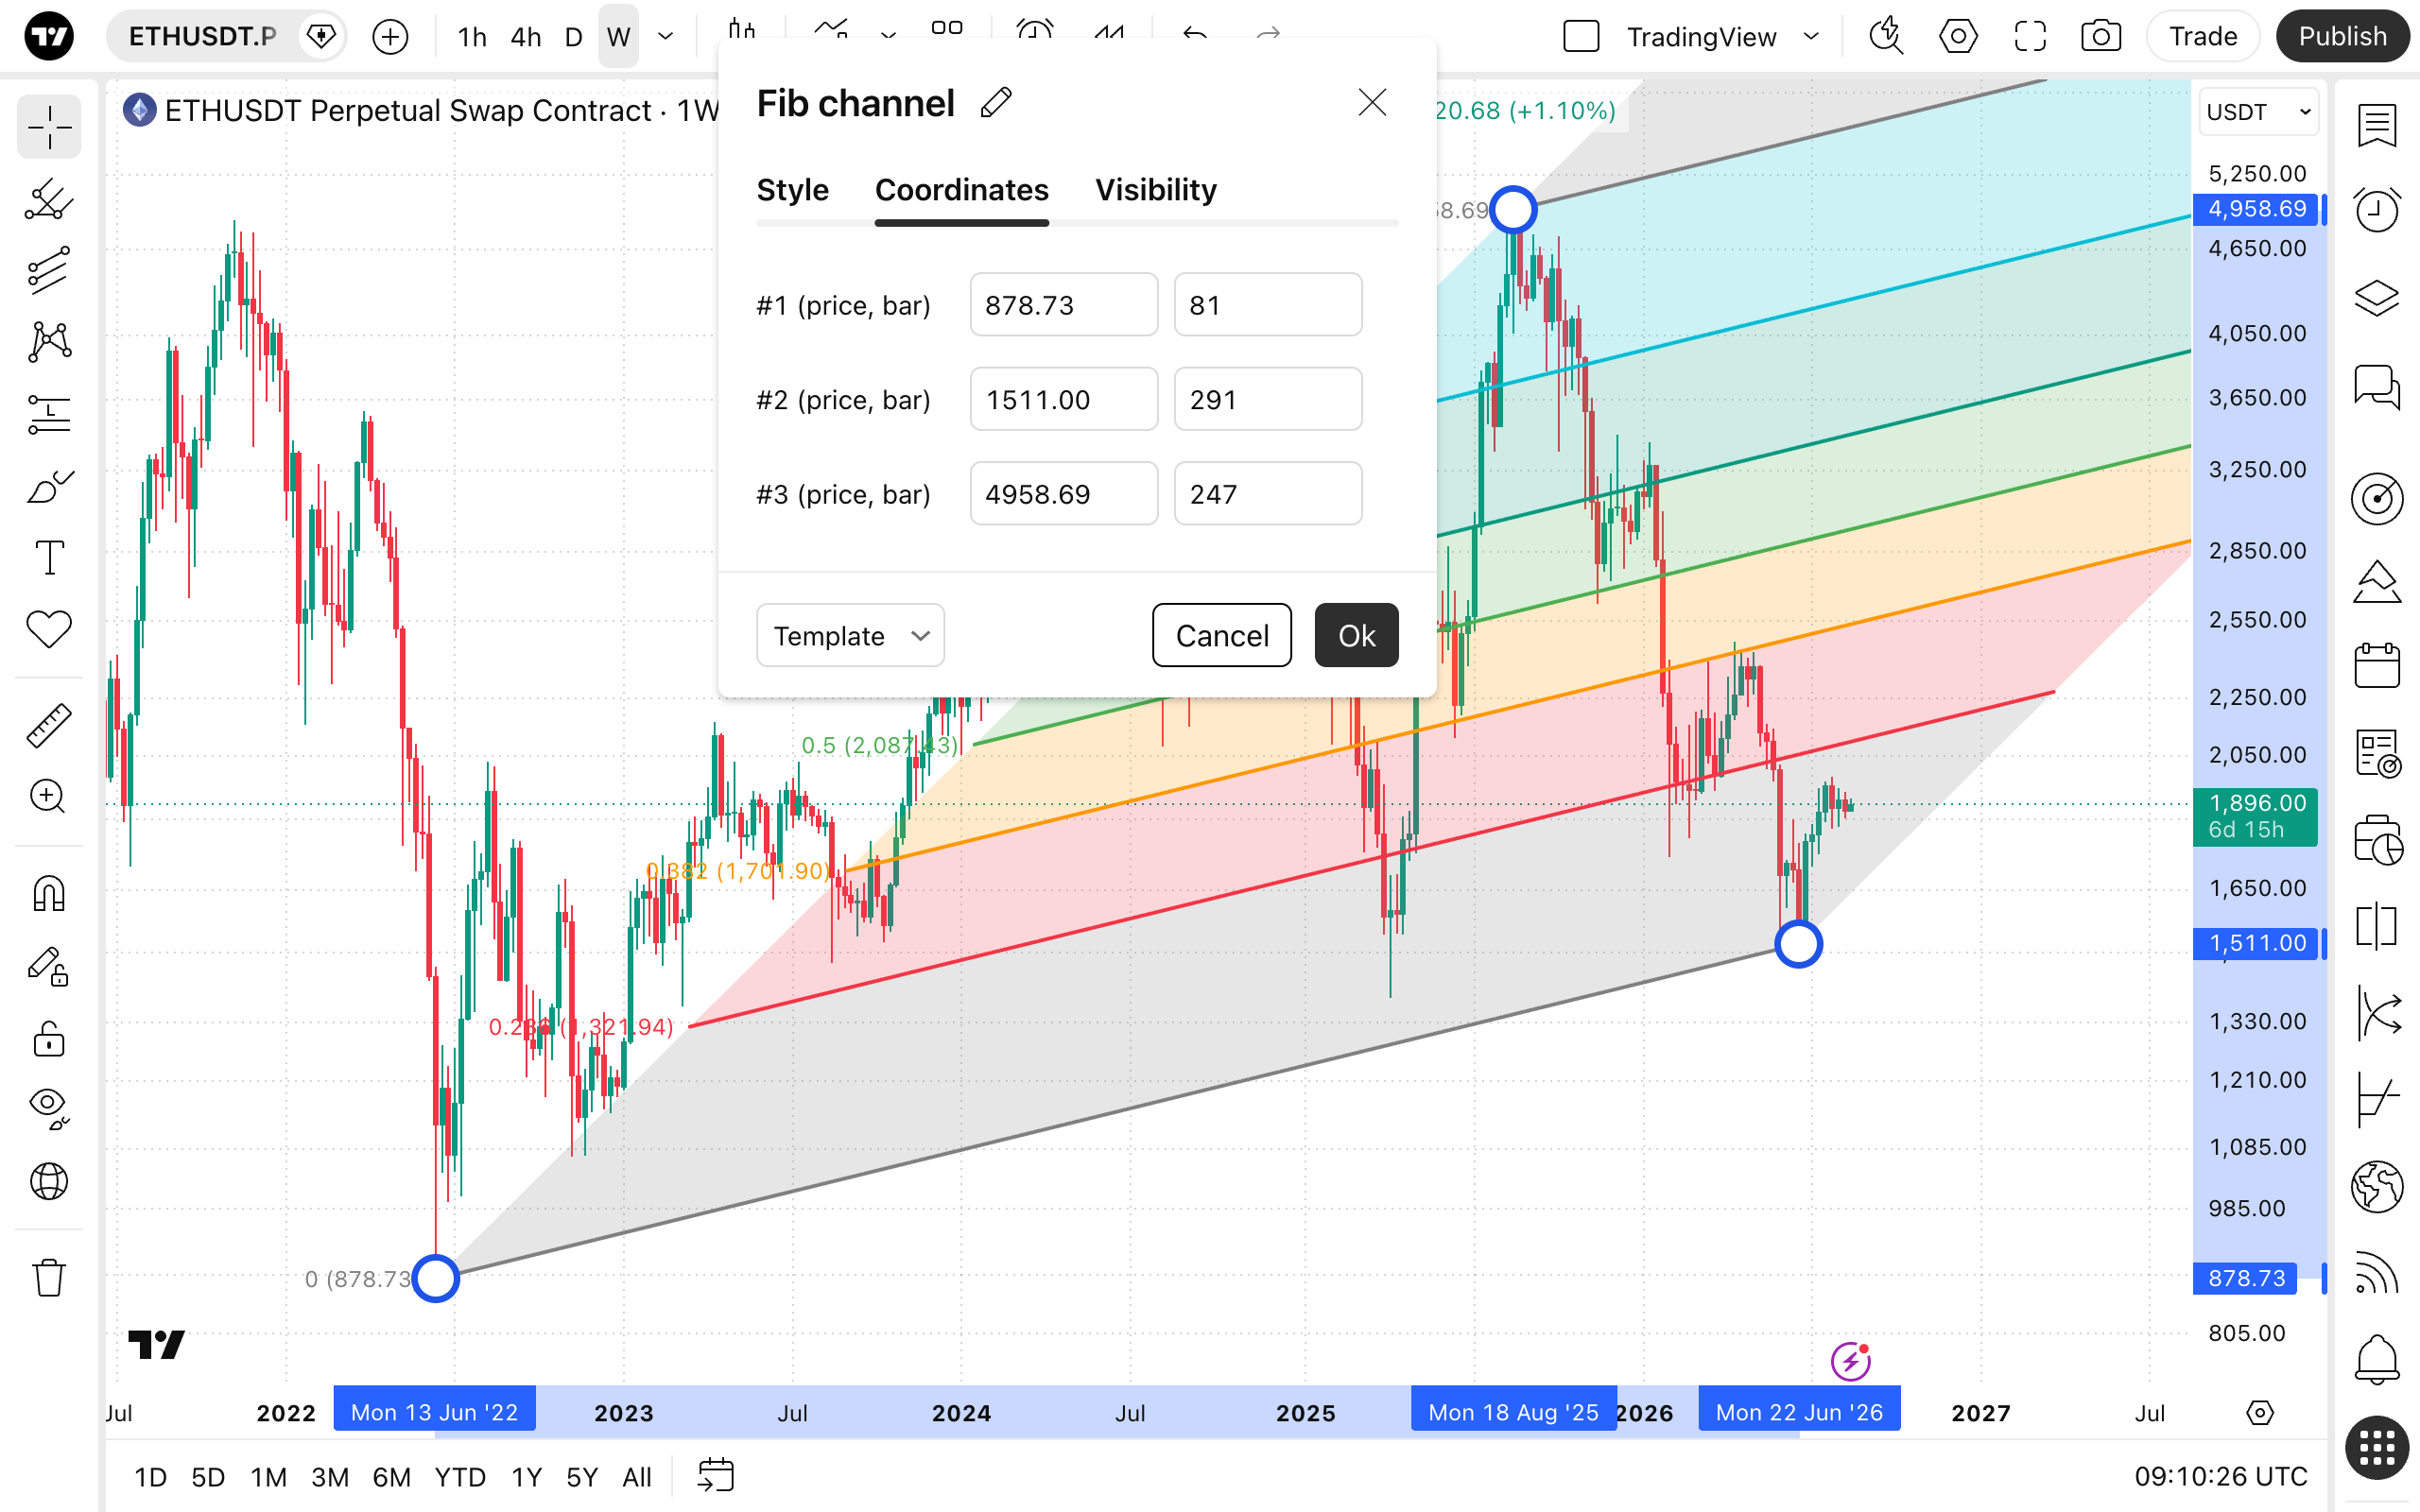
In the Coordinates properties dialog, you can set precisely the position of the tool's anchor points on the price scale (by setting the price) and the time axis (by setting the bar number):
- Price 1: Allows for the precise placement of the channel's first point using a bar number and price.
- Price 2: Allows for the precise placement of the channel's second point using a bar number and price.
- Price 3: Allows for the precise placement of the channel's third point, which establishes the parallel width of the base channel, using a bar number and price.
Visibility
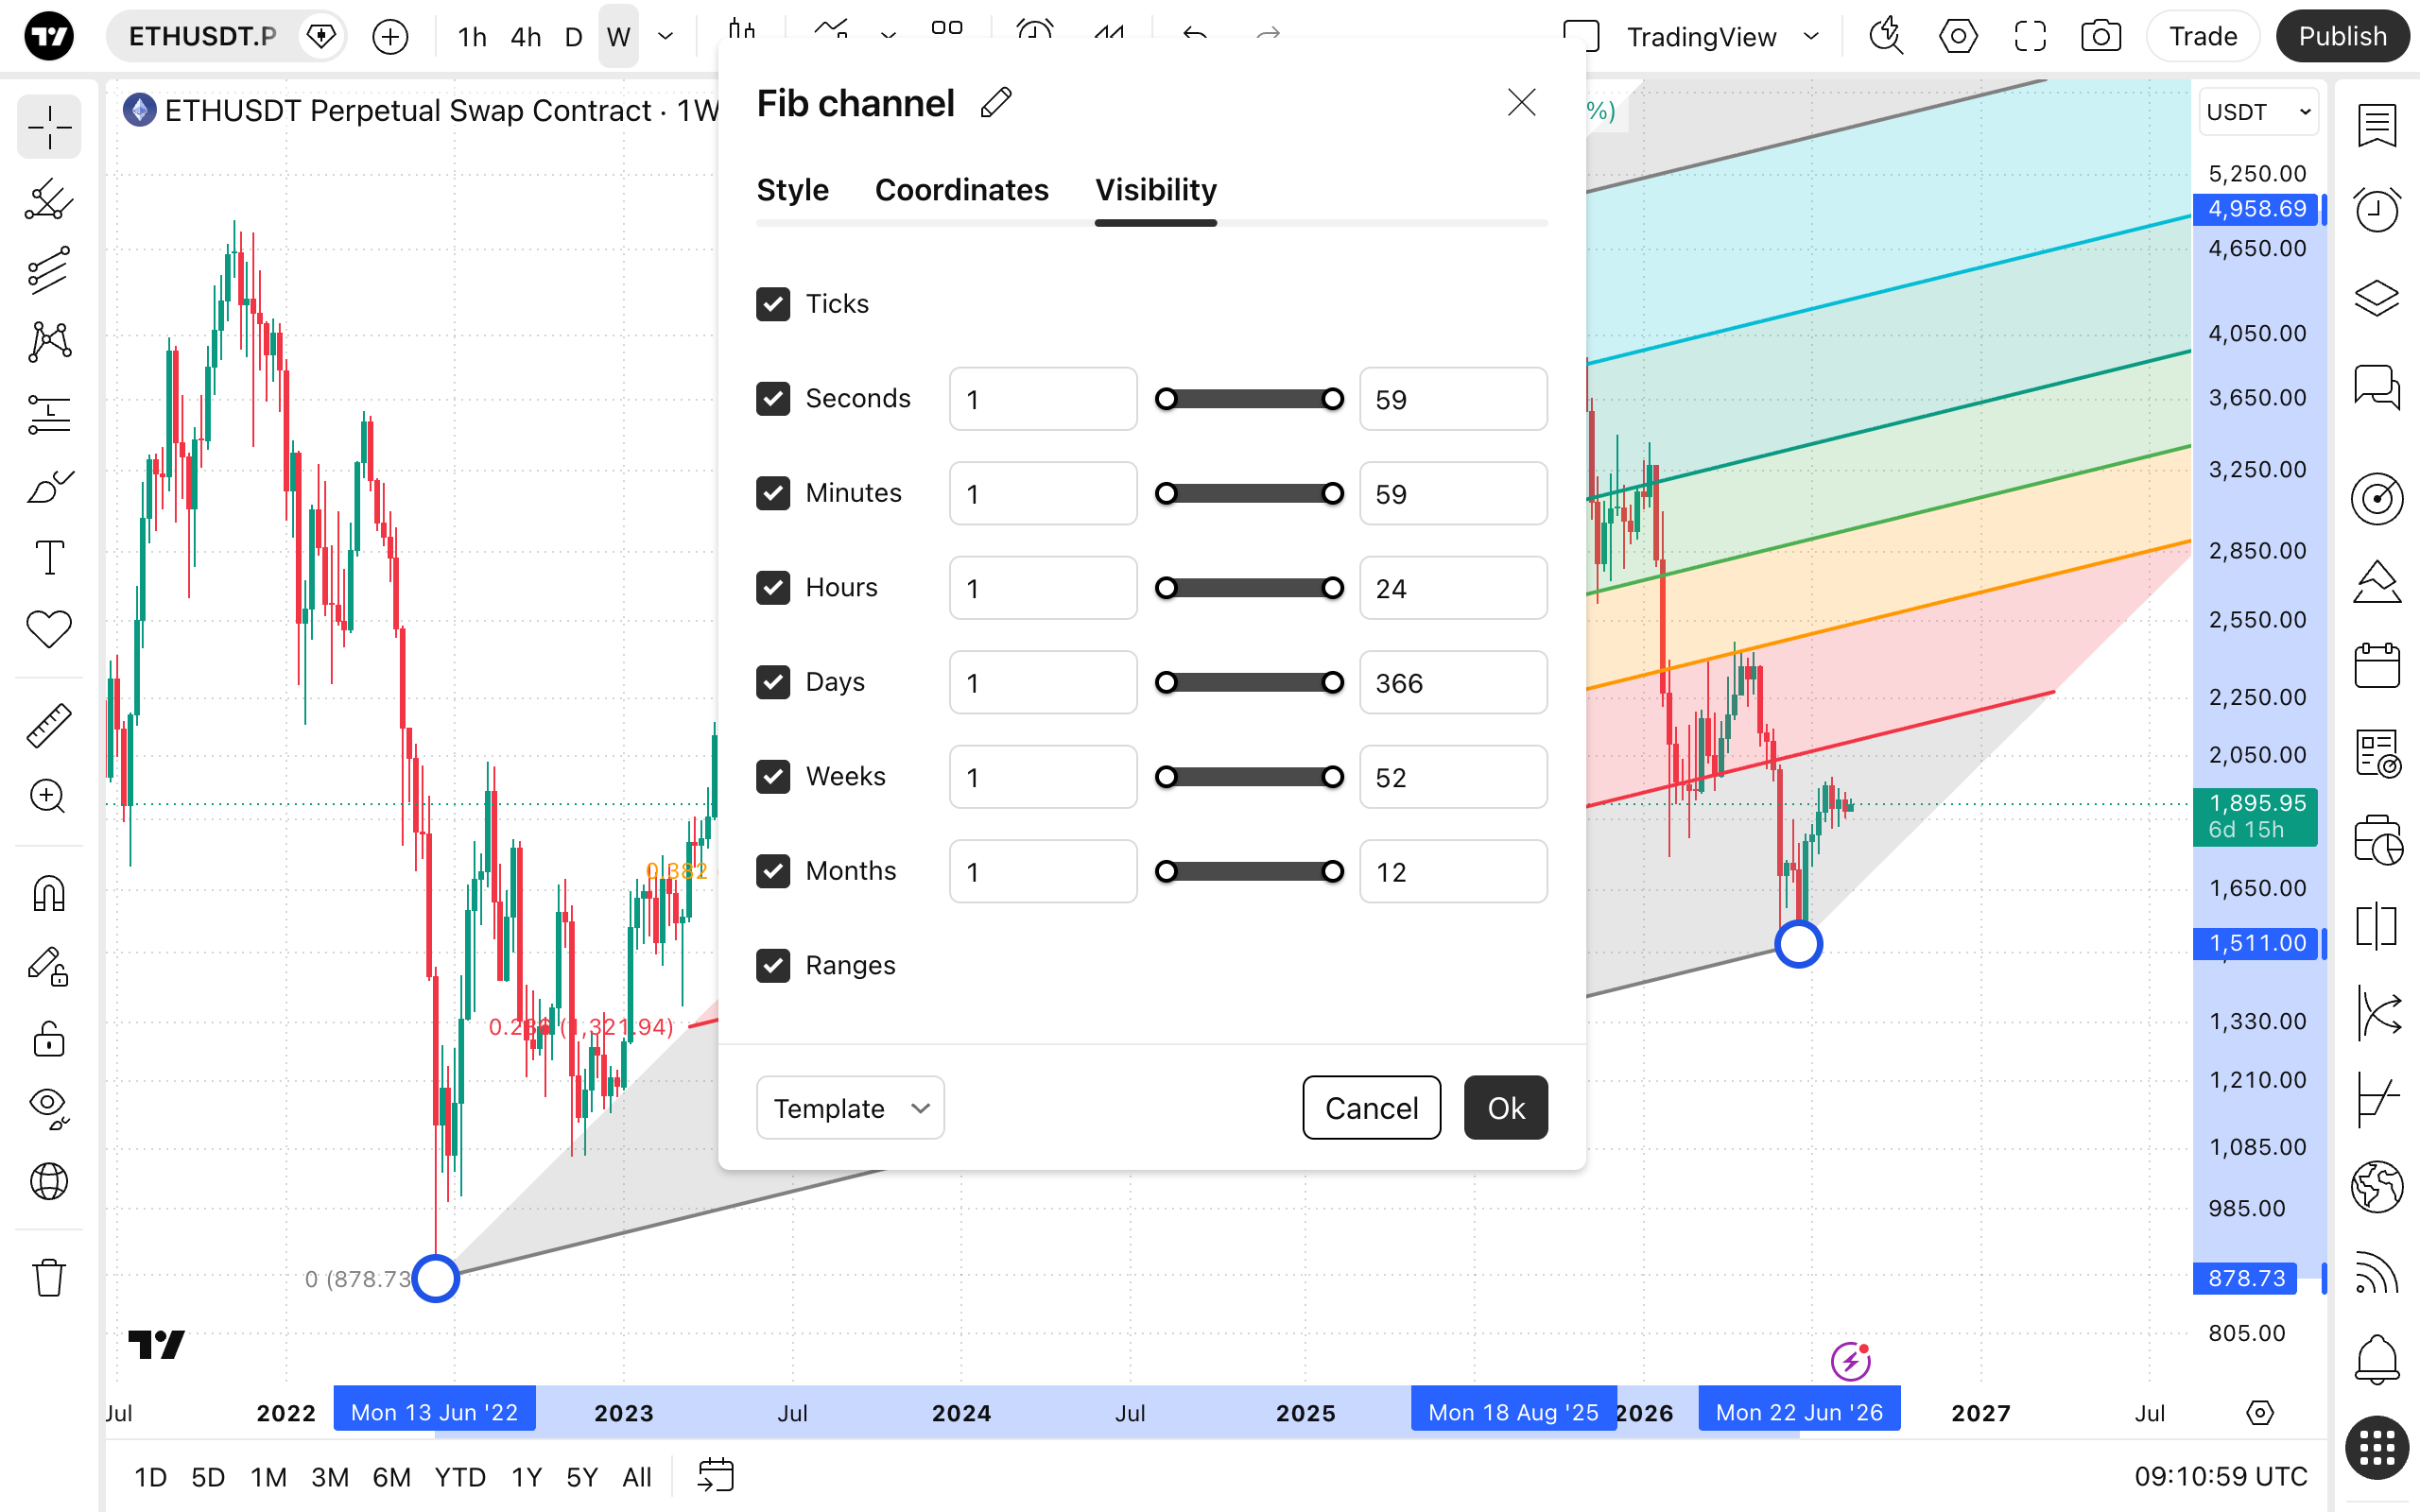
In the Visibility properties dialog, you can switch the Fib channel tool displaying on charts of different chart intervals.