Gann square fixed drawing tool
Application
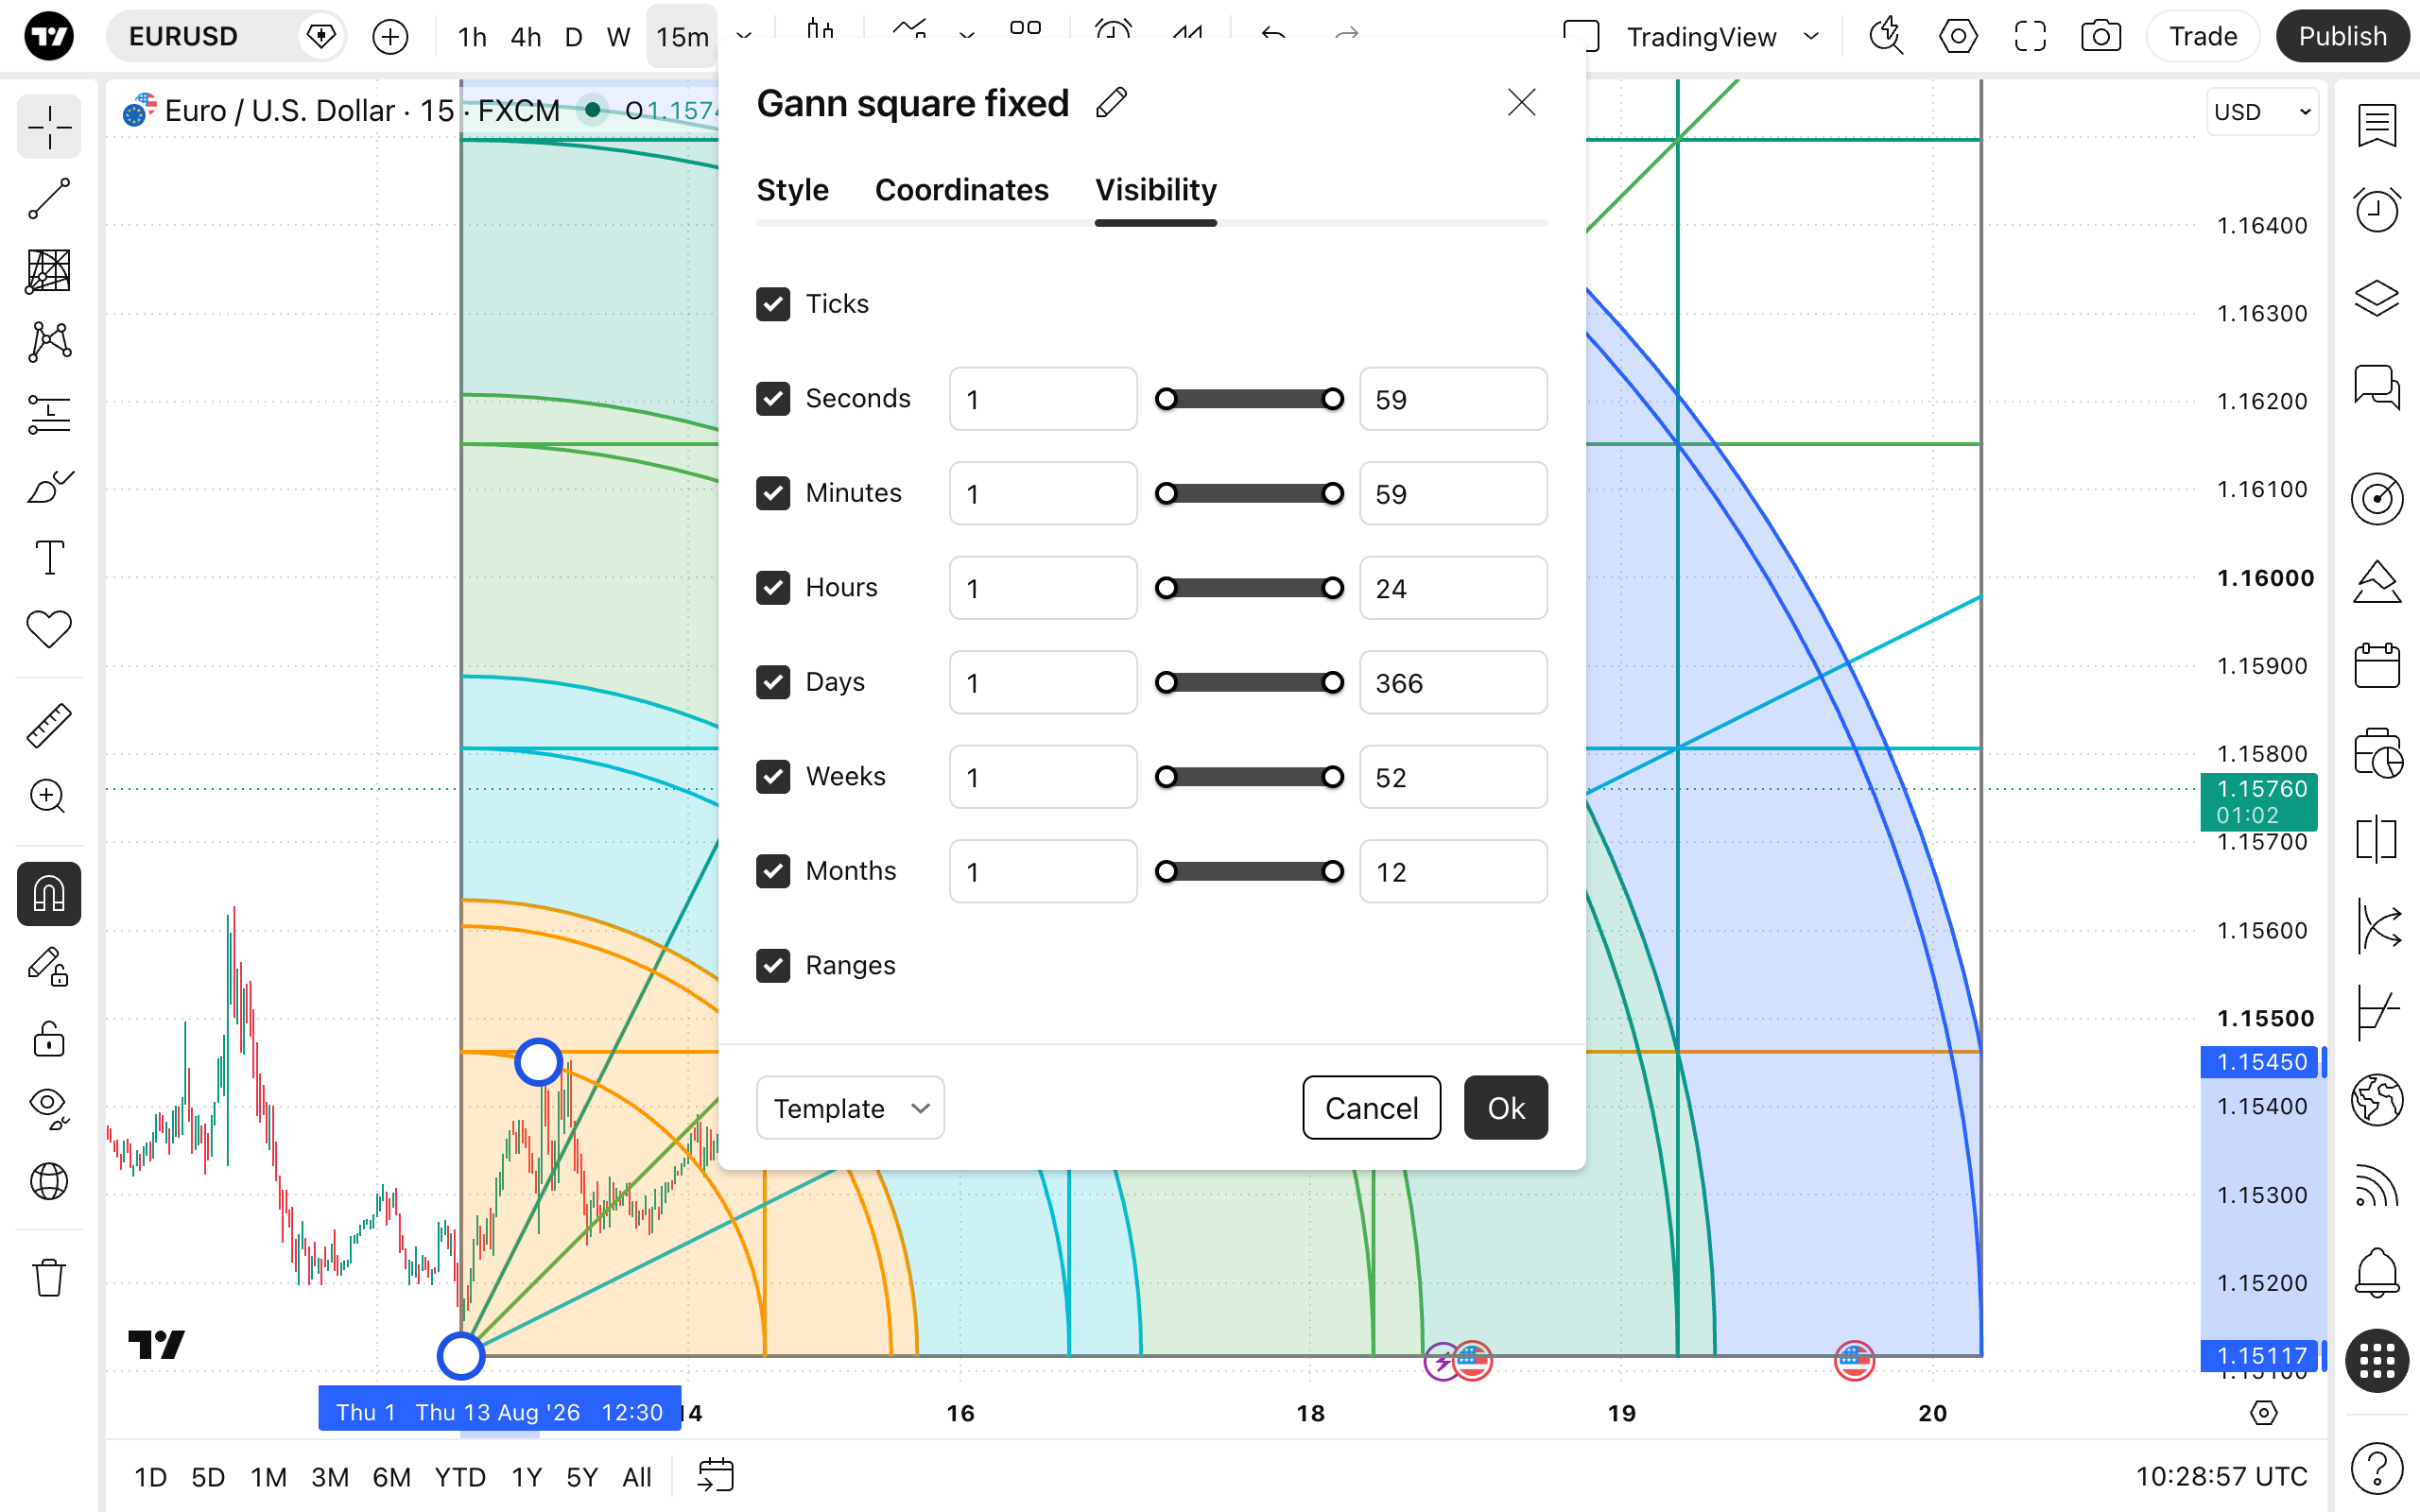
The Gann square fixed drawing tool is an advanced technical analysis instrument based on W.D. Gann's theories of time and price squaring. It combines a square grid (Levels), angled radiating lines (Fans), and curved lines (Arcs) to forecast potential support and resistance zones. Traders use this tool by anchoring it to significant market highs or lows, allowing the geometric intersections to highlight future price levels and time cycles of interest.
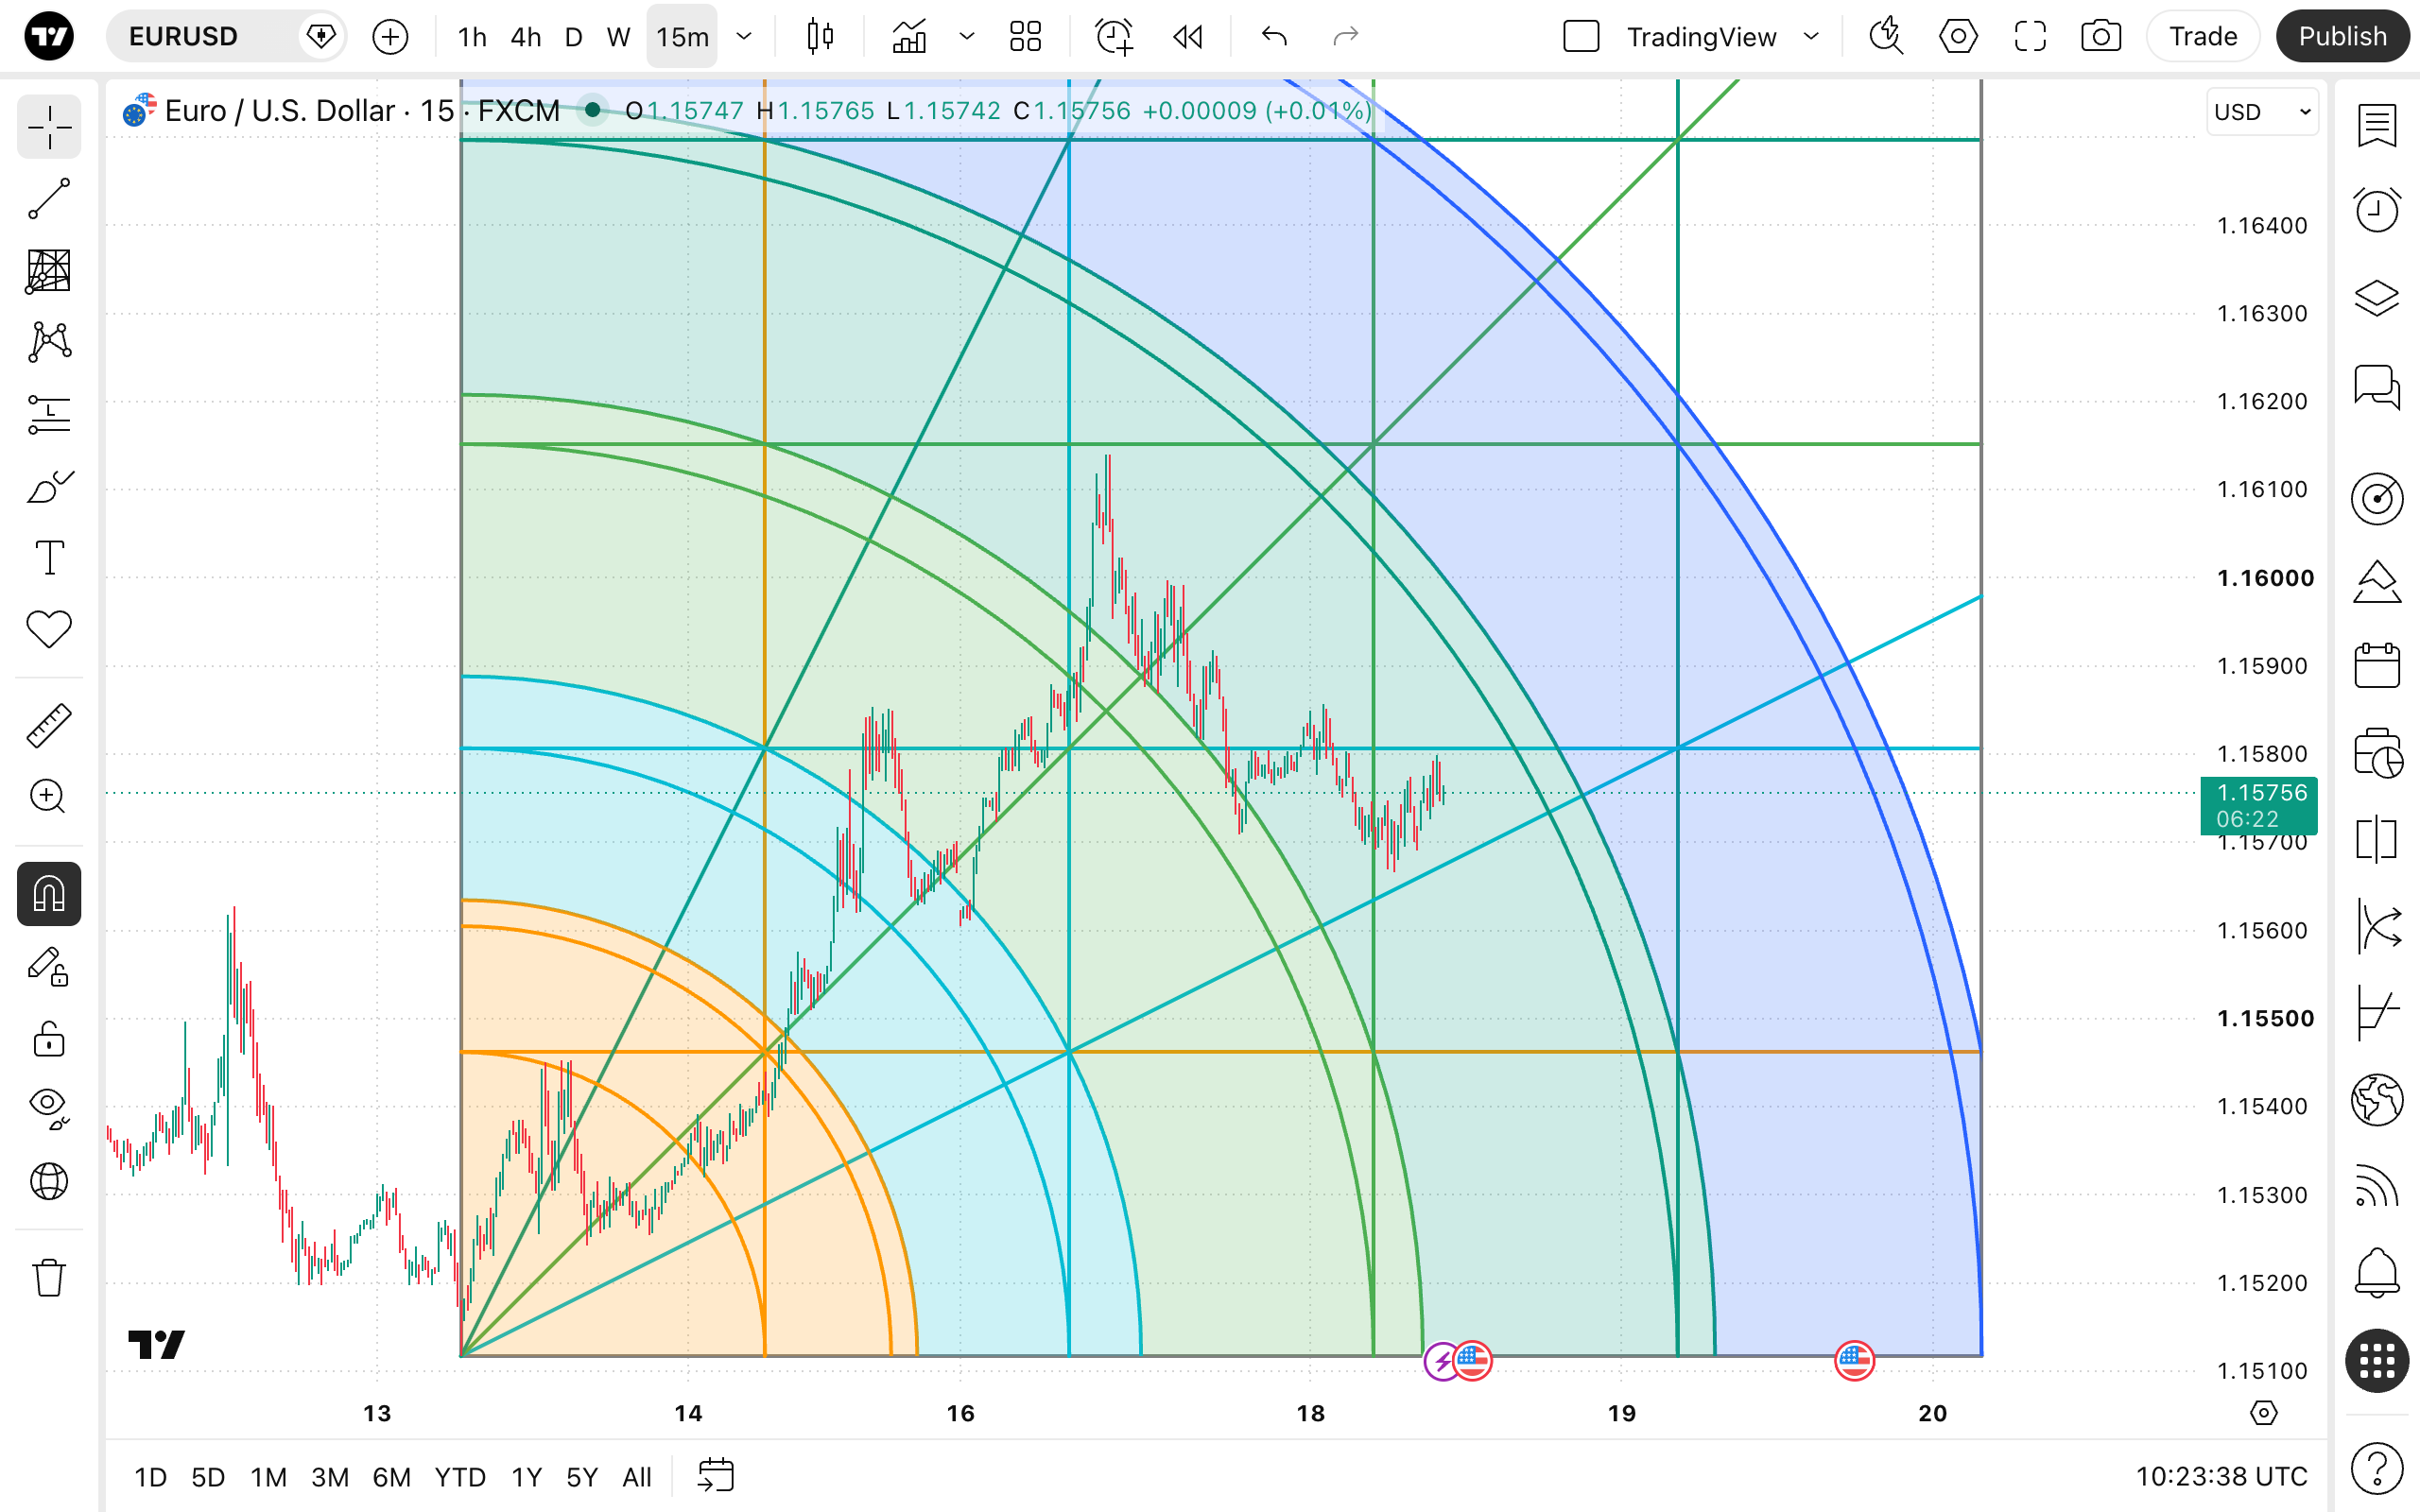
To draw a Gann square fixed on your chart, select the tool from the drawing panel. Click once to set the initial starting point (usually a major peak or trough), and click a second time to establish the size and orientation of the square.
Style
In the Style properties dialog, it is possible to change the visual appearance and configuration of the Gann square fixed tool.
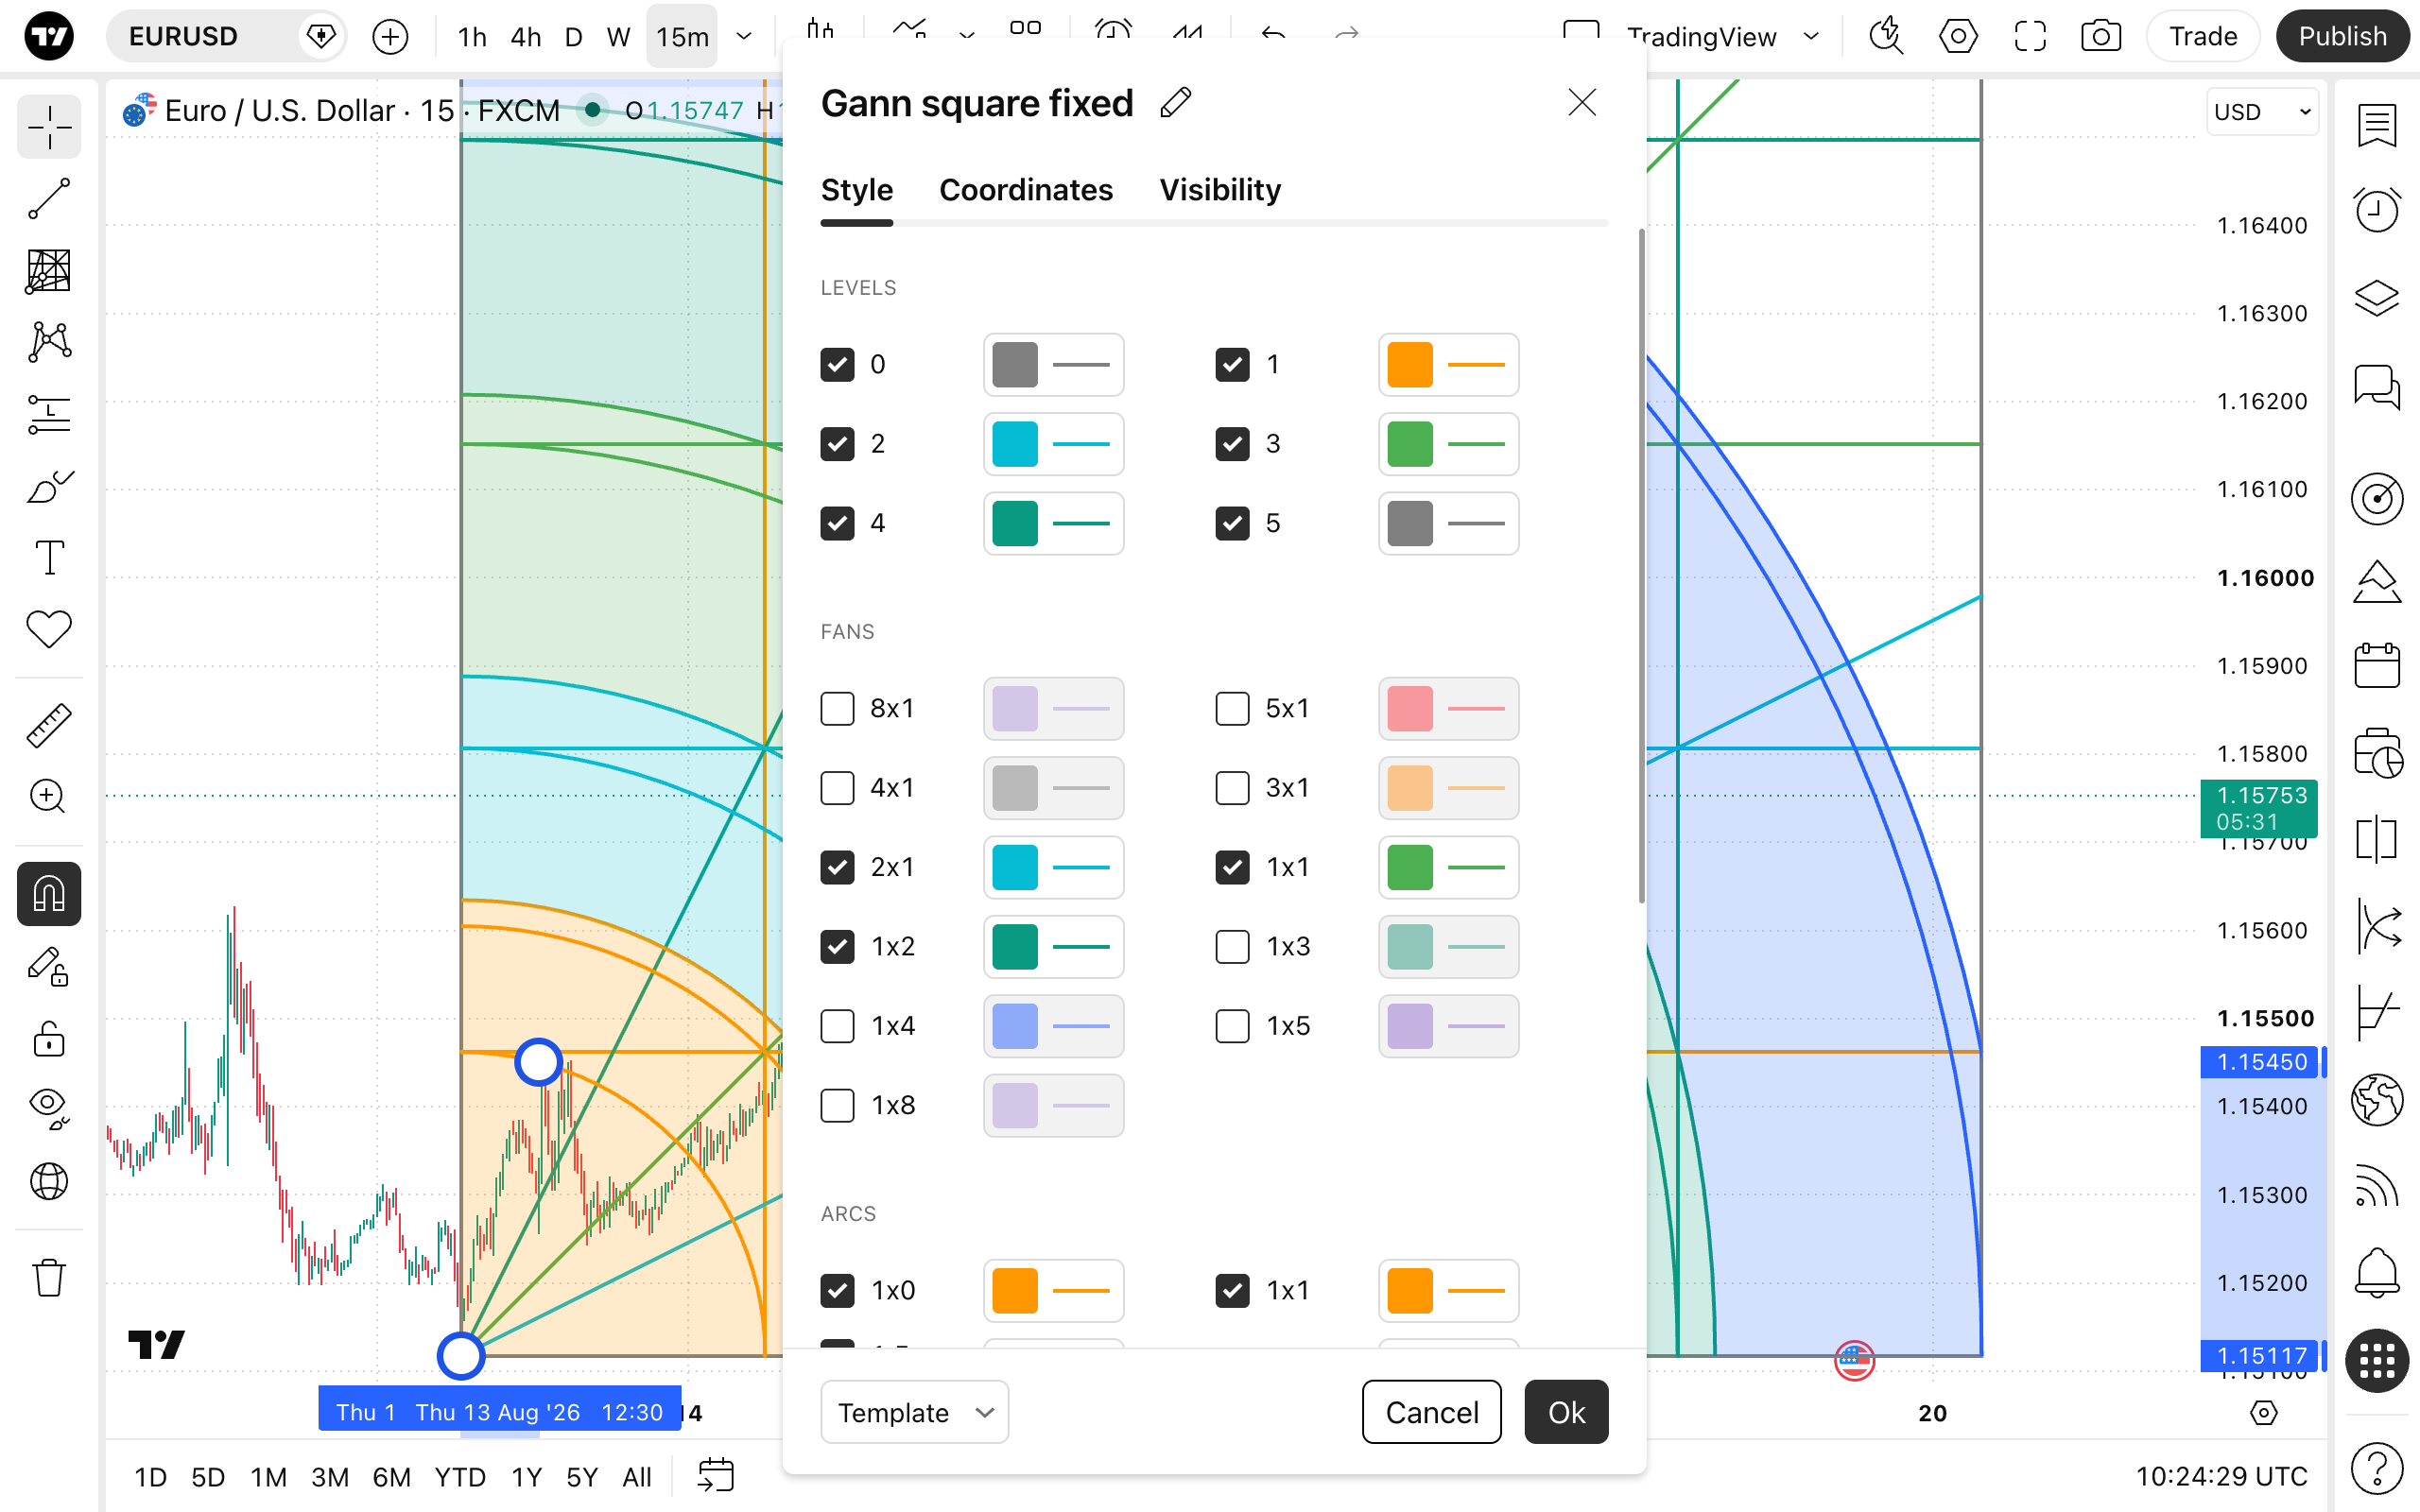
- Levels: A series of checkboxes that toggle the visibility of the square's grid lines (labeled 0 through 5). You can independently change the color and thickness for each level.
- Fans: Checkboxes that allow you to toggle the visibility of specific Gann fan angles (e.g., 8x1, 1x1, 1x2, etc.). The color and line thickness for each individual fan line can be customized here.
- Arcs: Checkboxes that toggle the visibility of the curved Gann arcs (e.g., 1x0, 1x1, 1.5x0, etc.). You can modify the color and line thickness for each active arc.
- Use one color: A convenient button that, when clicked, applies a single uniform color to all active levels, fans, and arcs within the tool.
- Background: Toggles the visibility of the shaded background fill within the square. You can use the adjacent slider to adjust the opacity level.
- Reverse: A checkbox that flips the entire drawing, reversing the direction and orientation of the square, fans, and arcs.
Coordinates
In the Coordinates properties dialog, you can set precisely the position of the tool's anchor points on the price scale (by setting the price) and the time axis (by setting the bar number).
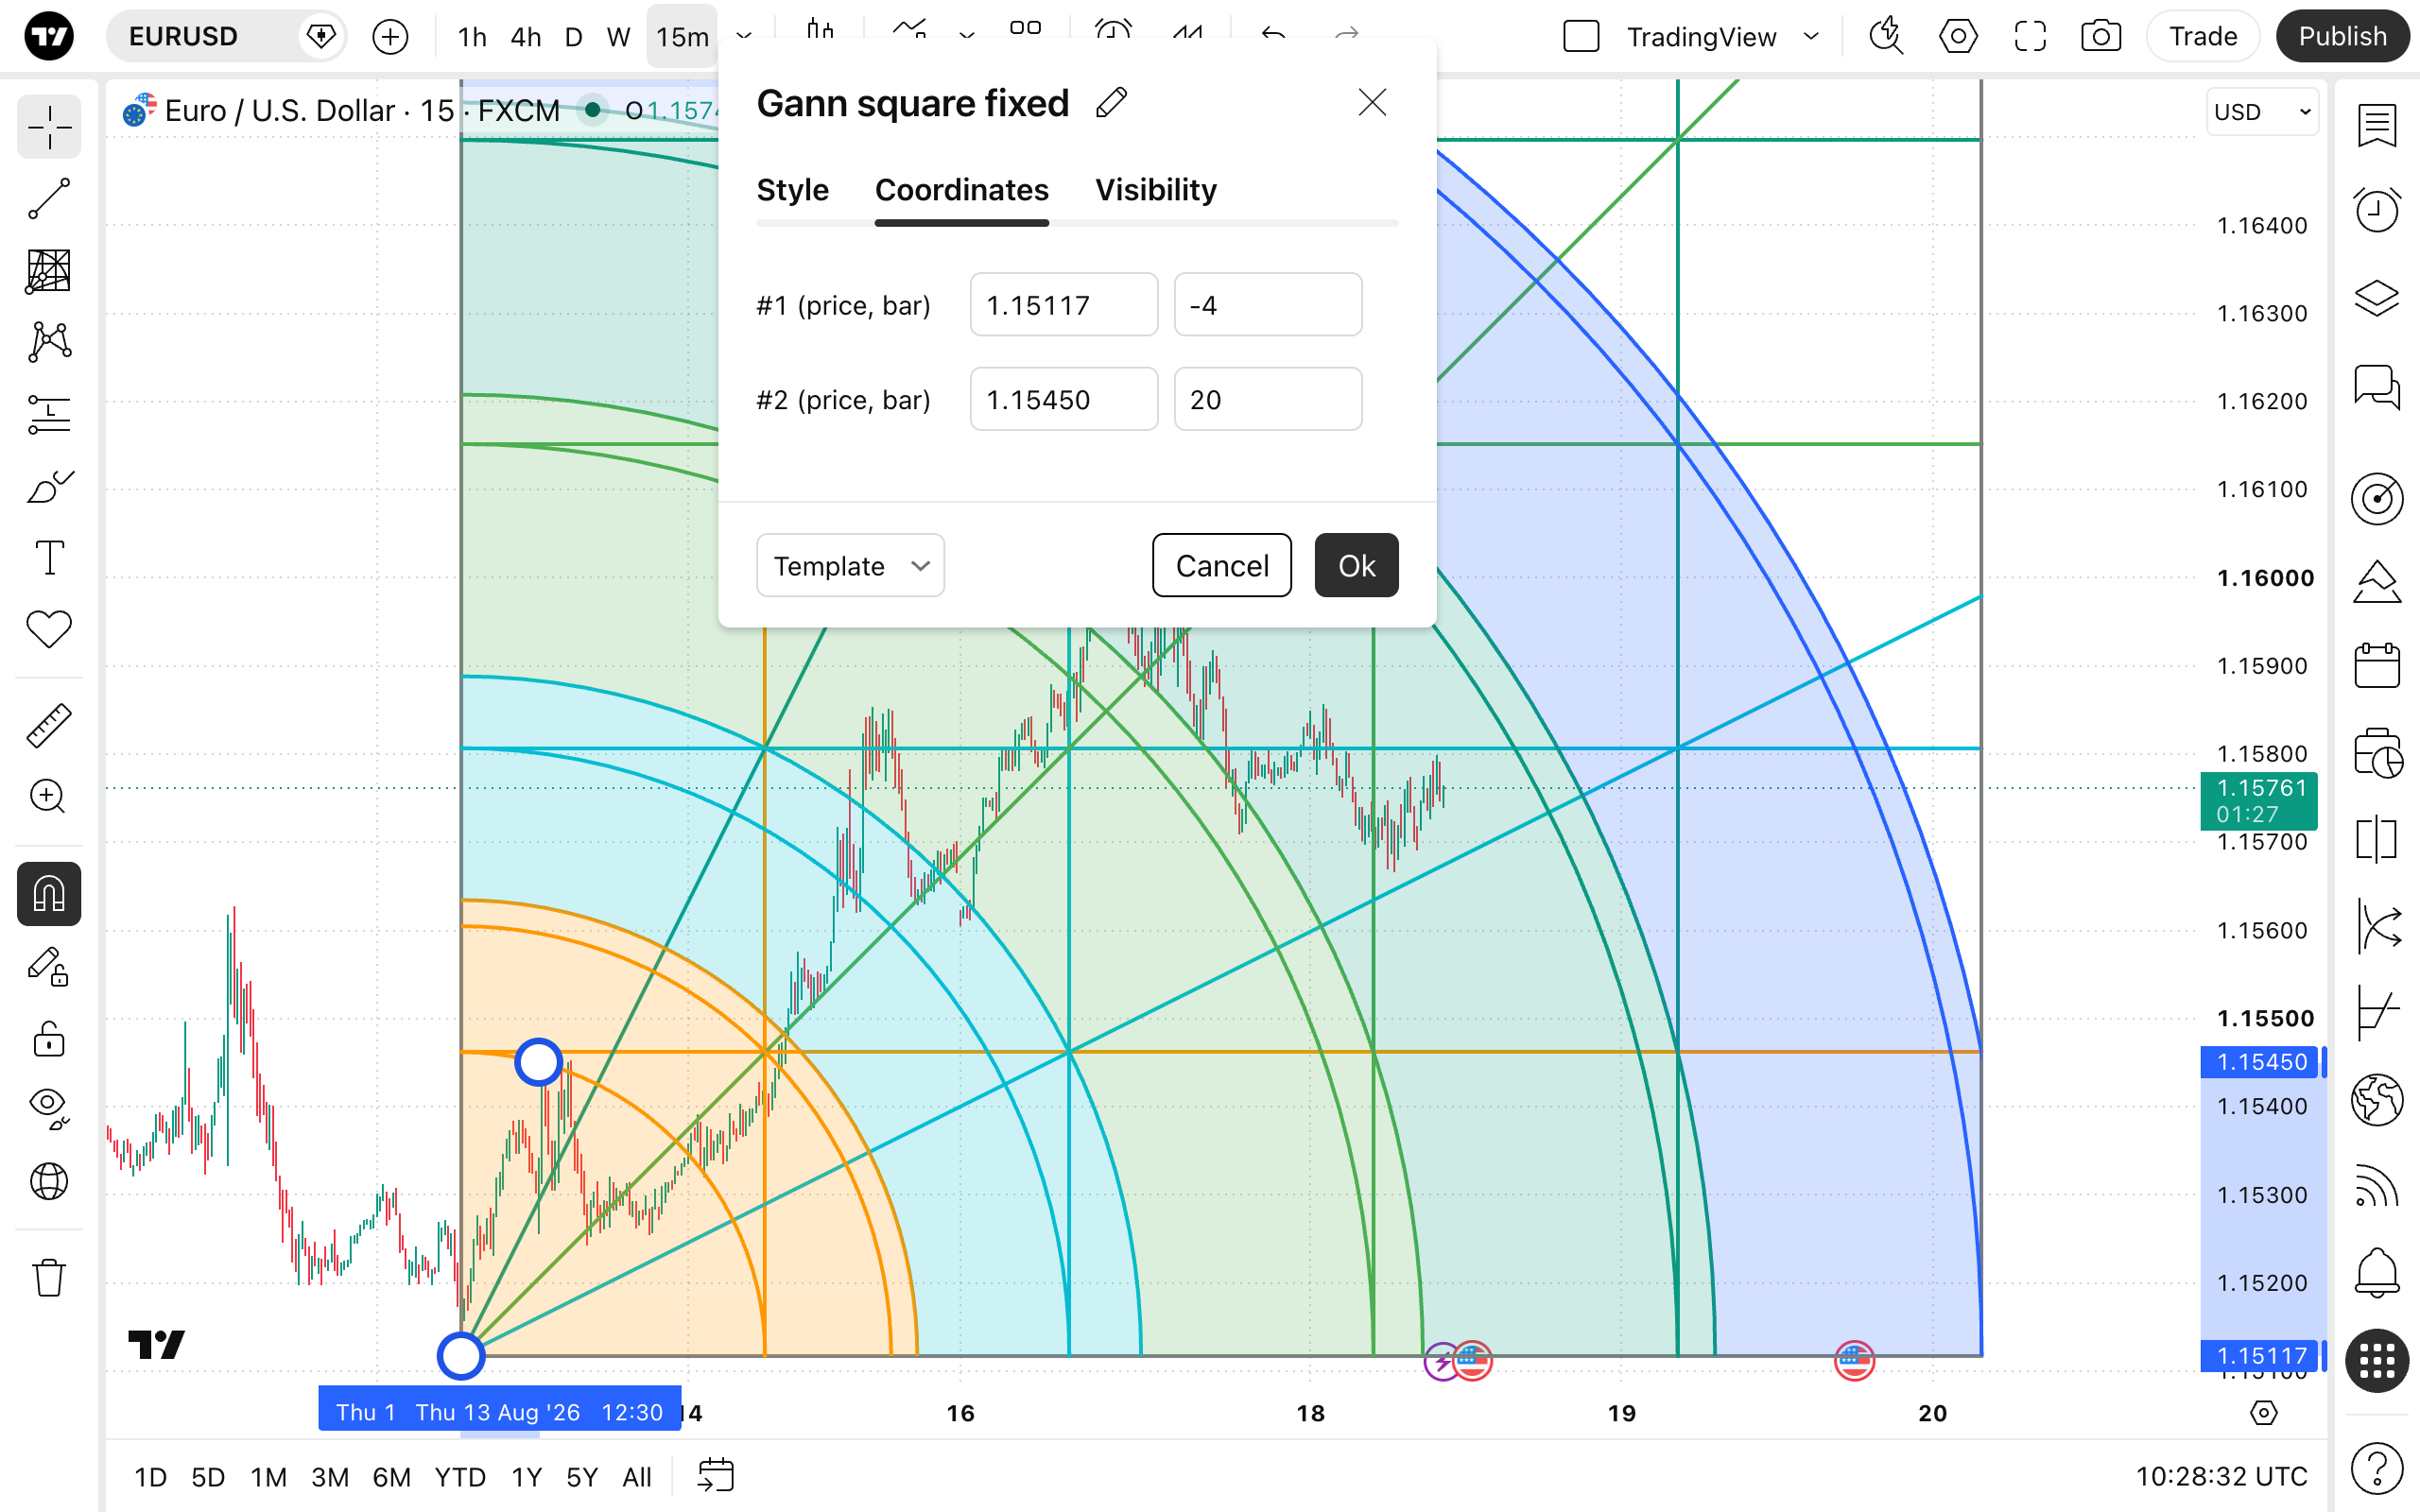
- Price 1: Allows for the precise placement of the tool's first point using a bar number and price.
- Price 2: Allows for the precise placement of the tool's second point, which establishes the scale of the square, using a bar number and price.
Visibility
In the Visibility properties dialog, you can switch the Gann square fixed tool displaying on charts of different chart intervals.