Sine line drawing tool
The Sine line drawing tool is a geometric instrument used by technical analysts to identify and project cyclical patterns in the market. Based on a mathematical sine wave, it helps traders visualize the rhythmic oscillation of prices between periodic peaks and troughs. By matching the wave's amplitude (height) and frequency (width) to historical price action, analysts use this tool to anticipate potential future turning points and market cycles.
To draw a Sine line on your chart, select the tool from the drawing panel. Click once on the chart to set the starting anchor point (often a significant market low or high). Next, drag your cursor to adjust the wave's cycle length and amplitude to align with the historical price movement, and click a second time to lock it in place. The continuous sine wave will then project forward across the chart.
Style
In the Style properties dialog, it is possible to change the visual appearance of the Sine line tool.
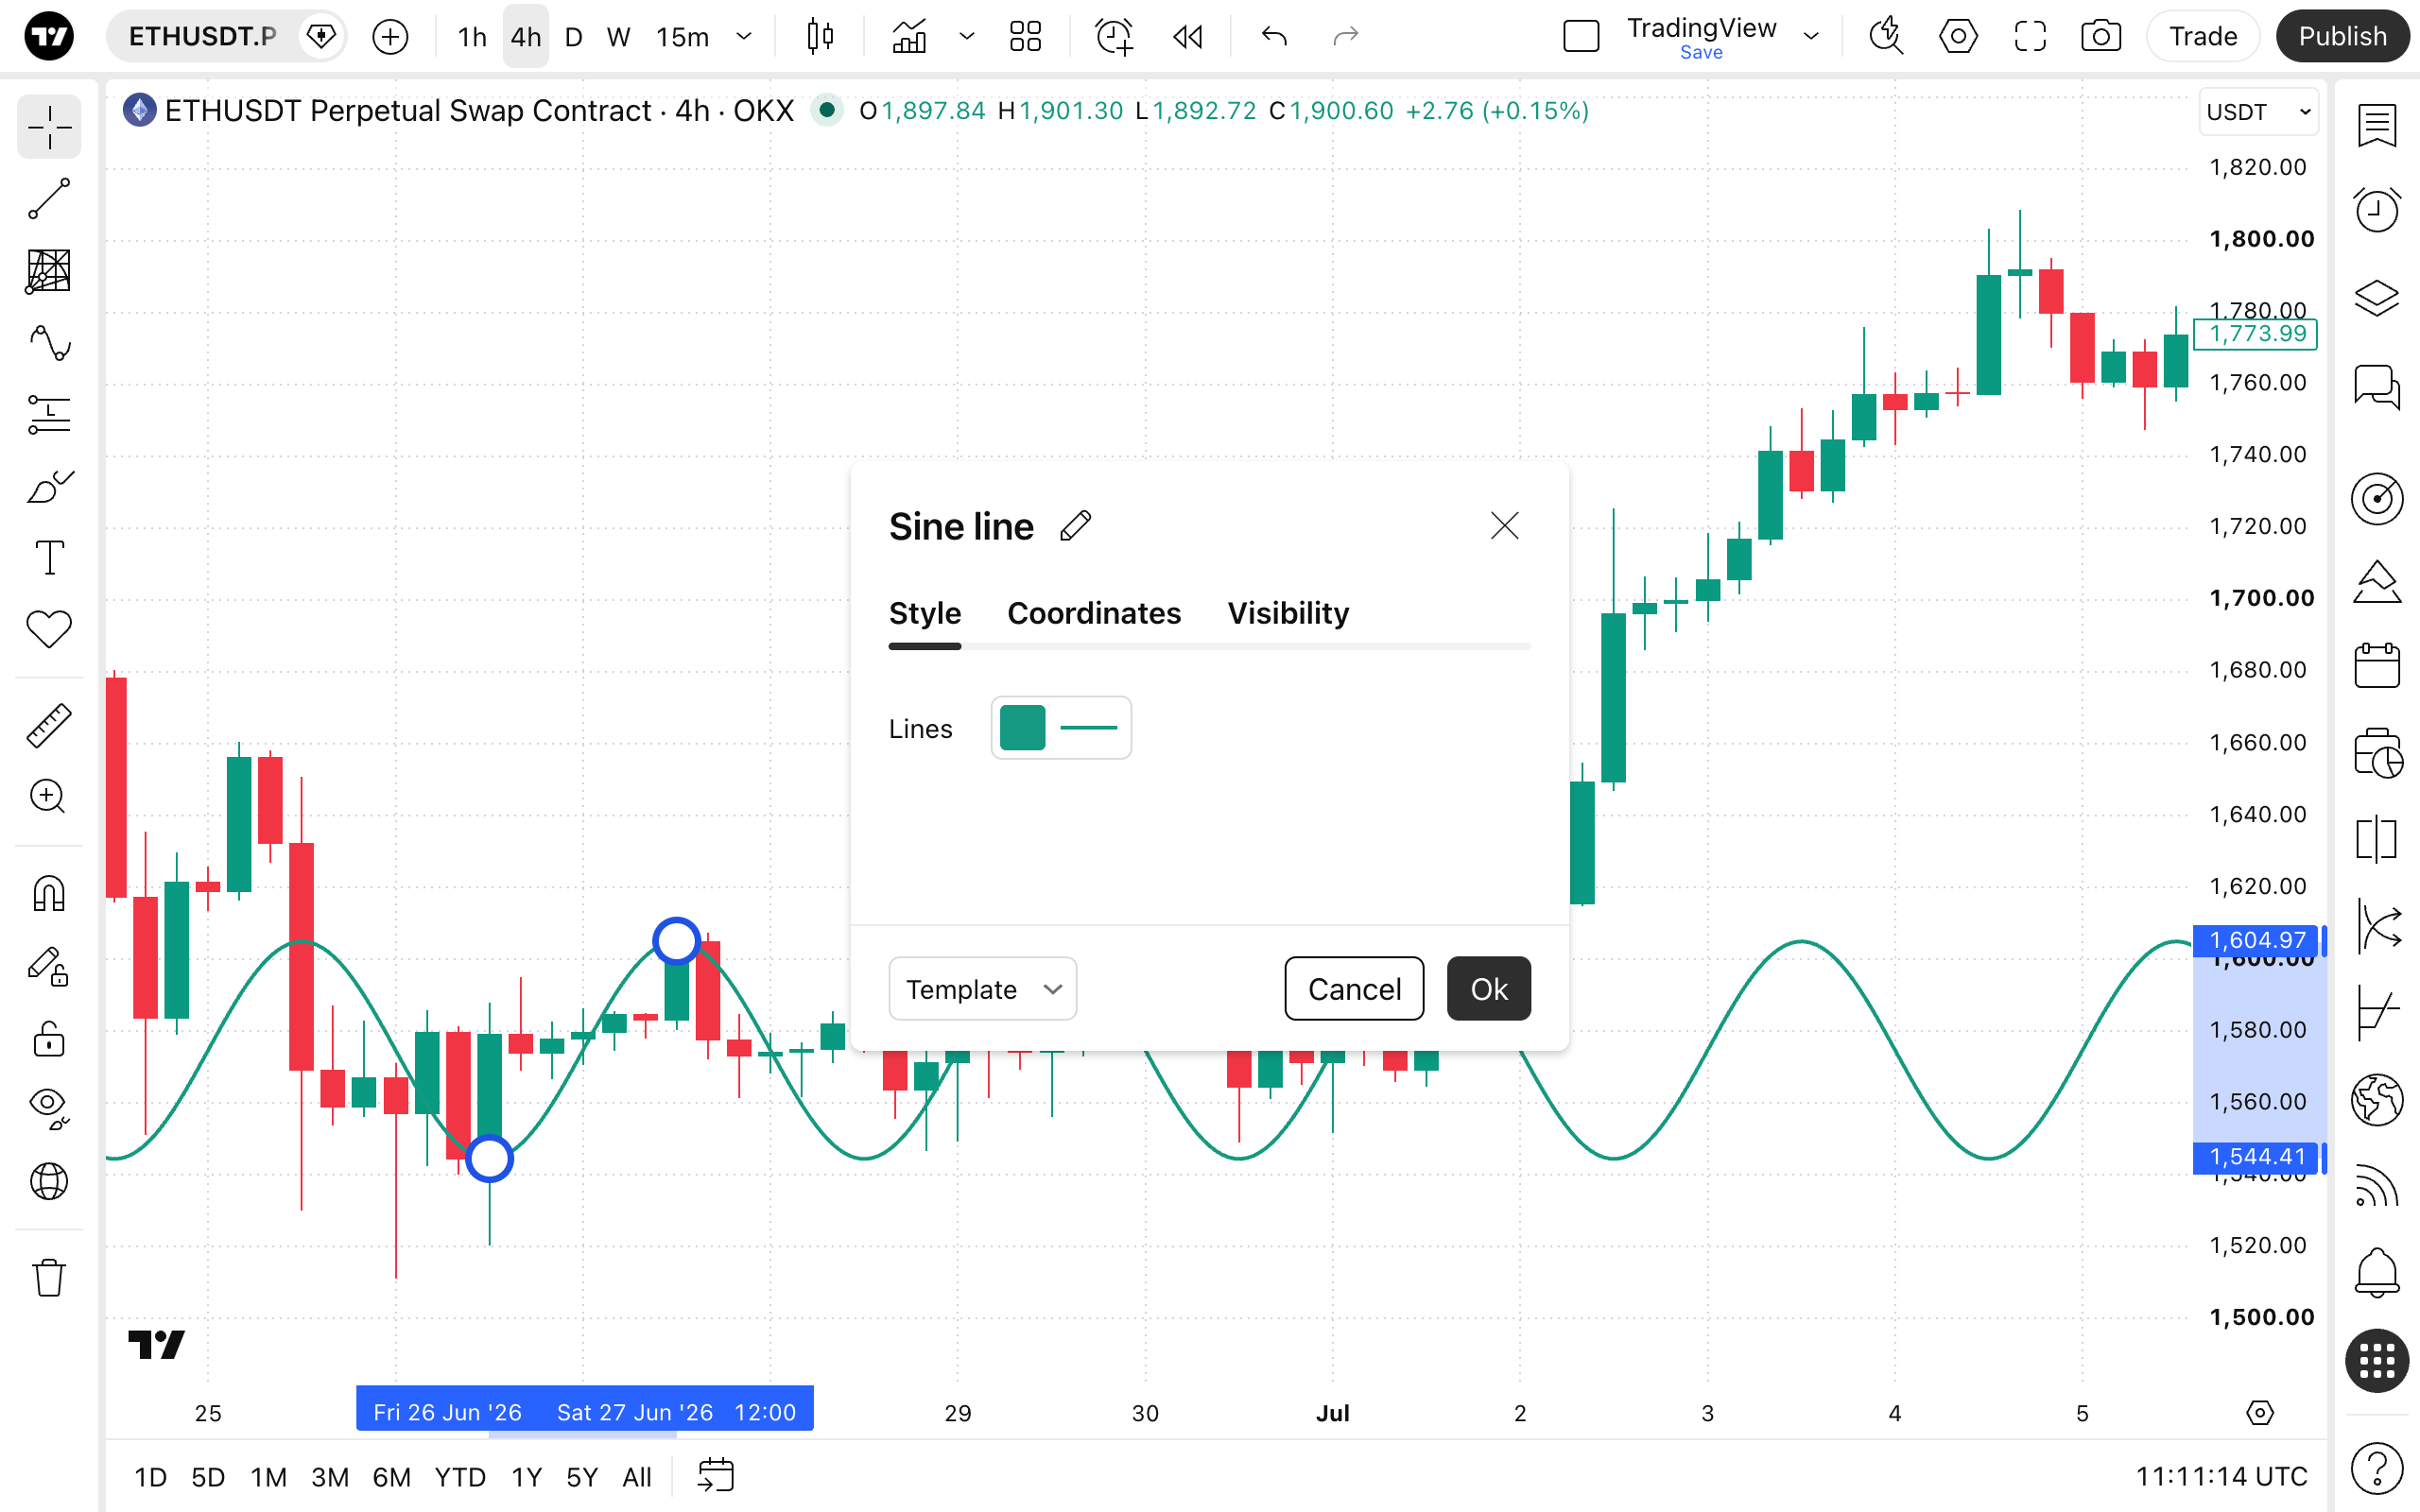
- Lines: Allows you to change the color, opacity, thickness, and line style (solid, dashed, or dotted) of the sine wave.
Coordinates
In the Coordinates properties dialog, you can set precisely the position of the tool's anchor points on the price scale (by setting the price) and the time axis (by setting the bar number).
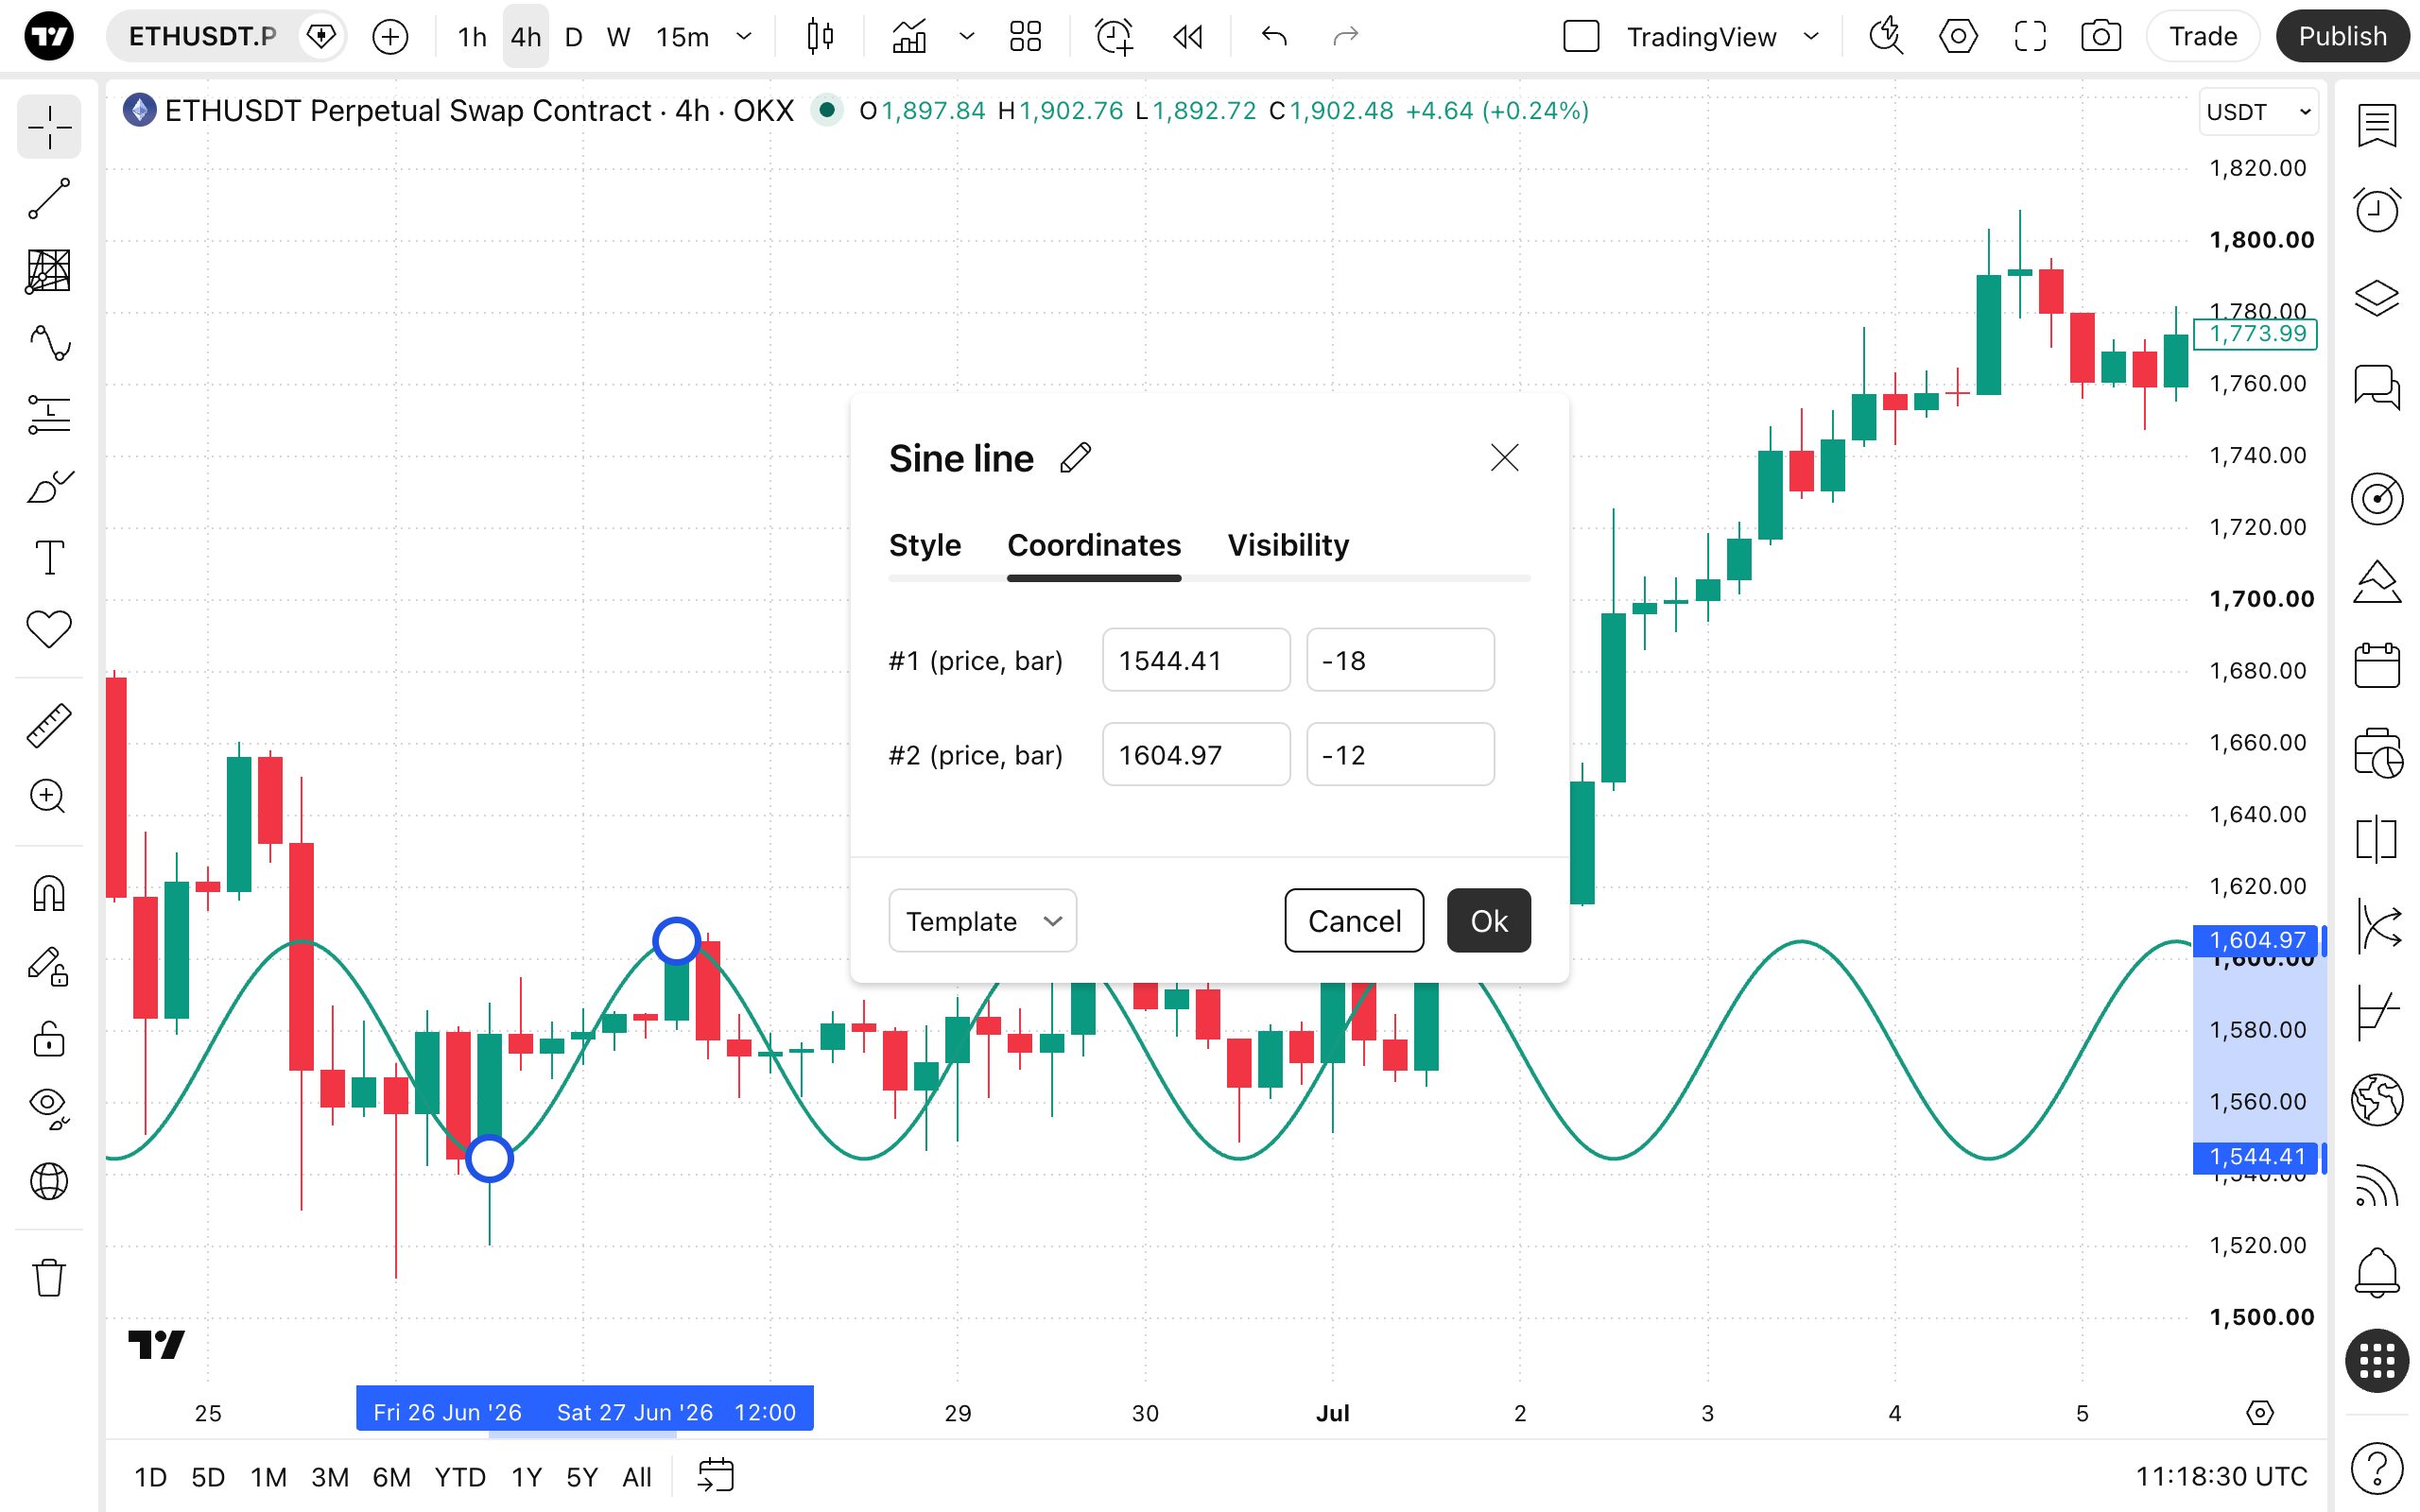
- Price 1: Allows for the precise placement of the wave's initial starting point using a bar number and price.
- Price 2: Allows for the precise placement of the wave's second anchor point, which defines the overall amplitude and frequency of the cycle, using a bar number and price.
Visibility
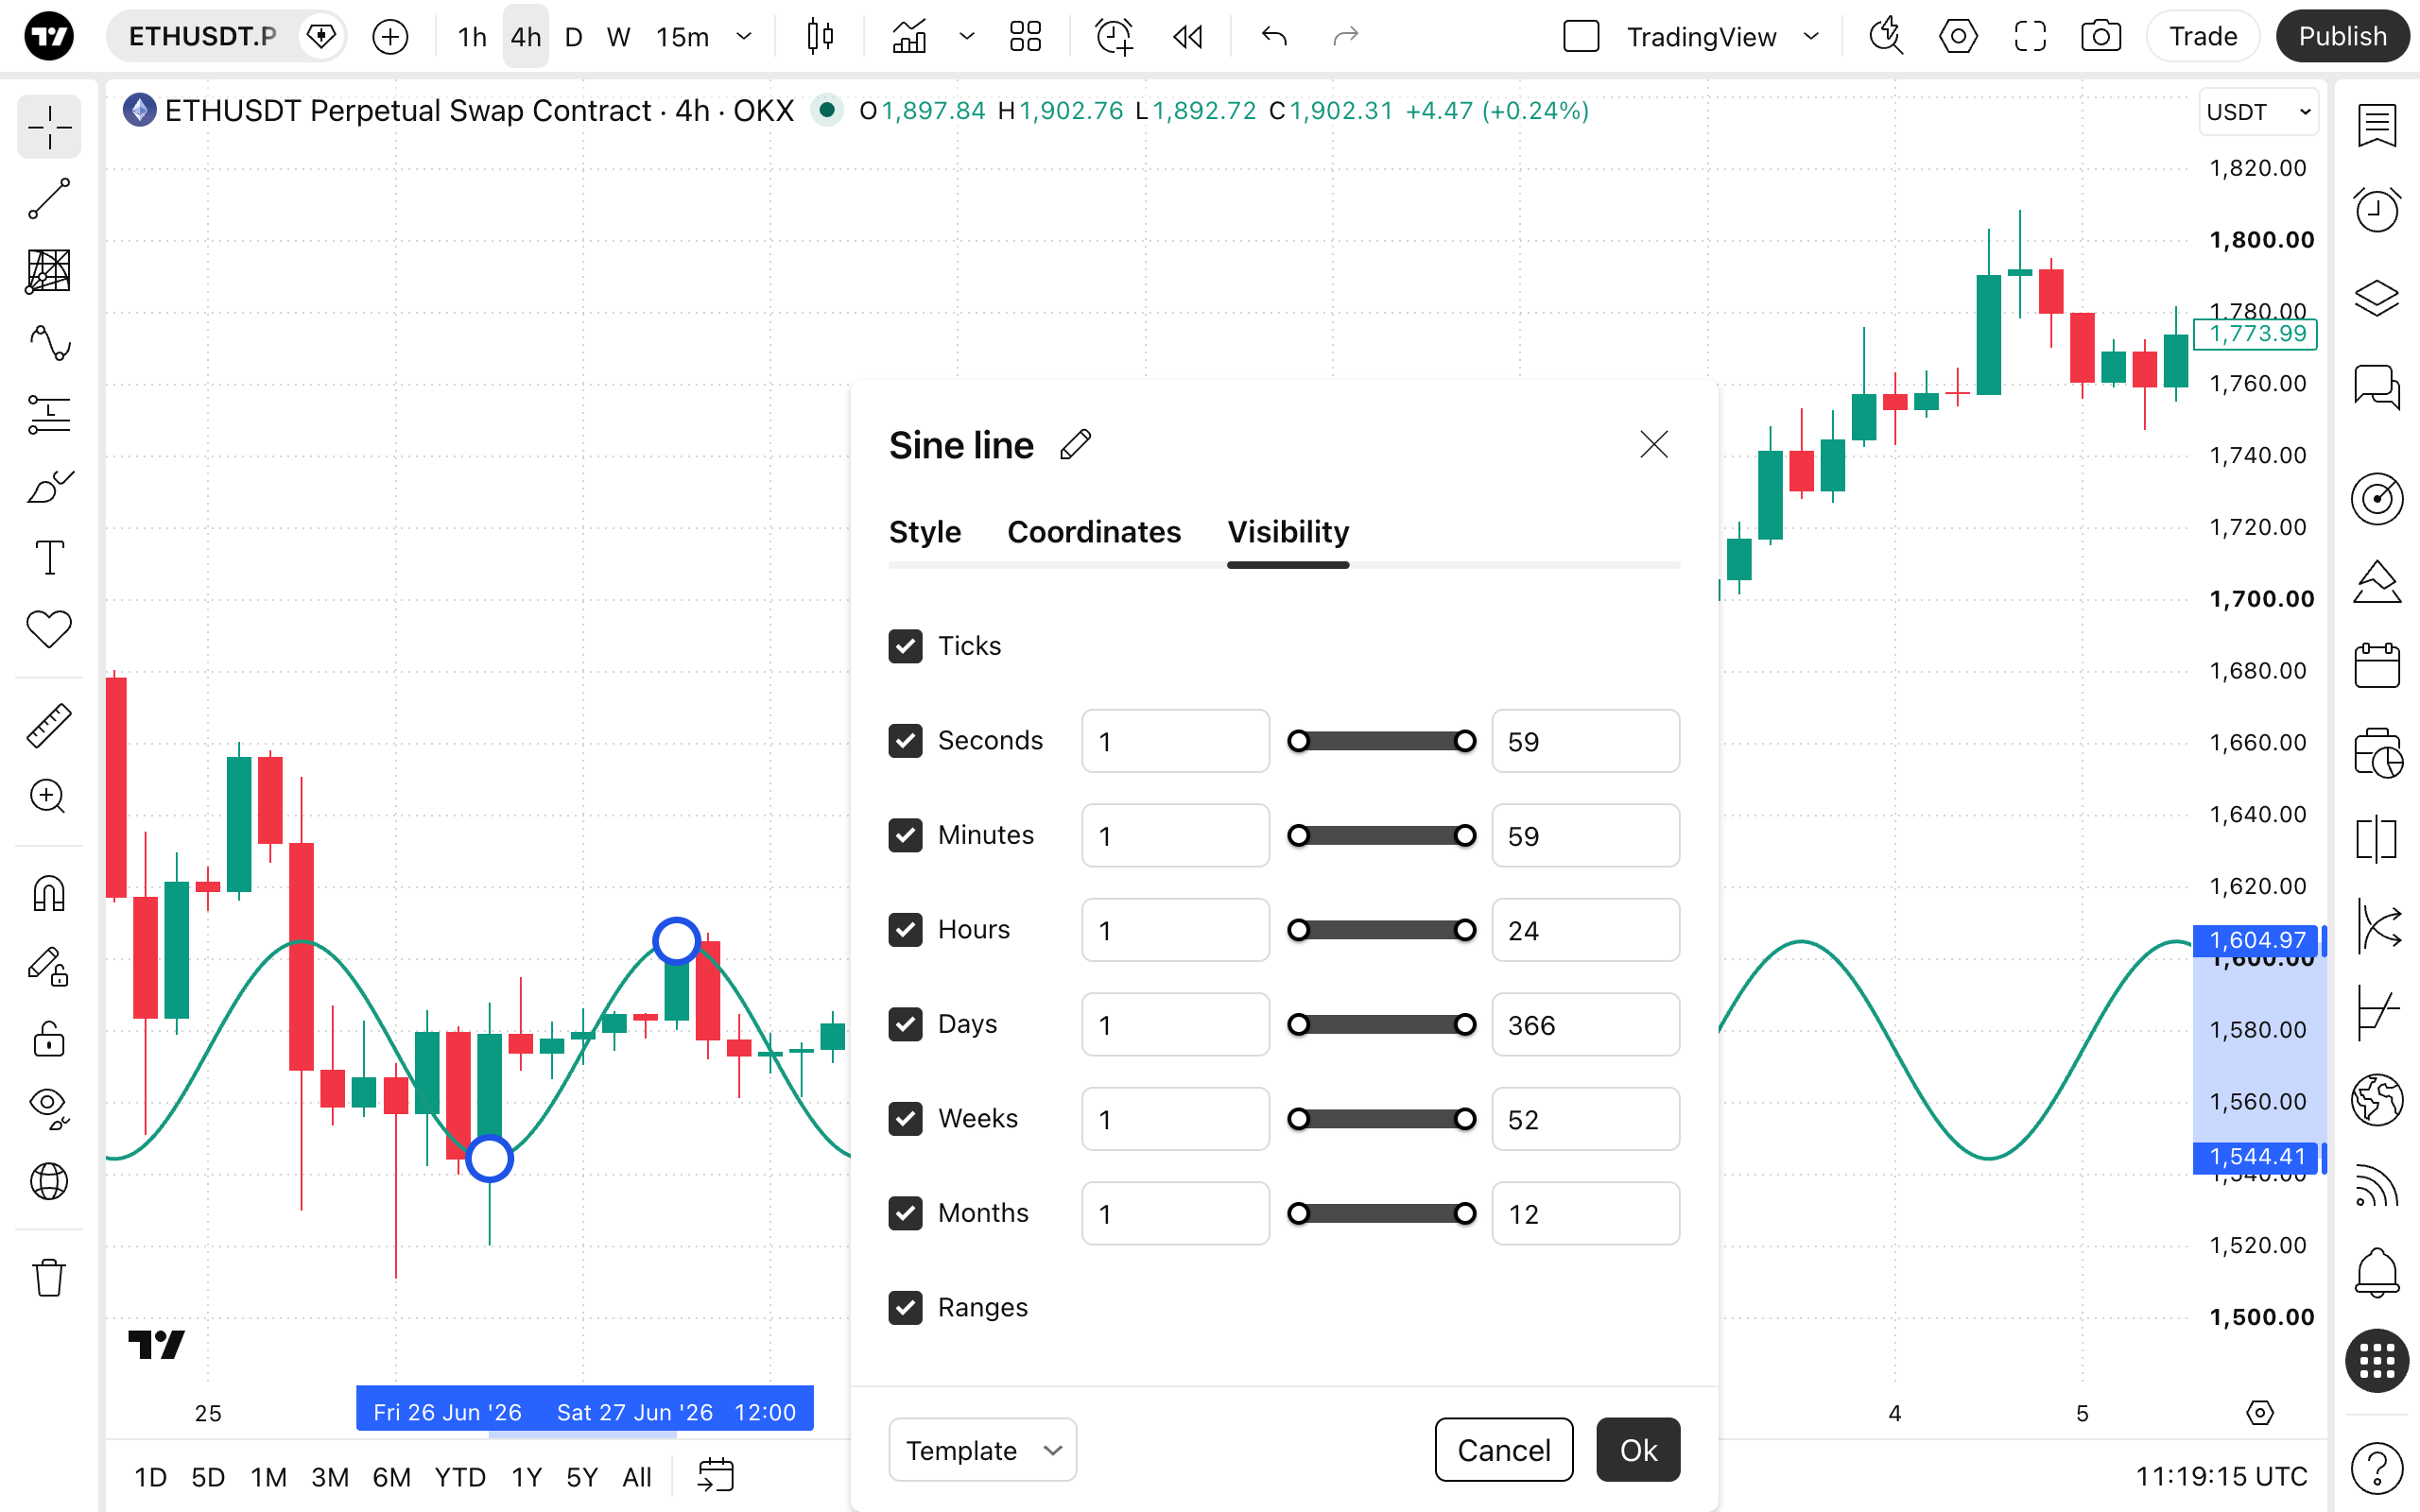
In the Visibility properties dialog, you can switch the Sine line tool displaying on charts of different chart intervals.