Rotated rectangle drawing tool
Application
The Rotated rectangle drawing tool allows users to highlight specific areas of the chart with a rectangular shape that can be tilted at any angle. Unlike the standard Rectangle tool, which is permanently fixed to the horizontal and vertical axes, the Rotated rectangle is perfect for identifying angled trend channels, consolidating price action within a trend, or highlighting specific diagonal chart patterns.
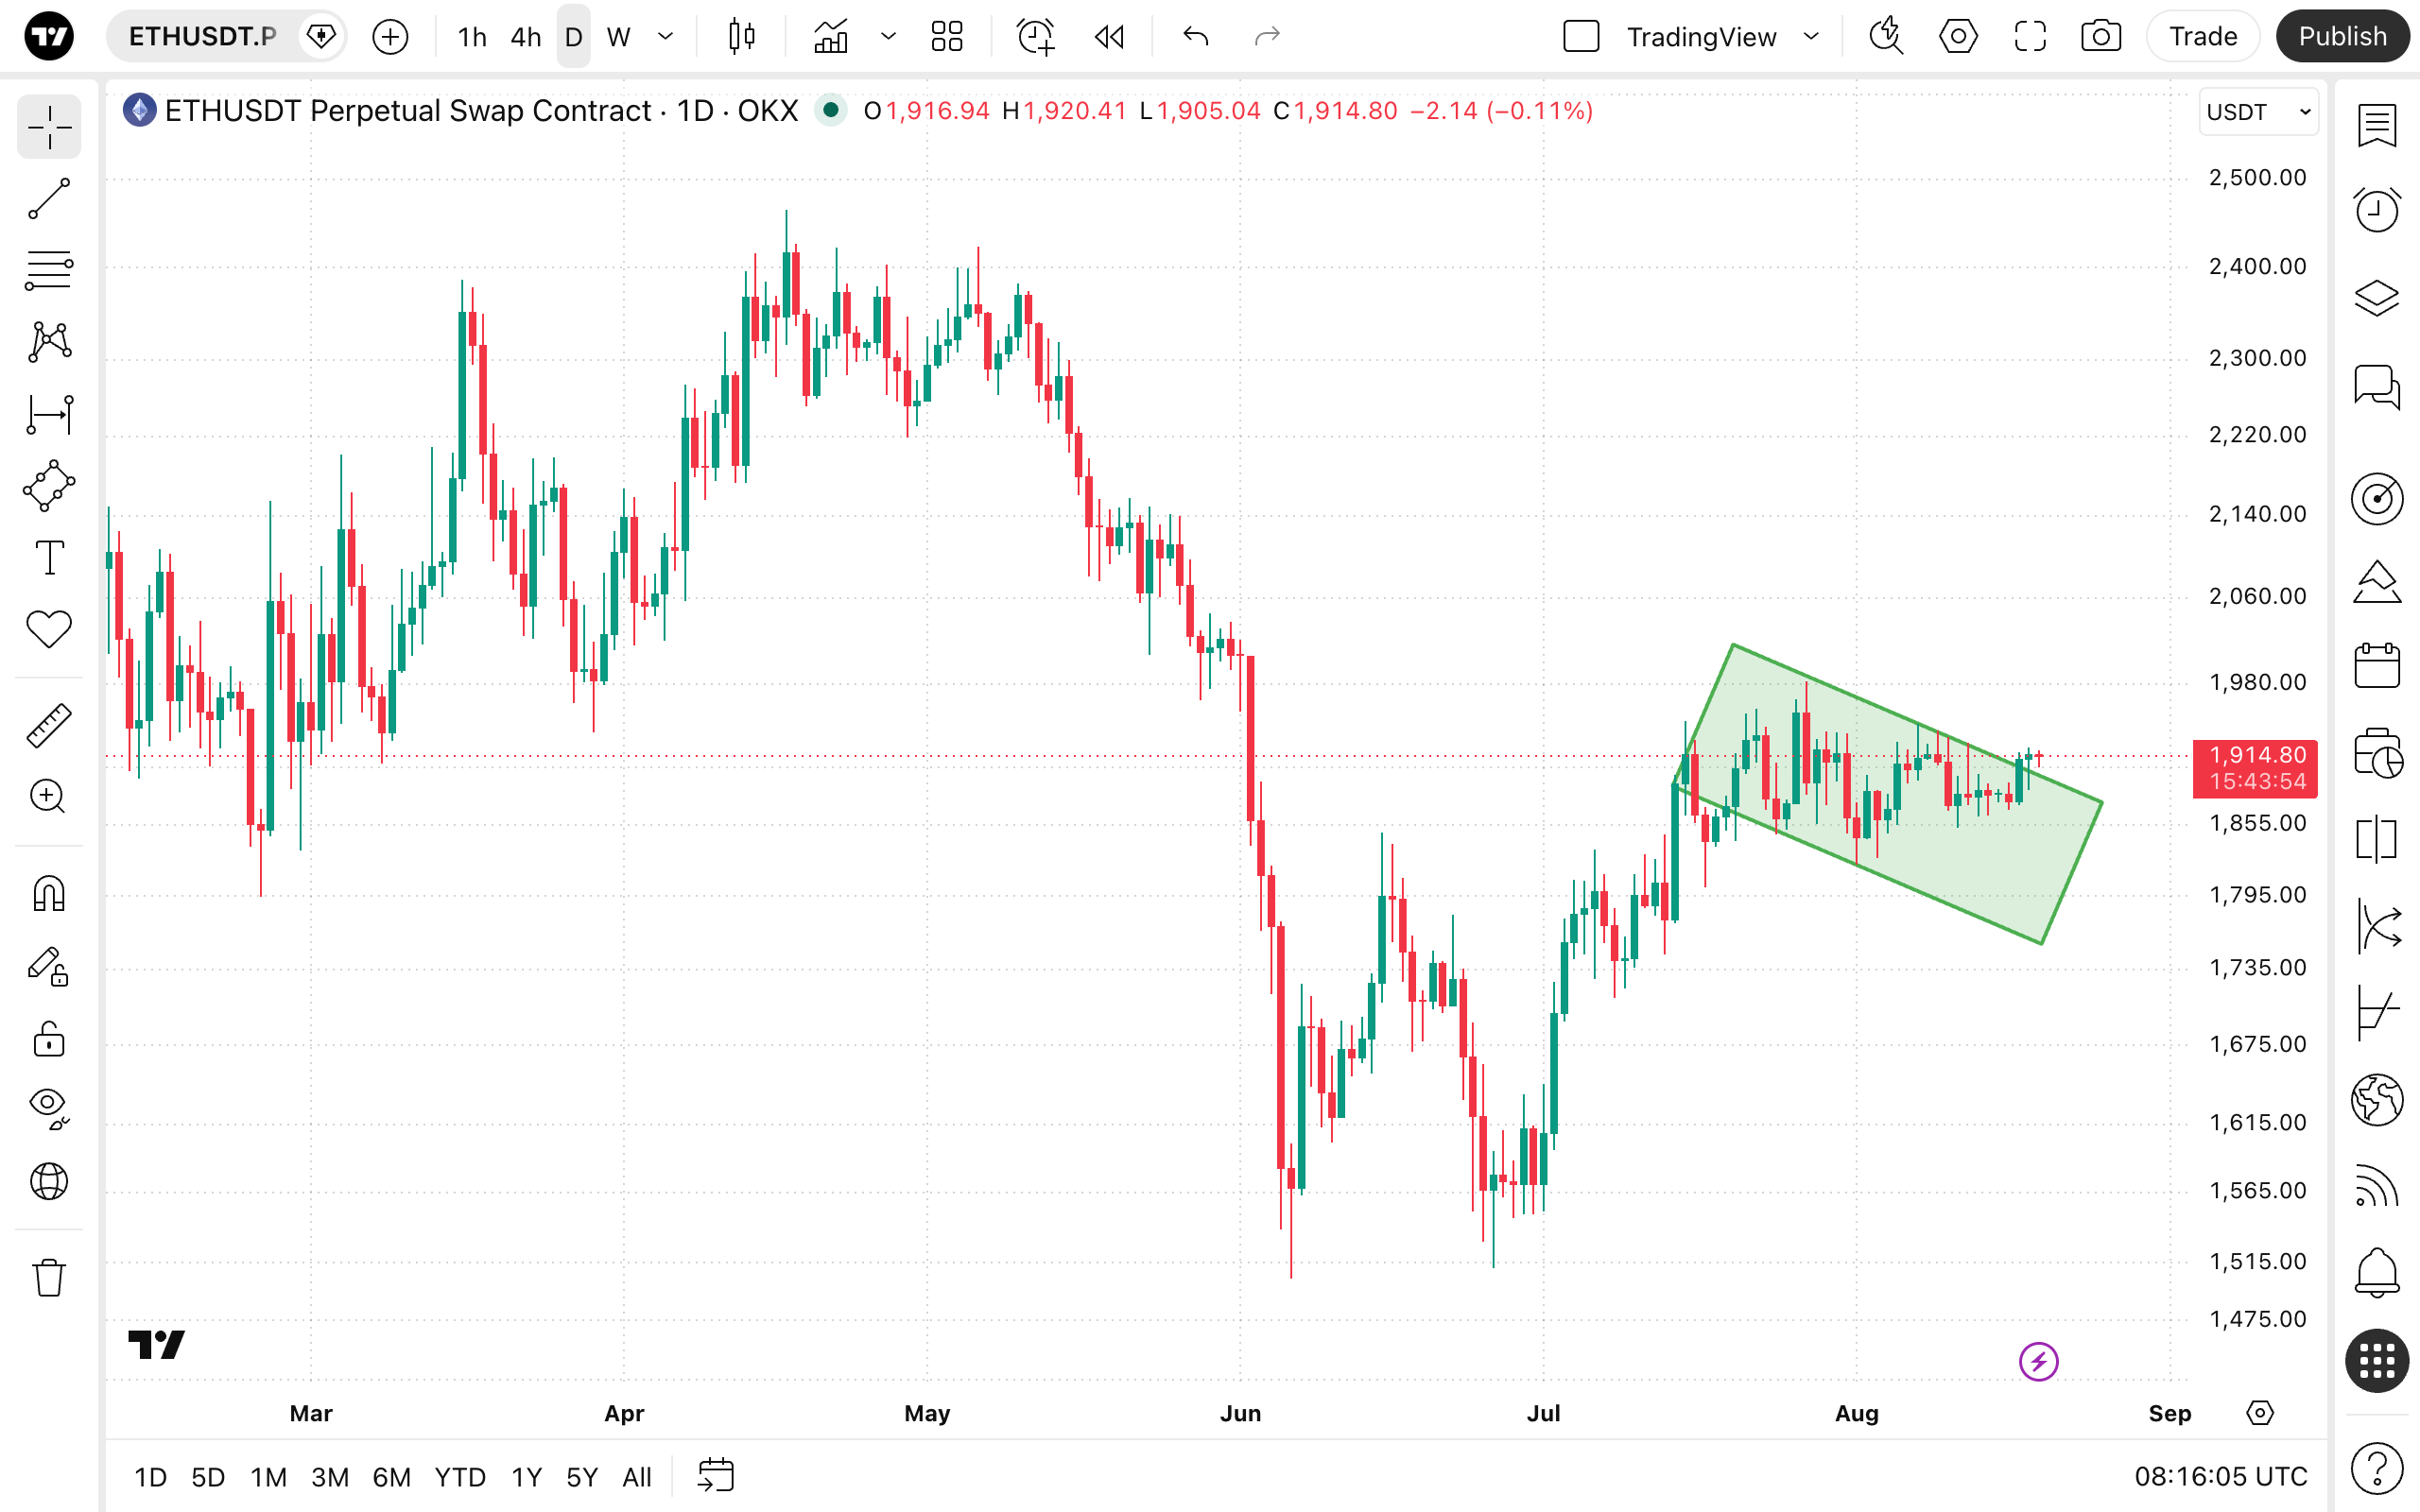
To draw a Rotated rectangle, select the tool from the drawing panel. Click on the chart to set the first corner, drag your cursor to establish the length and angle of the first edge, and click a second time. Then, drag your cursor perpendicular to that edge to define the width of the shape, and click a third time to lock the rectangle in place.
Style
In the Style properties dialog, it is possible to change the visual appearance of the Rotated rectangle tool:
- Border: Allows you to change the color, thickness, and style (solid, dashed, or dotted) of the rectangle's outline.
- Background: Toggles the visibility of the shaded background fill inside the rectangle. You can use the adjacent color picker to adjust its color and opacity level.
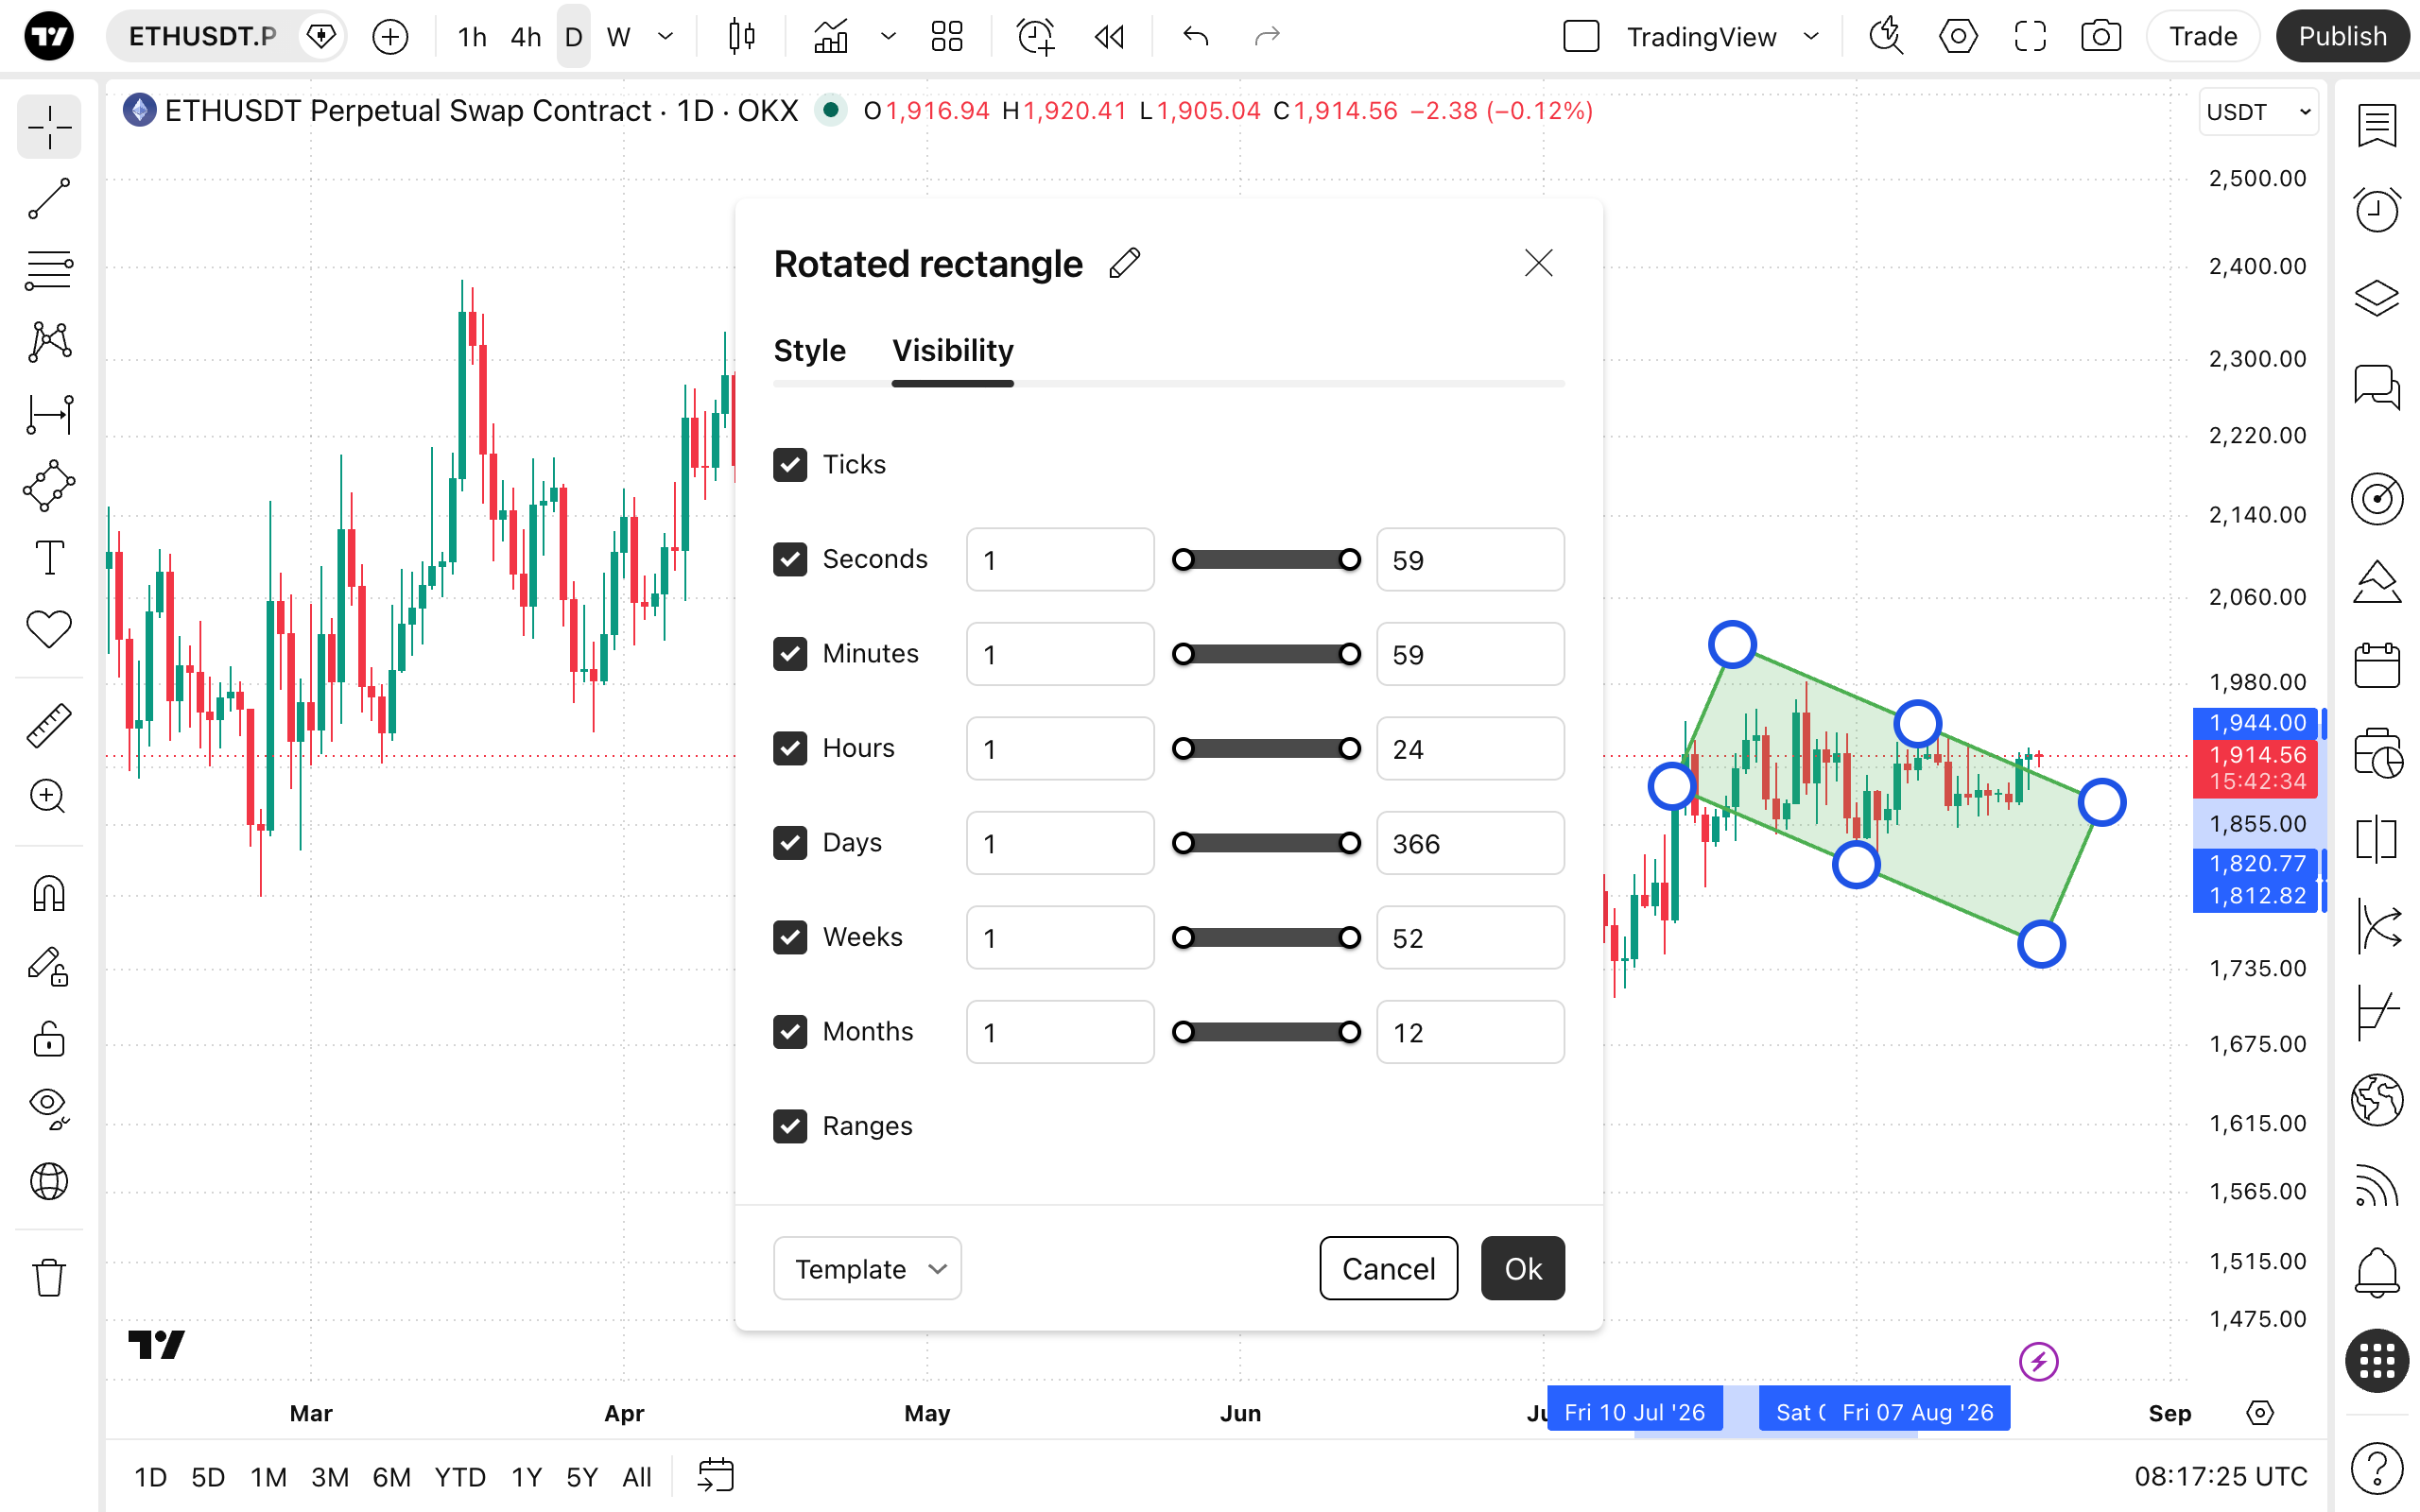
Visibility
In the Visibility properties dialog, you can switch the Rotated rectangle tool displaying on charts of different chart intervals.