Expected Move: see the market's projected price range on the chart
Expected Move is an options indicator on Supercharts that shows the price range the options market expects an underlying asset to trade within by a given expiration date. The range is calculated from the at-the-money (ATM) implied volatility of each option series and is drawn directly on the chart, so you can see the market's volatility expectations without an options calculator, an options chain, or manual math.
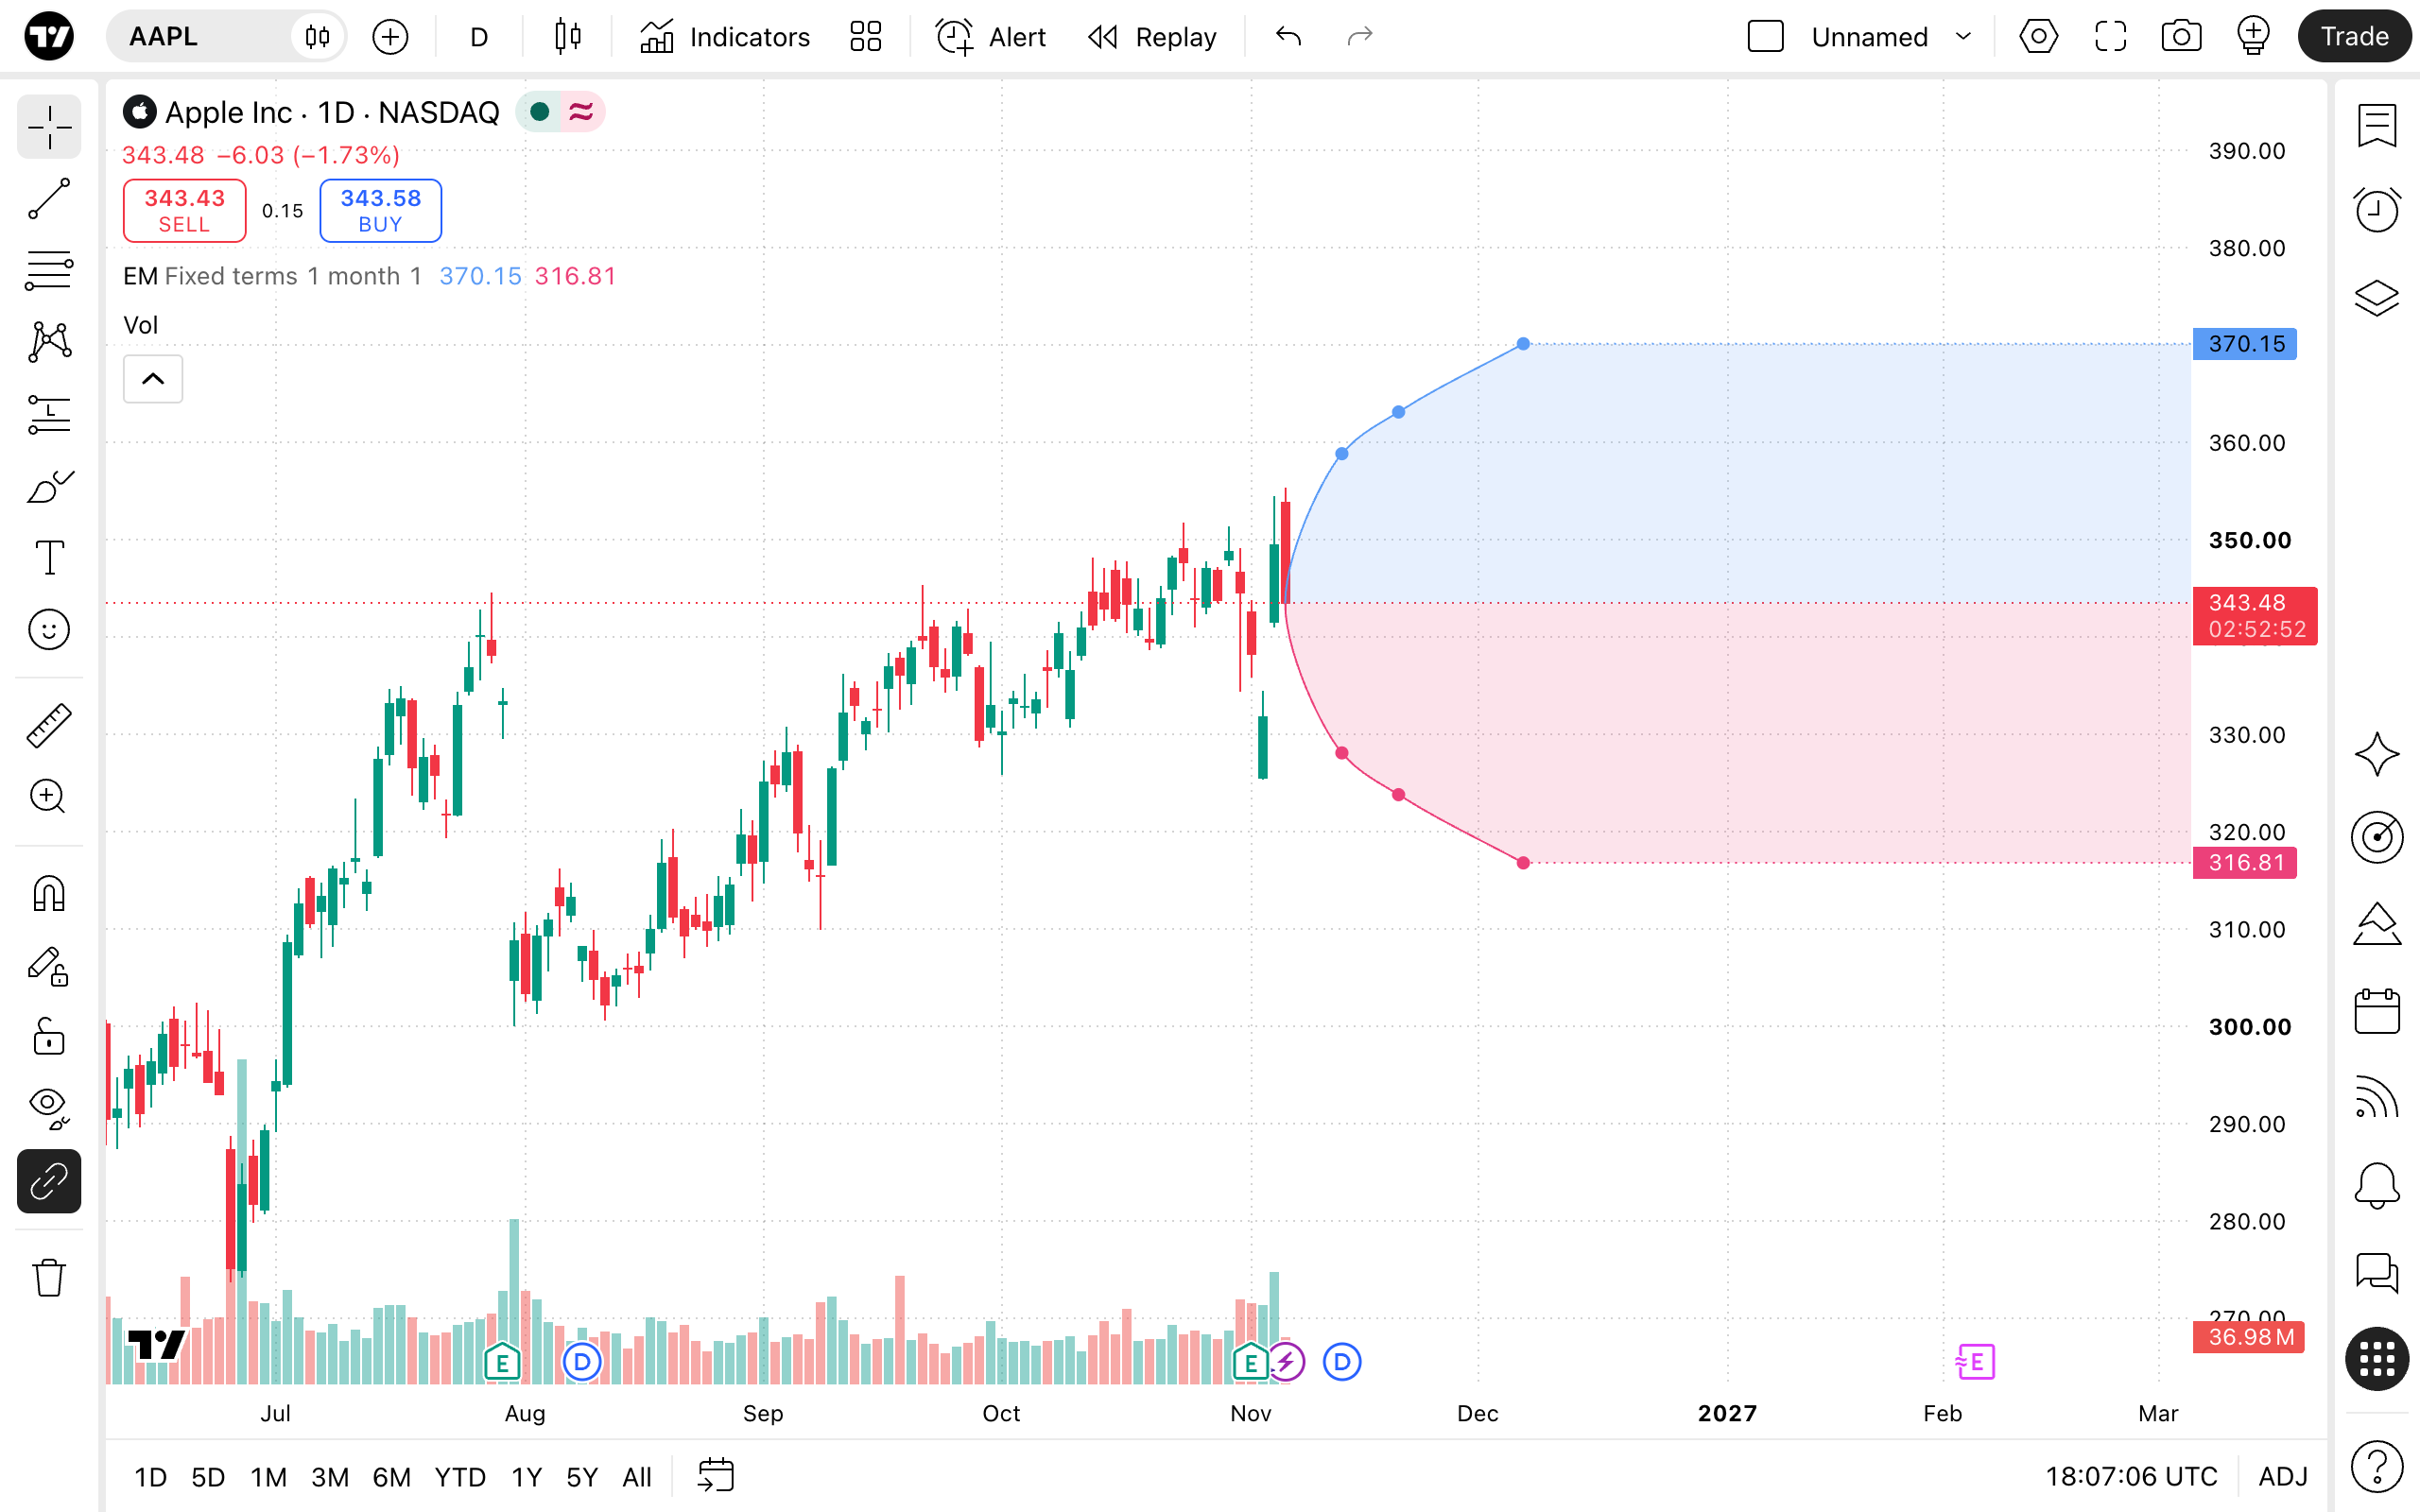
Suppose you follow Apple and want to know how far the options market expects AAPL to move over the next month. Expected Move plots an upper and a lower bound for every listed expiration within that period, forming a cone that widens over time.
How to add Expected Move to the chart
- Open a chart of a symbol that has listed options, for example, AAPL.
- Make sure the chart uses the 1 day, 1 week, or 1 month timeframe.
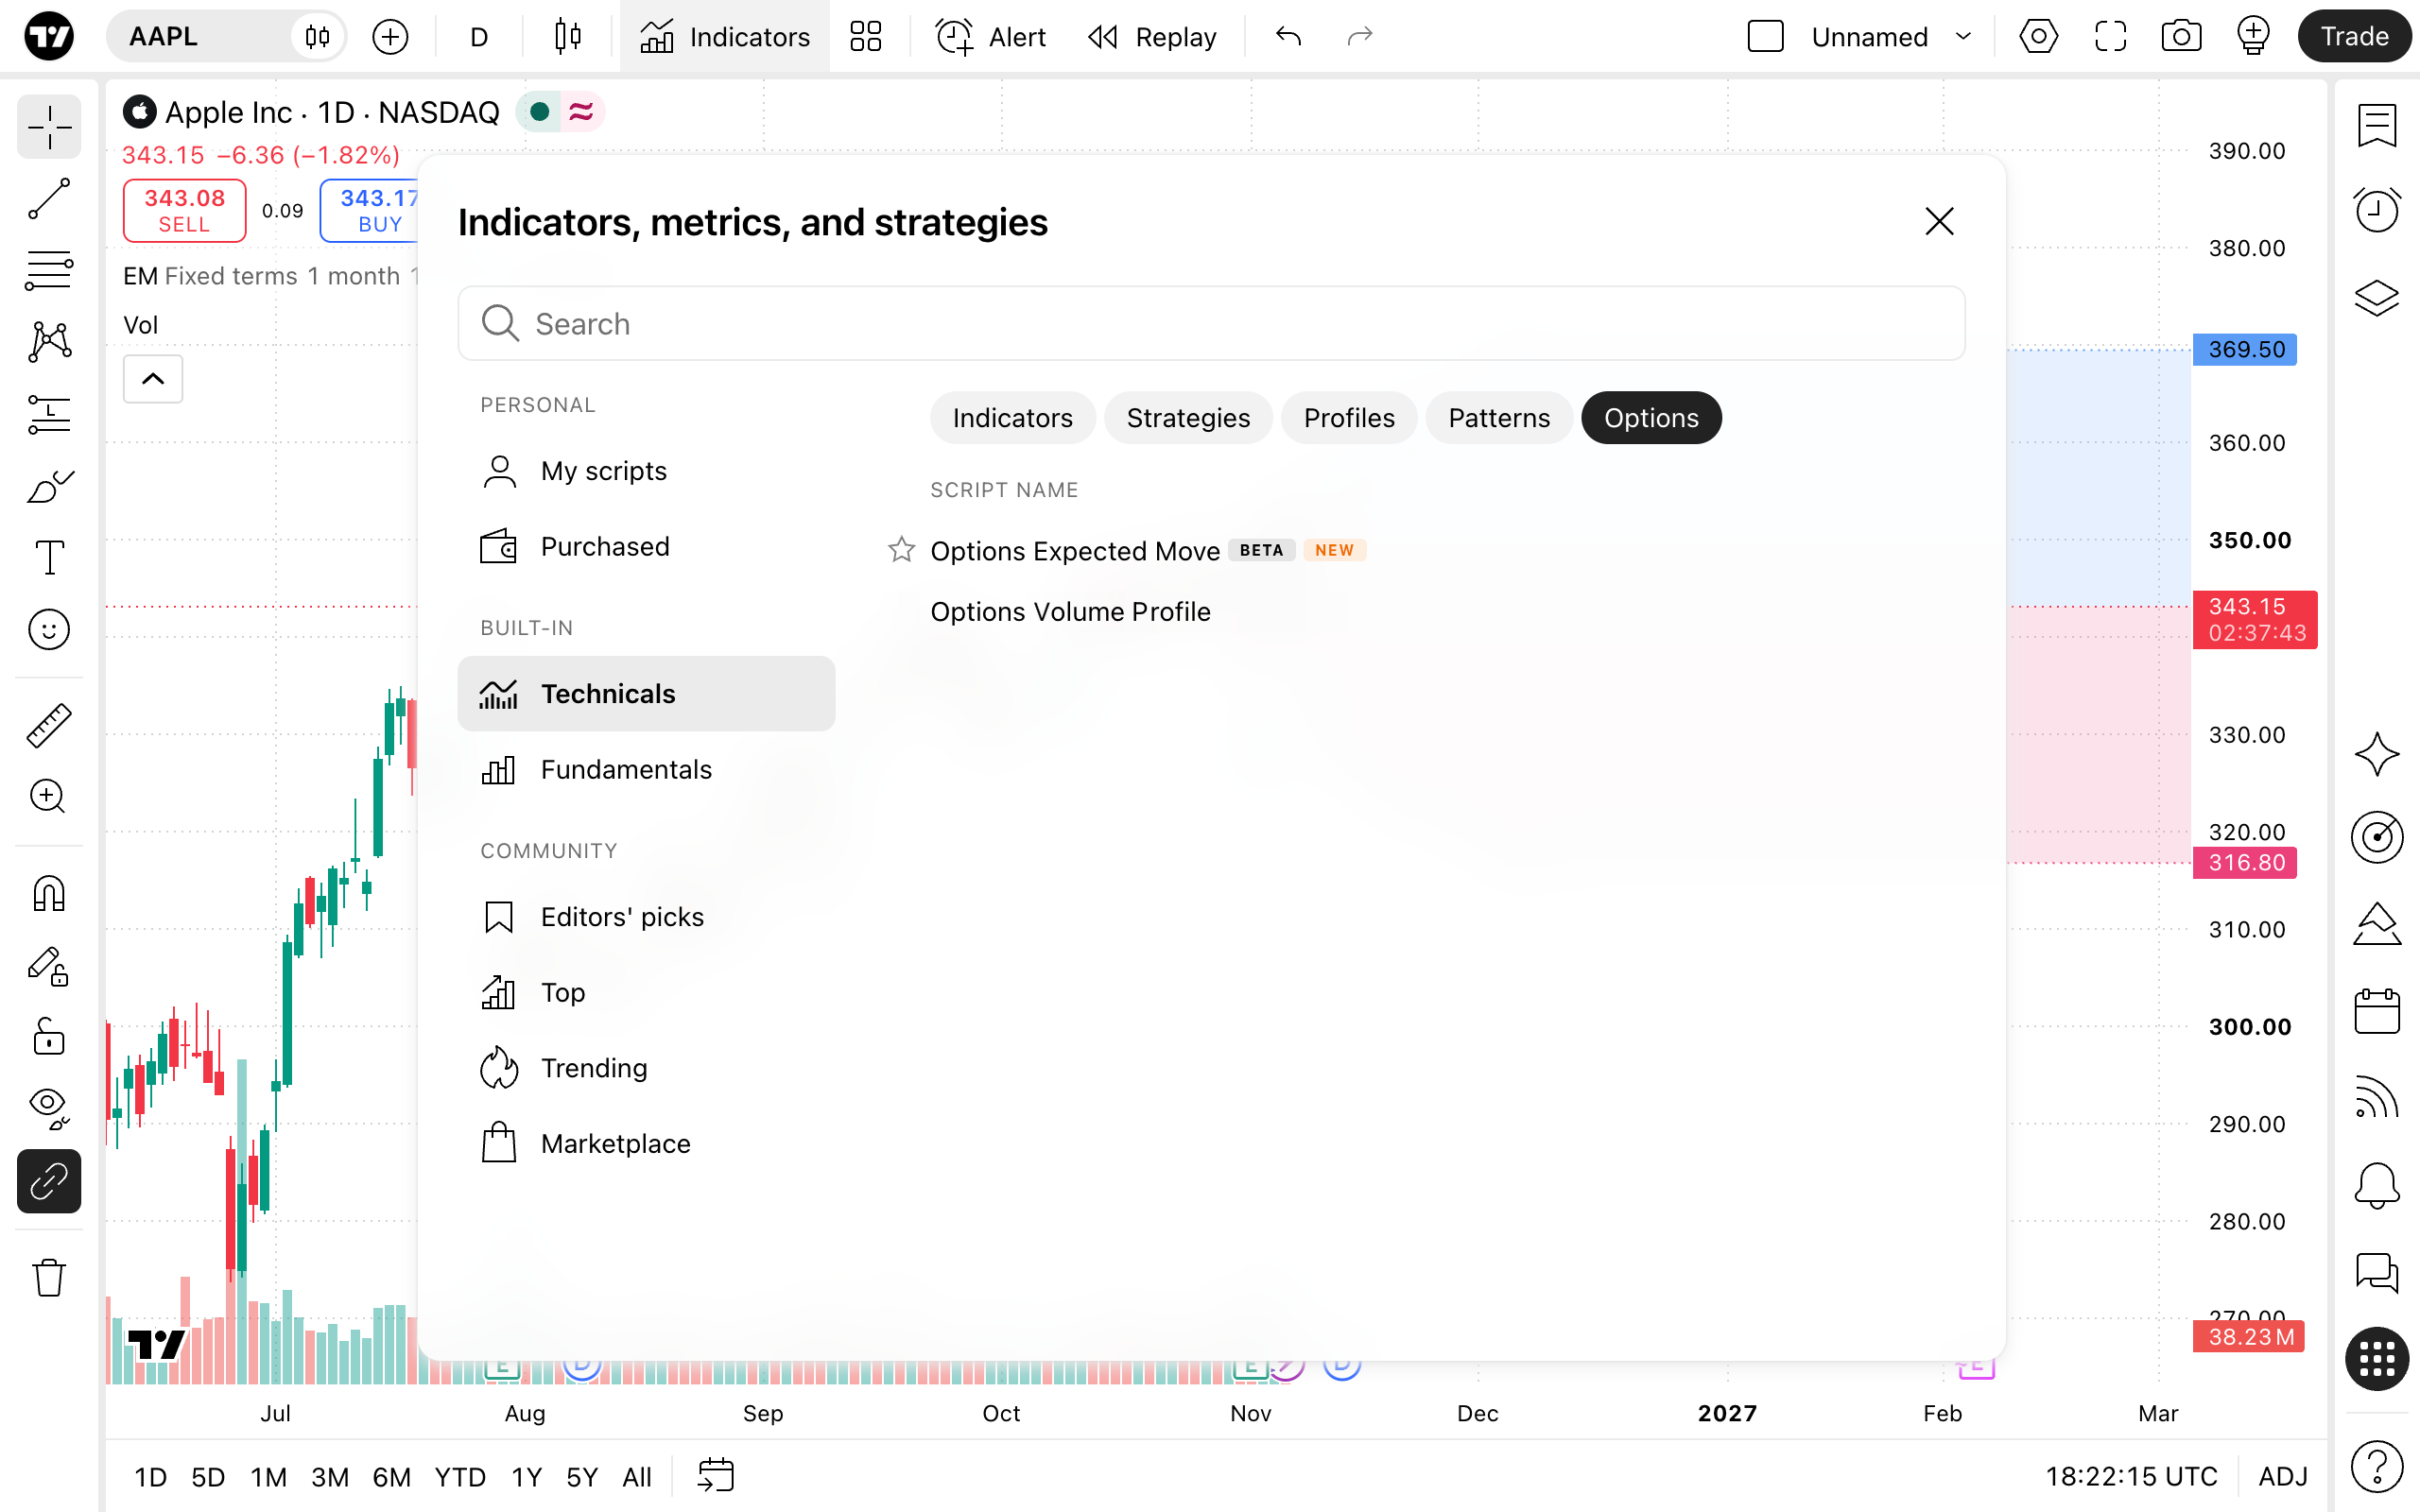
- Click Indicators on the top toolbar, select the Options tab.
- Click Options Expected Move.
The indicator appears on the chart with default settings: Listed expirations mode, a 1 month horizon, and 1 standard deviation. You can change them at any time in the indicator settings.
Note: Expected Move works only for symbols that have options data.
How to read the indicator
Each dot on the chart corresponds to an expiration date. The dots of the upper bound are connected into one smooth curve, the dots of the lower bound into another, and both curves start from the current price. Together they form a cone: the further the expiration, the wider the expected range.
After the last expiration, the bounds continue as horizontal lines to the price scale, where you'll see price labels with the values of the upper and lower bounds. The same values are also shown in the status line next to the indicator name.
To see detailed data for an expiration, long-press a point on the upper or lower bound.
Indicator settings
The settings are split into three tabs: Inputs, Style, and Visibility.
Inputs
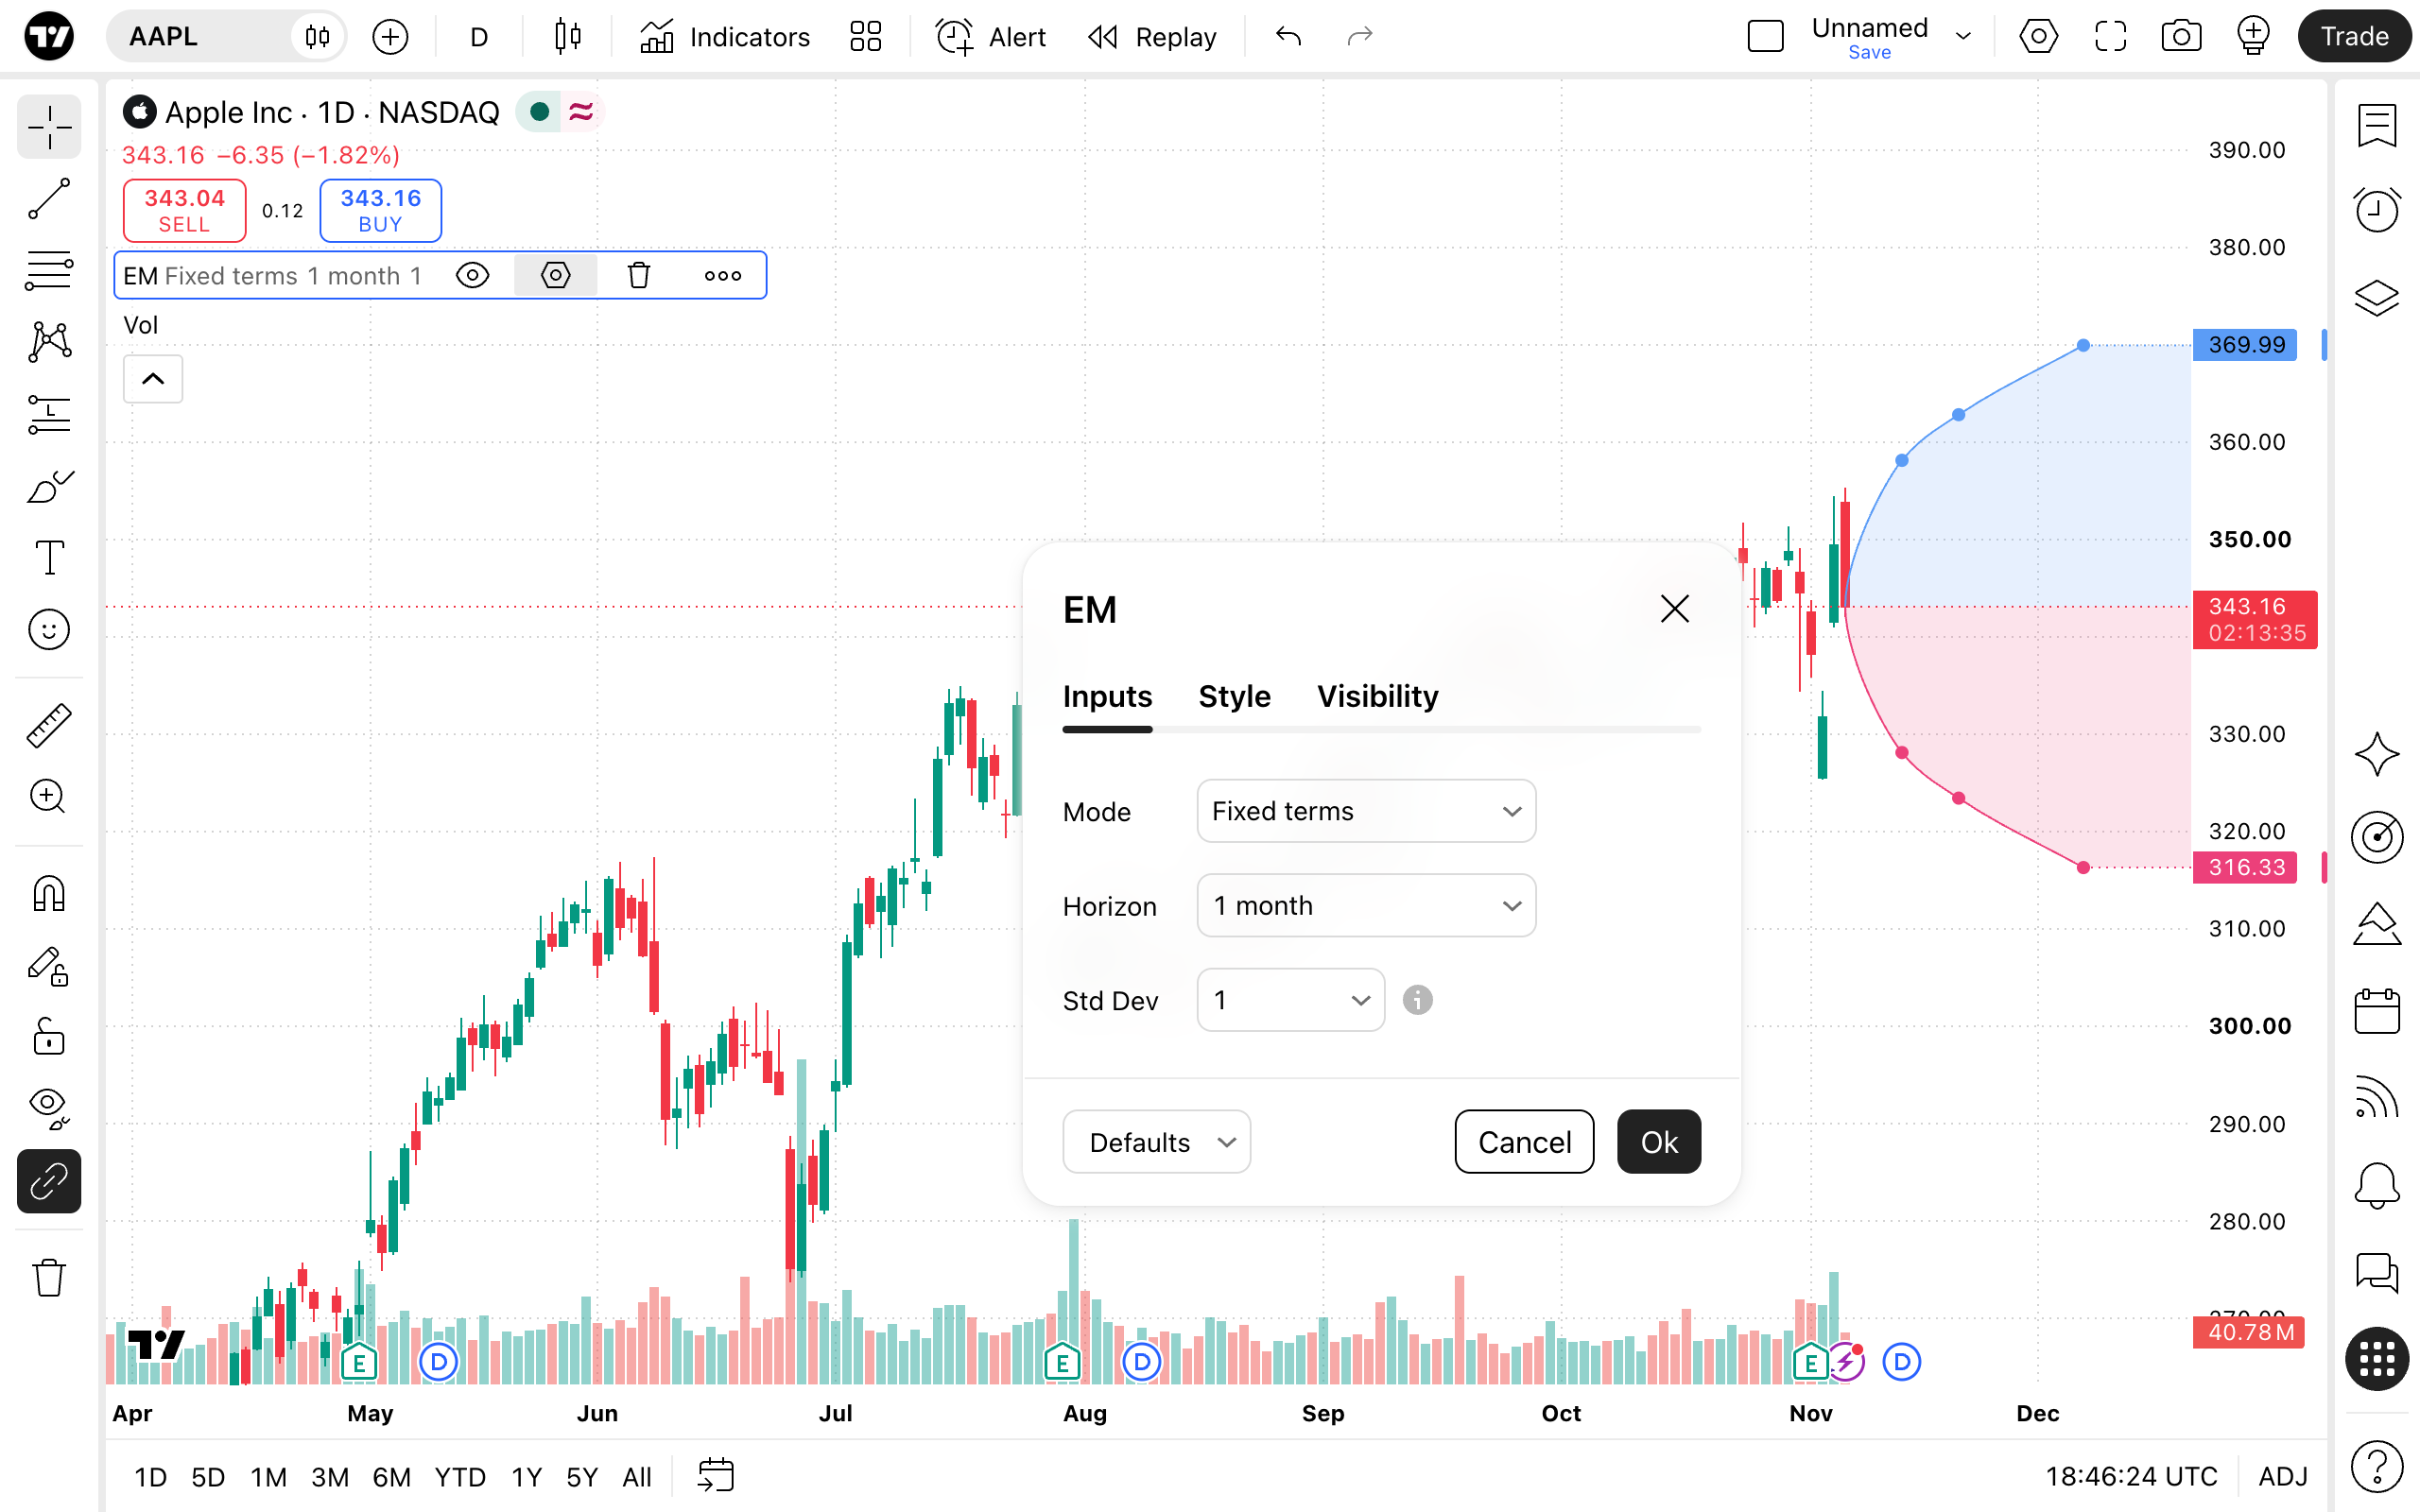
Mode defines which expiration points the cone is built from:
- Listed expirations — uses the actual expiration dates listed in the options chain. Each point is placed on its real expiration date and uses the ATM implied volatility of that expiration, without interpolation.
- Fixed terms — uses synthetic expirations at fixed distances from the current date: 7, 14, 30, 60, 90, 180, 270, and 365 days. Implied volatility for these points is interpolated from the listed expirations. This mode is useful for comparing the expected move across symbols with different expiration calendars.
Horizon defines how far into the future the cone extends. Available options: Nearest, 1 week, 2 weeks, 1 month, 2 months, 3 months, 6 months, 9 months, 1 year, and All. The selected horizon includes all points that come before it:
- In Listed expirations mode, 1 month shows all listed expirations within the next 30 calendar days. Nearest shows only the closest expiration, and All shows every available expiration.
- In Fixed terms mode, 1 month shows the 7-, 14-, and 30-day points. Nearest is equal to the 7-day point, and All includes every point up to 365 days.
Std Dev sets the width of the range in standard deviations:
- 1 — about 68% probability that the price stays within the range
- 2 — about 95% probability
- 3 — about 99.7% probability
Style
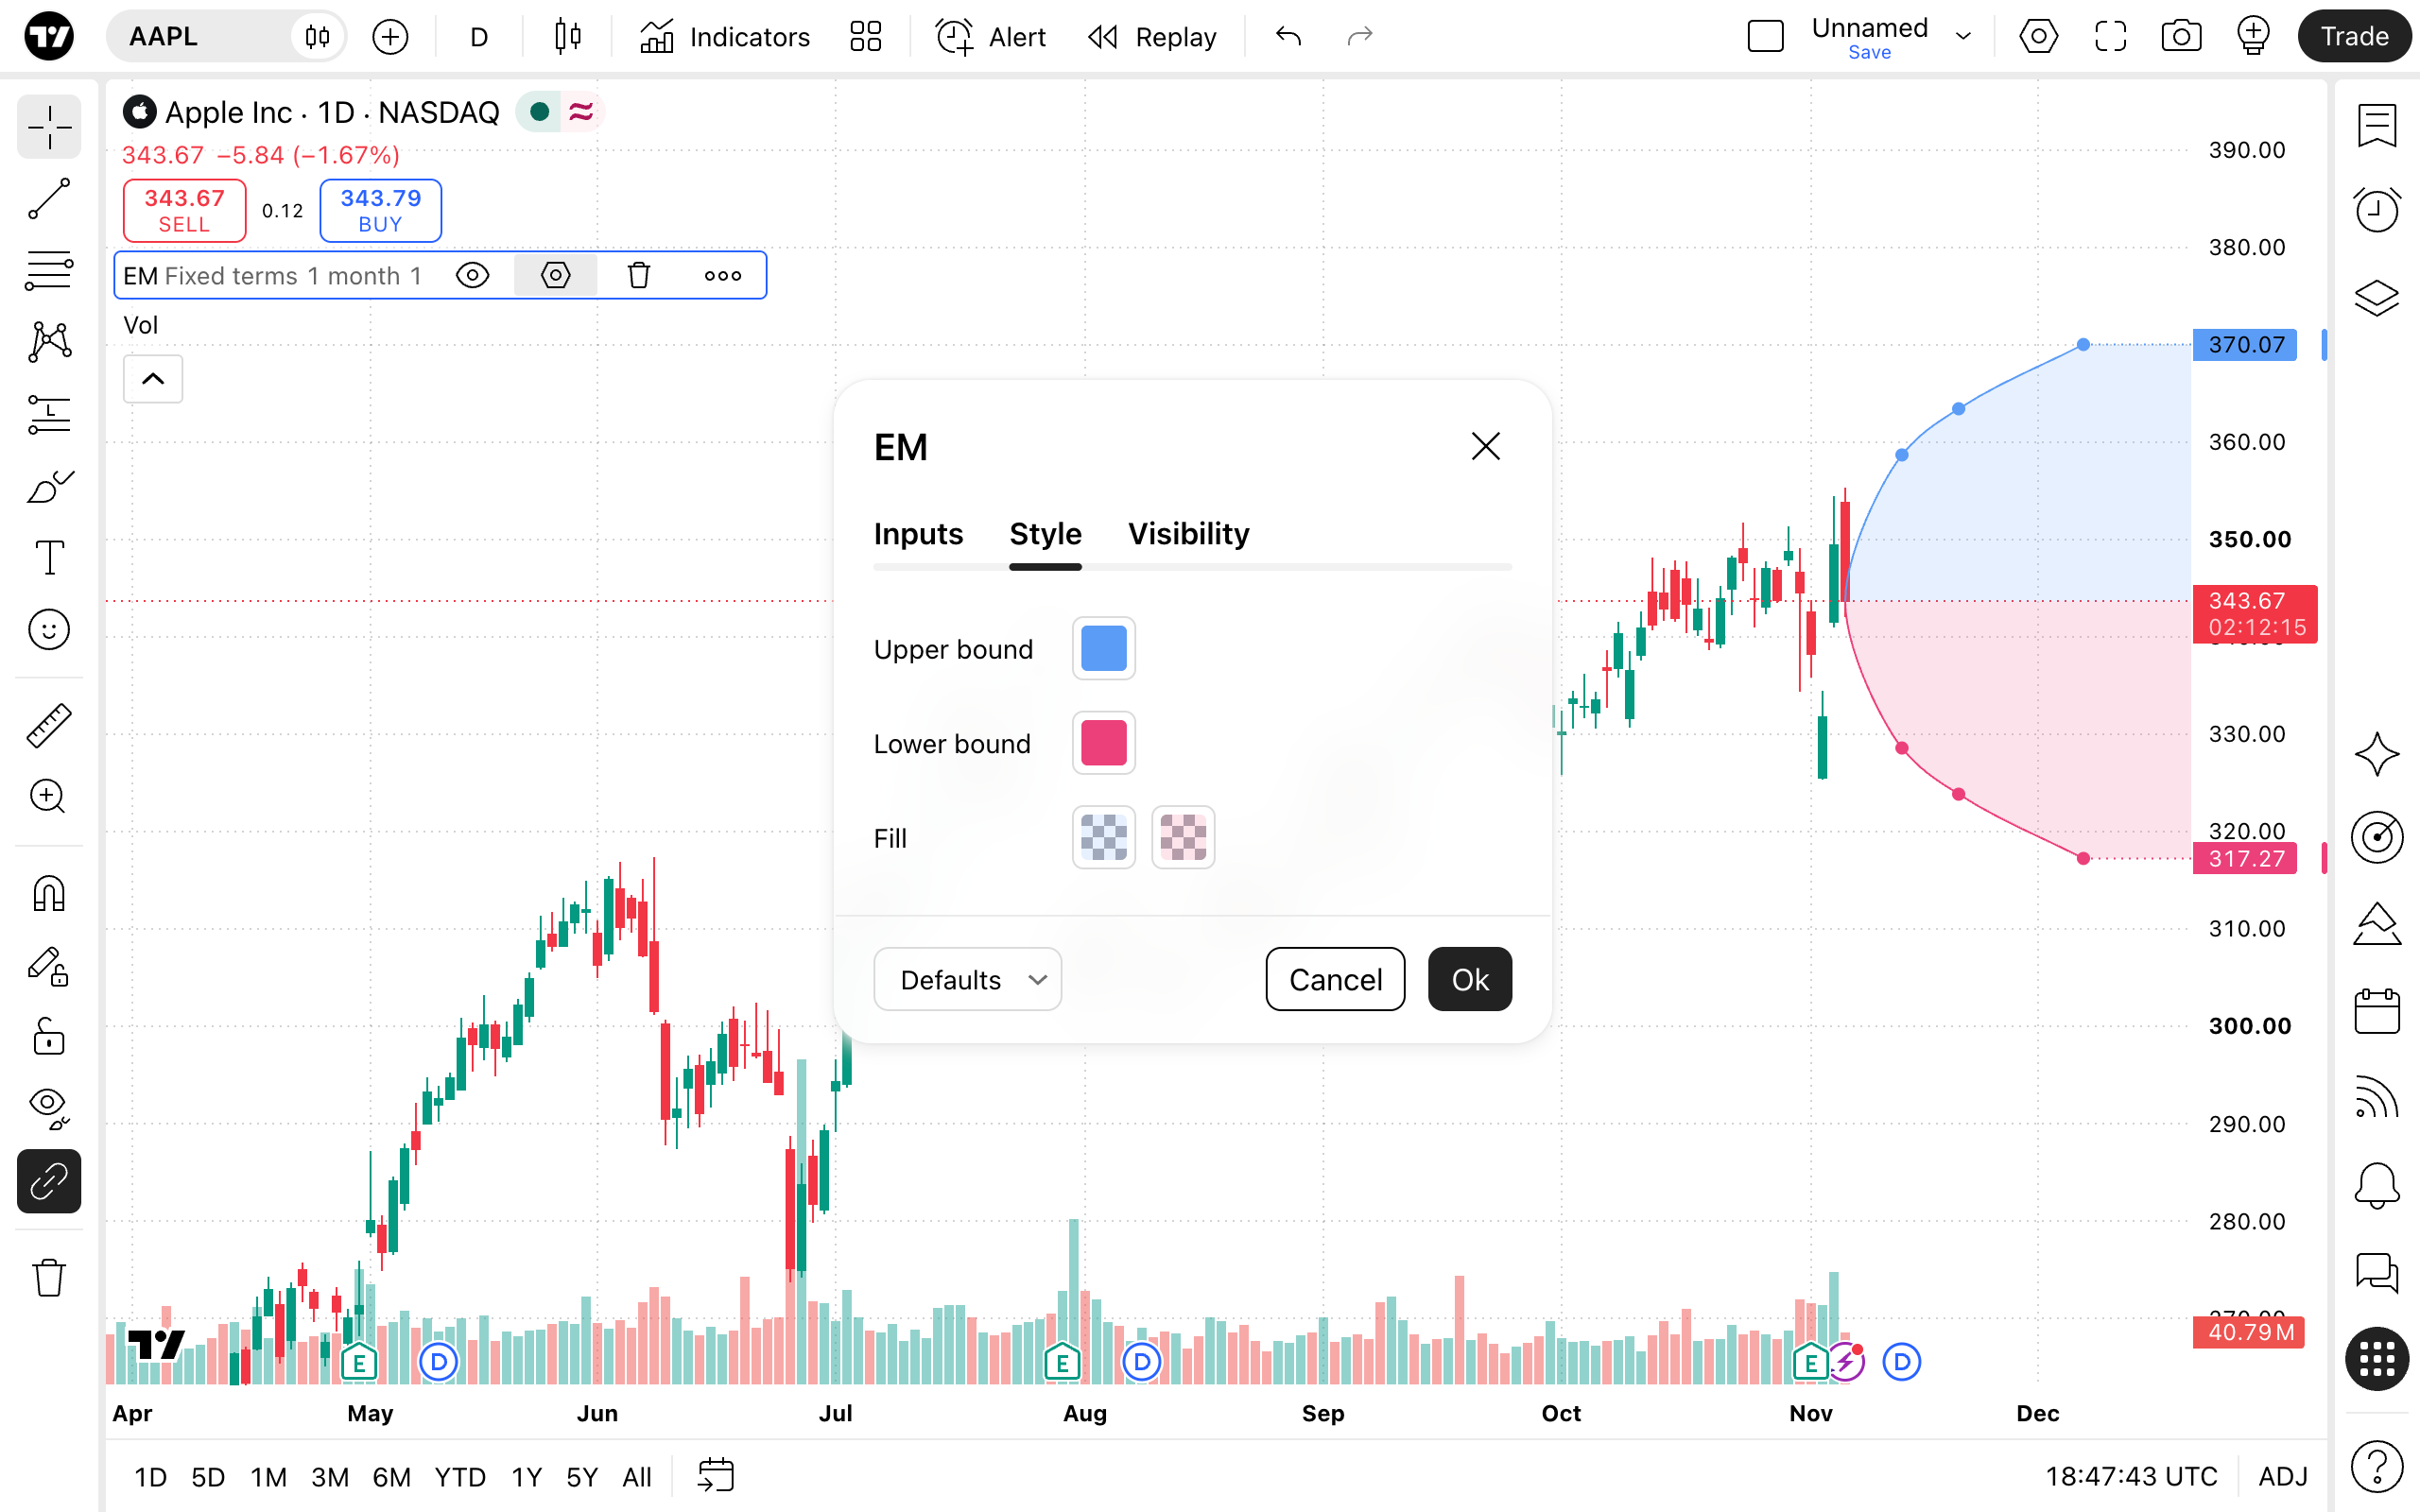
- Upper bound — the color of the upper bound. It applies to the line, expiration points, horizontal level continuation, labels, and the price label on the scale.
- Lower bound — the color of the lower bound, applied to the same elements.
- Fill — the fill colors of the area above and below the current price.
Things to know
- Dates on the time scale may differ slightly from the tooltip. Points on the chart are tied to bar times rather than to calendar dates, so on higher timeframes the date on the time scale and the DTE may not exactly match the expiration date and DTE in the tooltip.
- Higher timeframes combine expirations. On the weekly or monthly timeframe, a single bar can cover several expirations. In this case, only the latest expiration within each bar is displayed.
- One point per expiration date. If several option series share the same expiration date, the indicator shows one point for that date, using the series with the lowest ATM implied volatility.