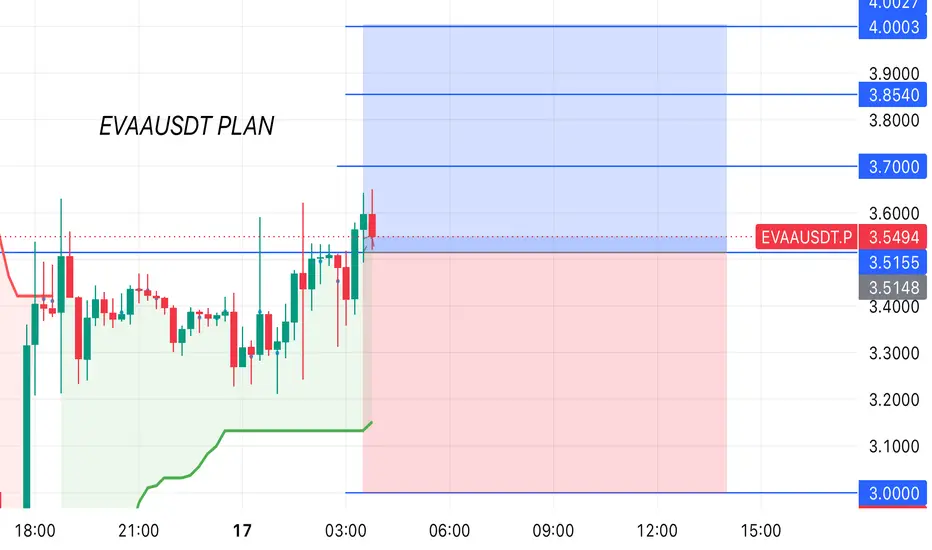
EVAA RUGGGG İS COMİNGGGYou can get in touch for support and business partnerships.
Always use 2x–3x leverage. We build positions in stages !
Max 4% of your account as margin per position.
Split that 4% into 3–6 entries.
DONT GET GREEDY !
Only add when your ROI is above -100%. Better: wait a few days between add-ons. Slee
EVAA / TetherUS PERPETUAL CONTRACT
No trades
No trades
Open interest
Open interest
Price
Liquidations
Long
Short
Price
EVAA/USDT: Bearish Rejection — -75% Downside Correction SetupEVAA Protocol ($EVAA) is showing acute blow-off exhaustion after surging nearly +300% over the past week from **$1.05** into a local peak of **$4.86**. With Daily RSI pinned deep in overbought territory (~84–87), protocol lending TVL declining ~11% to **$6.7M** despite the vertical price spike, and
EVAA/USDT: Bearish Rejection — -50% Downside Correction SetupEVAA Protocol ($EVAA) is showing severe overextension after surging over +149% over the past week into the **$3.55 – $3.83** overhead sell wall. With Daily RSI spiking deep into overbought territory (~86.5), elevated annualized funding rates (+288%), and heavy open interest leaving late longs expose
#EVAAUSDT LONG POSITION
ENTRY: 3.6823
PROFIT TARGET: 4.8524
STOP LOSS: 3.1593
EVAA/USDT has printed a strong impulsive move on the 4h chart and is pulling back into key demand structure. Looking for buyers to step in and defend the support zone, targeting a continuation upward toward 4.8524.
Manage your risk strictly (1
Did any coin beat EVAA's 302% week? Only AKE, as crypto fellEVAA rose 302% in one week while Bitcoin fell 13.5%. It was the biggest move of any market we scan, from crypto and gold to oil, forex and stocks, all on Bybit. Here is that week, from 12 November 2026 to 19 November 2026, on its Bybit perpetual, EVAAUSDT, in UTC.
The run
For two days EVAA sat n
long $$ EVAAUSDT $$Trendline Breakout: Price broke cleanly above the strong red resistance trendline that has capped gains for several months, signaling a potential shift from a bearish to a bullish market structure.
MACD Divergence & Double Bottom: Clear Regular Bullish Divergence on the MACD indicator (highlighted
$EVAA TOKEN THAT PUMPS 1,858% AND DUMPS 98% $EVAA TOKEN THAT PUMPS 1,858% AND DUMPS 98% | WHAT IS HAPPENING?
#EVAA is showing extreme volatility, and its price history is absolutely wild.
The Pump-and-Dump Cycle:
➡️ Oct 10–27, 2025: Pumped 1,858% from $0.70 to $13.7060 in just 17 days.
➡️ Oct 27, 2025 – Jun 5, 2026: Crashed approximately 98
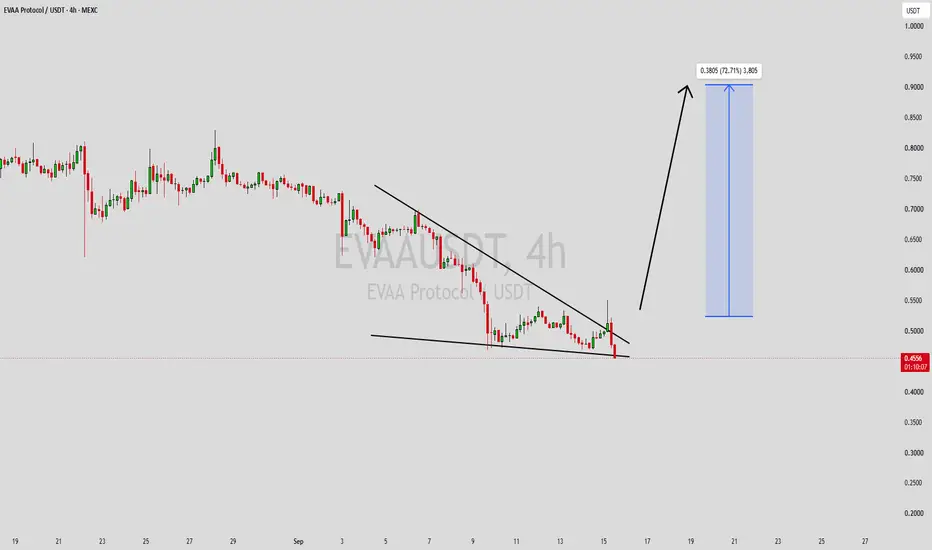
EVAAUSDT Forming Falling WedgeEVAAUSDT is forming a clear falling wedge pattern, a classic bullish reversal signal that often indicates an upcoming breakout. The price has been consolidating within a narrowing range, suggesting that selling pressure is weakening while buyers are beginning to regain control. With consistent volum
EVAAUSDT: Rejection at Resistance Keeps Bears in ControlEVAAUSDT is struggling to reclaim resistance after a weak recovery, with sellers continuing to defend the upper range. As long as 0.8390 remains unbroken, the short-term trend favors further downside.
A rejection from the current zone could push the price toward 0.7976, while a breakout above the s
See all ideas
Summarizing what the indicators are suggesting.
Oscillators
Neutral
Oscillators
Neutral
Summary
Neutral
Summary
Neutral
Summary
Neutral
Moving Averages
Neutral
Moving Averages
Neutral
Displays a symbol's price movements over previous years to identify recurring trends.