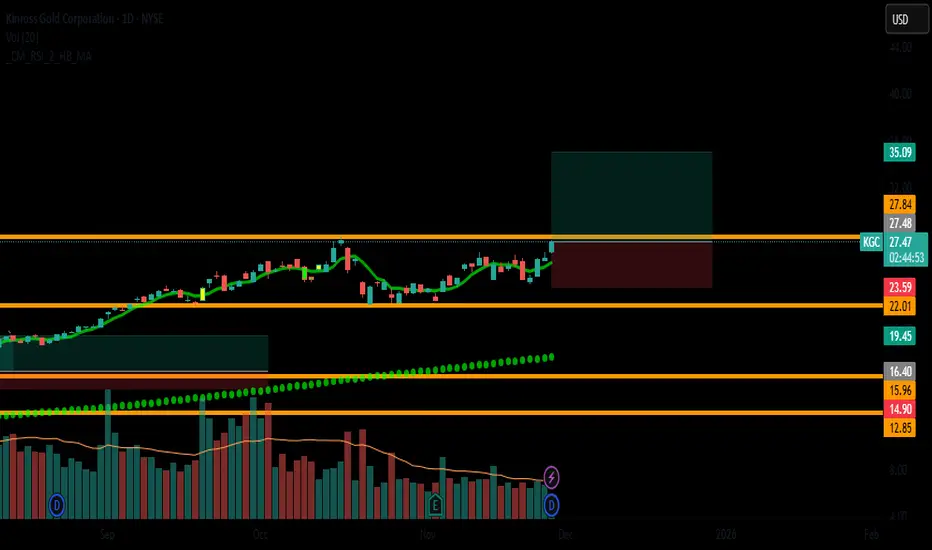
KGC: Mid- to macro bullish potentialThe macro uptrend structure looks constructive for more upside in the coming years. As long as price holds above the 31–22 support levels, we see potential to extend toward the 95–130 and even 200+ resistance levels.
Chart (Weekly):
On the daily timeframe: price is approaching a key support zon
Kinross Gold Corporation
No trades
No trades
Compare with Kinross Gold Corporation
42.19 MXN
43.84 B MXN
129.34 B MXN
1.19 B
Next report date
—
Report period
—
EPS estimate
—
Revenue estimate
—
Details
Sector
Industry
CEO
Jonathon Paul Rollinson
Website
Headquarters
Toronto
Founded
1993
IPO date
May 25, 1905
ISIN
CA4969024047
CUSIP
496902404
FIGI
BBG00ZQZVCR6
Identifiers
ISIN CA4969024047
Kinross Gold Corp. engages in the production, acquisition, exploration, and development of gold properties. The firm operates through the following business segments: Tasiast, Paracatu, La Coipa, Fort Knox, Round Mountain, Bald Mountain, and Corporate & Other. The Fort Knox segment includes Fort Knox and Manh Choh mine. Its mining operations are in the United States, Brazil, Chile, Mauritania, and Canada. The company was founded by Robert MacKay Buchan on May 31, 1993 and is headquartered in Toronto, Canada.
KGC: Bearish Tenkan-sen Bounce in C-to-D Leg
In my book, Ichimoku: The Holistic System, I detail the bread-and-butter bounce trades. In this chart of KGC we see what is known as a Tenkan-sen bounce. On June 4, there was a doji that touched the Tenkan--the measure of short-term equilibrium. The red candle of June 5 is a confirmation of th
High-Volatility Breakout Trade (Explosive Growth+Gold Leverage)🎯 Ticker: KGC (NYSE)
📈 Type: Swing Long / Momentum Trade
⏰ Timeframe: Daily & 4H
📊 Technical & Fundamental Analysis:
Trend Structure: BULLISH 4H/1H Trends, Daily Base Formation ✅
Key Level: Breaking above $27.40 multi-month resistance
Sector: Gold Mining - High Beta to Gold Prices
💡 Trading Thes
KGC – Gold Miner Swing SetupReasoning:
Part of the strongest group – Gold miners
Pullback to 50-Day MA after a strong run
Late-stage base forming – ideal for a quick swing
Swing Traders (2-6 Week Holds)
Buying rule: Use a buy stop above the breakout level to avoid false moves
Entry: Full position on breakout
Pr
$KGC Gold Mining GaloreSo, I guess there was a major sell off on Friday. Being that Gold is ripping in only one direction I would not bet again this stock. I would be looking to be playing earnings on all GOLD mining stocks they have Earning reports coming up next month NEM Newmont corporation is on the 23 of October so l
KGC (Kinross Gold Corporation) – Bullish Breakout Play🚀 Trade Idea: KGC (Kinross Gold Corporation) – Bullish Breakout Play
Entry: $16.40 | Stop Loss: $14.90 | Take Profit: $19.45
Risk/Reward Ratio: ~1:2.5
📈 Technical Setup
Trend:
Daily: Strong uptrend (higher highs & higher lows).
4H/1H: Bullish momentum confirmed with SMA(20) > SMA(50).
Key Level
KGC trade opportunity longHi everyone,
Just wanted to share a new trade I’ve taken on KGC.
The stock recently reacted from the weekly 10 EMA, and on the daily timeframe, it formed a descending wedge followed by a breakout. After that, it created a bullish flag which also broke out — this time with volume behind the move. T
See all ideas
Summarizing what the indicators are suggesting.
Neutral
SellBuy
Strong sellStrong buy
Strong sellSellNeutralBuyStrong buy
Neutral
SellBuy
Strong sellStrong buy
Strong sellSellNeutralBuyStrong buy
Neutral
SellBuy
Strong sellStrong buy
Strong sellSellNeutralBuyStrong buy
An aggregate view of professional's ratings.
Neutral
SellBuy
Strong sellStrong buy
Strong sellSellNeutralBuyStrong buy
Neutral
SellBuy
Strong sellStrong buy
Strong sellSellNeutralBuyStrong buy
Neutral
SellBuy
Strong sellStrong buy
Strong sellSellNeutralBuyStrong buy
Displays a symbol's price movements over previous years to identify recurring trends.
6.098% YTM
Maturity dateSep 1, 2041
Coupon6.88% (Fixed)
5.454% YTM
Maturity dateJul 15, 2033
Coupon6.25% (Fixed)
See all KGC/N bonds
Weight0.06%
Market value416.89 M
Weight0.09%
Market value276.80 M
Weight0.79%
Market value176.18 M
Weight0.99%
Market value166.99 M
Weight1.29%
Market value137.78 M
Weight4.02%
Market value133.90 M
Weight4.56%
Market value105.56 M
Weight0.94%
Market value100.69 M
Weight4.41%
Market value96.76 M
Weight0.80%
Market value95.65 M
Weight0.07%
Market value66.32 M
Explore more ETFs
Frequently asked questions
The current price of KGC/N is 413.00 MXN — it hasn't changed in the past 24 hours. Watch Kinross Gold Corporation stock price performance more closely on the chart.
Depending on the exchange, the stock ticker may vary. For instance, on BMV exchange Kinross Gold Corporation stocks are traded under the ticker KGC/N.
KGC/N stock has fallen by −6.14% compared to the previous week, the month change is a −18.54% fall, over the last year Kinross Gold Corporation has showed a 39.61% increase.
We've gathered analysts' opinions on Kinross Gold Corporation future price: according to them, KGC/N price has a max estimate of 944.06 MXN and a min estimate of 509.90 MXN. Watch KGC/N chart and read a more detailed Kinross Gold Corporation stock forecast: see what analysts think of Kinross Gold Corporation and suggest that you do with its stocks.
KGC/N reached its all-time high on Jan 26, 2026 with the price of 680.00 MXN, and its all-time low was 67.70 MXN and was reached on Jul 22, 2022. View more price dynamics on KGC/N chart.
See other stocks reaching their highest and lowest prices.
KGC/N stock is 0.00% volatile and has beta coefficient of 1.01. Track Kinross Gold Corporation stock price on the chart and check out the list of the most volatile stocks — is Kinross Gold Corporation there?
Today Kinross Gold Corporation has the market capitalization of 499.87 B, it has decreased by −5.16% over the last week.
Yes, you can track Kinross Gold Corporation financials in yearly and quarterly reports right on TradingView.
Kinross Gold Corporation is going to release the next earnings report on Jul 29, 2026. Keep track of upcoming events with our Earnings Calendar.
KGC/N earnings for the last quarter are 12.46 MXN per share, whereas the estimation was 12.78 MXN resulting in a −2.52% surprise. The estimated earnings for the next quarter are 11.58 MXN per share. See more details about Kinross Gold Corporation earnings.
Kinross Gold Corporation revenue for the last quarter amounts to 42.25 B MXN, despite the estimated figure of 42.69 B MXN. In the next quarter, revenue is expected to reach 39.23 B MXN.
KGC/N net income for the last quarter is 14.91 B MXN, while the quarter before that showed 16.59 B MXN of net income which accounts for 0.00% change. Track more Kinross Gold Corporation financial stats to get the full picture.
Yes, KGC/N dividends are paid quarterly. The last dividend per share was 0.69 MXN. As of today, Dividend Yield (TTM)% is 0.60%. Tracking Kinross Gold Corporation dividends might help you take more informed decisions.
Kinross Gold Corporation dividend yield was 0.48% in 2025, and payout ratio reached 6.82%. The year before the numbers were 1.25% and 15.79% correspondingly. See high-dividend stocks and find more opportunities for your portfolio.
As of Jul 25, 2026, the company has 7.1 K employees. See our rating of the largest employees — is Kinross Gold Corporation on this list?
EBITDA measures a company's operating performance, its growth signifies an improvement in the efficiency of a company. Kinross Gold Corporation EBITDA is 88.52 B MXN, and current EBITDA margin is 59.56%. See more stats in Kinross Gold Corporation financial statements.
Like other stocks, KGC/N shares are traded on stock exchanges, e.g. Nasdaq, Nyse, Euronext, and the easiest way to buy them is through an online stock broker. To do this, you need to open an account and follow a broker's procedures, then start trading. You can trade Kinross Gold Corporation stock right from TradingView charts — choose your broker and connect to your account.
Investing in stocks requires a comprehensive research: you should carefully study all the available data, e.g. company's financials, related news, and its technical analysis. So Kinross Gold Corporation technincal analysis shows the strong sell today, and its 1 week rating is sell. Since market conditions are prone to changes, it's worth looking a bit further into the future — according to the 1 month rating Kinross Gold Corporation stock shows the neutral signal. See more of Kinross Gold Corporation technicals for a more comprehensive analysis.
If you're still not sure, try looking for inspiration in our curated watchlists.