COMP: local squeeze with $19.67 destinationThe Macro Picture 🗺️
COMP unwound from the $26 highs down to the $14.83 macro floor, then carved out a base and reclaimed ground to $16.81. Price is holding in the lower half of the range with RSI curling back above 50 — the balance is starting to shift toward the buyers.
The Setup ⚙️
The Range F
Compound / WETH
No trades
No trades
Compare with Compound / Wrapped Ether on Ethereum (0xea4Ba4CE14fdd287f380b55419B1C5b6c3f22ab6) in USD
Trading activity
Transactions 65
BuysSells
3431
Volume 4.43 KUSD
Buys volumeSells volume
2.47 K1.96 K
Traders 40
BuyersSellers
1921
Crypto info
Compound (COMP) LONG — 1D ALMA Setup (WR 79%)█ SETUP
Compound · COINBASE:COMPUSD · 1d · long only.
ALMA Averaging Strategy: ALMA 3 / σ2, SD band 2, min diff 6 bar to add / 1 bar to exit, 25% per bar, up to 4 adds, hard stop −10% from average entry.
Strategy Tester (COMP 1D):
Win rate 79% · profit factor 6.6 · max drawdown 18%
Avg winn
COMP Main trend. 09/24/2025Logarithm. Time frame: 1 week.
Declines from the pump high +1000% to -97%
A horizontal channel has formed, with rising highs (outer boundaries). The inner channel range is -93-96%.
Typical trading in horizontal channels (from zones or on breakouts) and upon exiting them, while adhering to money
NC HAMMER CRYPTO visuals on other platforms?This is COMPOUND(COMP), comp is like….. Sofia Vergara. Gorgeous as hell but only dates people who make more money then her. Here we are at compounds almost absolute bottom. Removing all my TA and just posting the chart with CM Guppy and RSI, no Ta really needs to be done. We’ve seen compound go from
Buying COMP HereMorning Trading Fam,
After a several-week pause, my indicator is starting to light up with BUY signals again on a few alts. You may have noticed the update I gave on my TOTAL chart post. Price has come down to touch that 50-day EMA as expected. There was one more drop possibility (see post), howeve
Compound 200% very soonHello dear readers!
Another quick one for you. Compound has been around for a while and has seen a massive retrace of around 73%.
There are now reasons to be bullish for the short term.
When we look at the charts we can see a bullflag breakout (fierce) and retest of the upper bound. Its on a hard
COMPOUND Stock Chart Fibonacci Analysis 021225Trading Idea
1) Find a FIBO slingshot
2) Check FIBO 61.80% level
3) Entry Point > 57/61.80%
Chart time frame: B
A) 15 min(1W-3M)
B) 1 hr(3M-6M)
C) 4 hr(6M-1year)
D) 1 day(1-3years)
Stock progress: A
A) Keep rising over 61.80% resistance
B) 61.80% resistance
C) 61.80% support
D) Hit the bottom
E
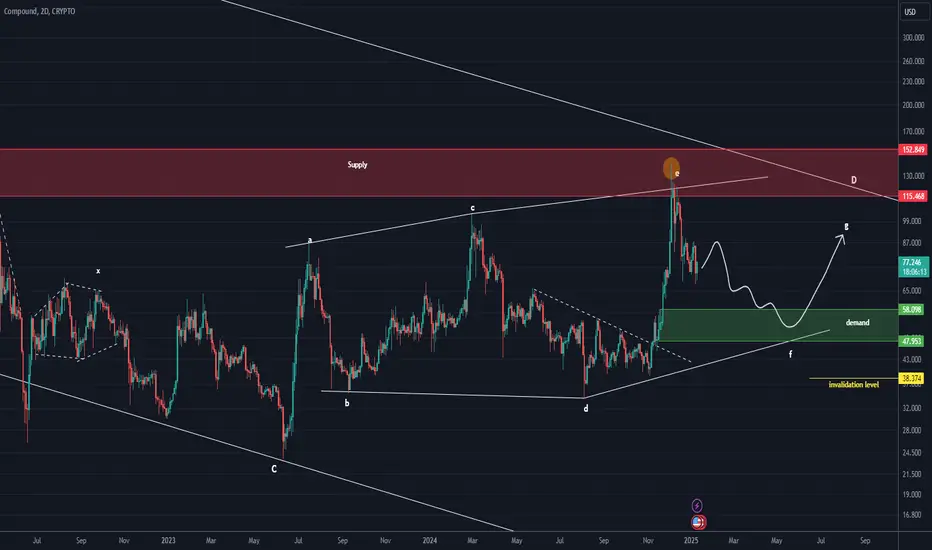
COMP Update (2D)This analysis is an update of the analysis you see in the "Related publications" section
First and foremost, pay attention to the timeframe. The 2-day timeframe is lengthy and requires patience.
It seems that COMP is currently within wave F of a large diametric pattern. Wave F is bearish.
The tim
See all ideas
Summarizing what the indicators are suggesting.
Oscillators
Neutral
Oscillators
Neutral
Summary
Neutral
Summary
Neutral
Summary
Neutral
Moving Averages
Neutral
Moving Averages
Neutral