
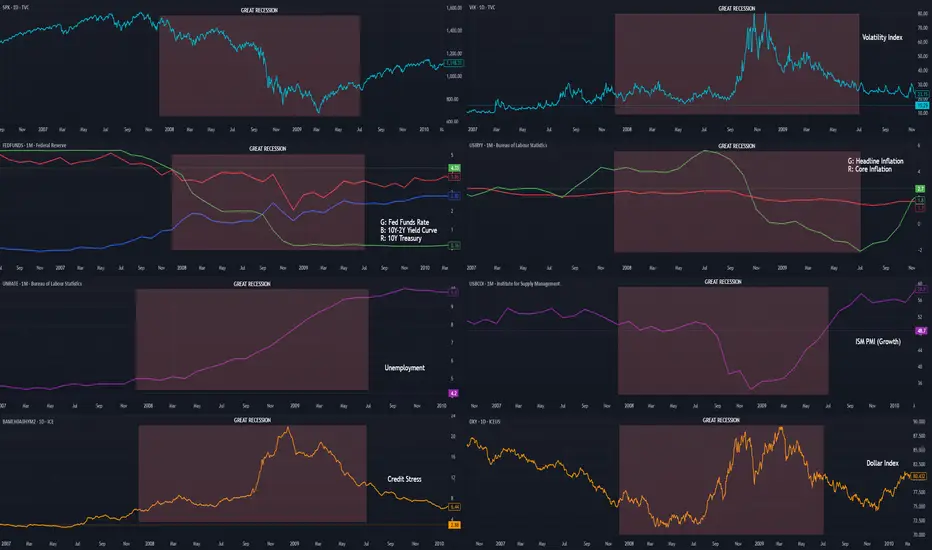
This is more of a cheatsheet/how-to for my own reference on my macro indicators charting layout. If the chart layout is helpful to the community, all the better! I find it useful for studying events and crises.
Indicators used: SPX, VIX, FEDFUNDS + US10Y + T10Y2Y, USIRYY + USCIR, UNRATE, USBCOI, BAMLH0A0HYM2, DXY
Row 1: Equity and volatility benchmarks
Row 2: Policy stance and inflation
Row 3: Unemployment and growth metrics
Row 4: Credit spreads and USD strength
SPX
VIX
FEDFUNDS + US10Y + T10Y2Y
USIRYY + USCIR
UNRATE
USBCOI
BAMLH0A0HYM2
DXY
Indicators used: SPX, VIX, FEDFUNDS + US10Y + T10Y2Y, USIRYY + USCIR, UNRATE, USBCOI, BAMLH0A0HYM2, DXY
Row 1: Equity and volatility benchmarks
Row 2: Policy stance and inflation
Row 3: Unemployment and growth metrics
Row 4: Credit spreads and USD strength
SPX
- Measuring: Equity benchmark
- Relevance: Broadest market barometer
- Observe: Trend direction, key levels, divergence vs other indicators
VIX
- Measuring: Volatility index
- Relevance: Market's implied volatility (read: "fear/greed gauge")
- Observe: Spike --> risk-off, hedging demand; sustained lows --> complacency
FEDFUNDS + US10Y + T10Y2Y
- Measuring: U.S. policy stance and yield curve
- Relevance: Monetary tightening and loosening; yield curve recession slope
- Observe: T10Y2Y curve inversion --> recession risk; bear steepening --> watch for inflation/deficit concerns; bull steepening --> Fed easing, recovery signal
USIRYY + USCIR
- Measuring: Inflation
- Relevance: Headline: all prices; Core: Excluding food + energy
- Observe: Headline stat drives short-term moves. Core stat drives Fed policy
UNRATE
- Measuring: Unemployment rate
- Relevance: Labor market health (this is a lagging indicator)
- Observe: Rising trend --> recession risk; very low --> possible overheating
USBCOI
- Measuring: Manufacturing PMI; Business activity
- Relevance: Leading growth indicator for manufacturing, services
- Observe: >50 means expansion, <50 means contraction
BAMLH0A0HYM2
- Measuring: U.S. High Yield Option-Adjusted Spread (the extra yield/spread investors demand to hold junk bonds vs risk-free Treasuries)
- Relevance: Stress in corporate bond markets; risk sentiment
- Observe: Widening --> investors demand more compensation for credit risk; narrowing --> investors are confident, low fear of defaults. 2-4 is normal, 4-6 is stressed, 6+ is distress, 10+ is crisis level
DXY
- Measuring: USD strength
- Relevance: Global liquidity, capital flows, financial conditions
- Observe: Strong USD = tighter conditions and pressure on risk assets; inverse for weak USD

إخلاء المسؤولية
لا يُقصد بالمعلومات والمنشورات أن تكون، أو تشكل، أي نصيحة مالية أو استثمارية أو تجارية أو أنواع أخرى من النصائح أو التوصيات المقدمة أو المعتمدة من TradingView. اقرأ المزيد في شروط الاستخدام.
إخلاء المسؤولية
لا يُقصد بالمعلومات والمنشورات أن تكون، أو تشكل، أي نصيحة مالية أو استثمارية أو تجارية أو أنواع أخرى من النصائح أو التوصيات المقدمة أو المعتمدة من TradingView. اقرأ المزيد في شروط الاستخدام.