S&P500 Is it about to correct to 7000 minimum?The S&P500 index (SPX) has turned into a sideways consolidation for almost 2 months, putting a stop to the relentless 9 straight green weeks rally that preceded it. At the same time, the 1W RSI has been falling under Lower Highs pressure.
Every time we saw this RSI pattern since late 2021, the inde
S&P 500 Index
No trades
No trades
Compare with S&P 500
Details
Standard and Poor's 500 Index is a capitalization-weighted index of 500 stocks. The index is designed to measure performance of the broad domestic economy through changes in the aggregate market value of 500 stocks representing all major industries. The index was developed with a base level of 10 for the 1941-43 base period.
Developing Violent Stock Market TopThe US stock market as viewed by the S+P 500 Index,
is in a final stages of advance this summer
leading to a violent stock market top, and rollover.
The final top, as I am calling it,
will not let bullish traders out.
Capitulation will be the only way to the exit.
Panic will ultimately replace o
Hellena | SPX500 (4H): LONG to the 7700 resistance area.It has been a while since my last S&P 500 update. The structure remained unclear for some time, but the bullish scenario is becoming much easier to read now.
After the medium-degree wave "4" was completed around 7228.7, the price started developing wave "5". Inside it, the smaller waves "1" and "2"
S&P 500 at Potential Reversal Zone—Is a Bigger Correction Next?The S&P 500 ( FOREXCOM:SPX500 ) reacted strongly to the recent support zone($7,463-$7,430) and Support Lines, which led to another bullish move. However, the index is currently trading near the key trading level of $7,500 and the Potential Reversal Zone (PRZ) .
From an Elliott Wave perspective, Wa
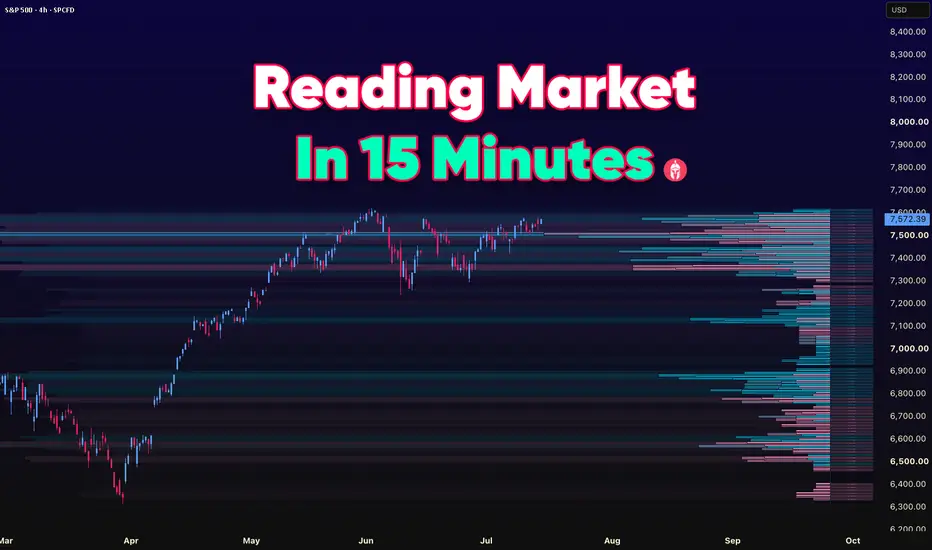
The Performance Trader · 02: Reading Market In 15 MinutesThe Performance Trader · 02: Reading Market In 15 Minutes
Last week I promised you the routine that decides your first trade before the market even opens. So here it is, the actual thing I do.
There was a long stretch where I'd sit down maybe two minutes before the open, coffee still too hot to d
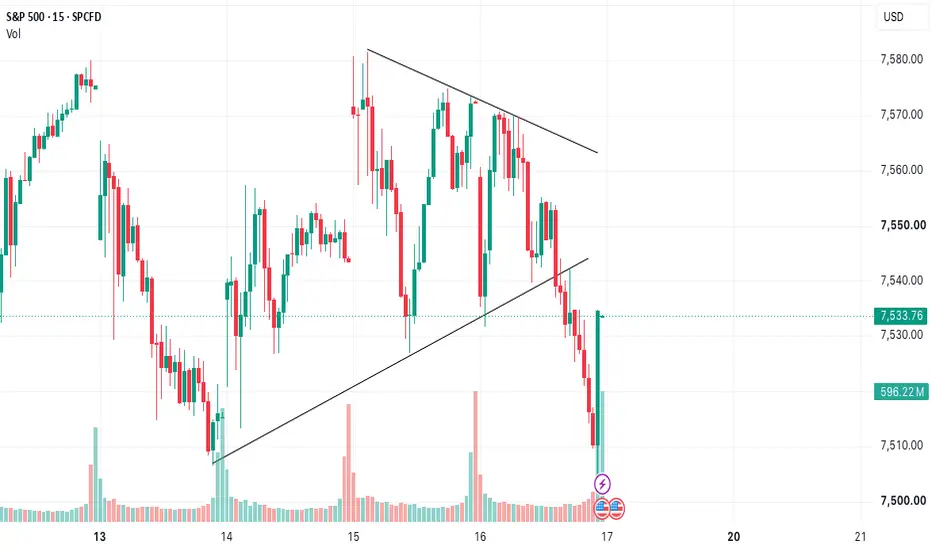
Market SellIt definitely looks like the B wave is complete after yesterday's high and today was just a simple correction of the first move down of the larger C wave. We have broken yesterday's lows, so traders are gradually getting stopped out as it melts down.
If the C wave hypothesis is true, tomorrow we s
S&P 500: Here's Why the 8,000-Point Level MattersThe long-term trend of the S&P 500 index remains bullish, and correction phases rarely last more than a few weeks, with drawdowns generally limited to between 10% and 20%. Every time the S&P 500 experiences a correction, pessimists start talking about a stock market crash, yet each decline has consi
See all ideas
Displays a symbol's value movements over previous years to identify recurring trends.
Frequently asked questions
S&P 500 Index reached its highest quote on Jun 2, 2026 — 7,620.90 USD. See more data on the S&P 500 Index chart.
The lowest ever quote of S&P 500 Index is 2.73 USD. It was reached on Jun 1, 1877. See more data on the S&P 500 Index chart.
The top companies of S&P 500 Index are NASDAQ:NVDA, NASDAQ:AAPL, and NASDAQ:GOOG — they can boast market cap of 5.05 T USD, 4.72 T USD, and 3.88 T USD accordingly.
The champion of S&P 500 Index is NASDAQ:SNDK — it's gained 3.82 K% over the year.
The weakest component of S&P 500 Index is NASDAQ:TTD — it's lost −79.47% over the year.
S&P 500 Index is just a number that lets you track performance of the instruments comprising the index, so you can't invest in it directly. But you can buy S&P 500 Index futures or funds or invest in its components.
The S&P 500 Index is comprised of 503 instruments including NASDAQ:NVDA, NASDAQ:AAPL, NASDAQ:GOOG and others. See the full list of S&P 500 Index components to find more opportunities.