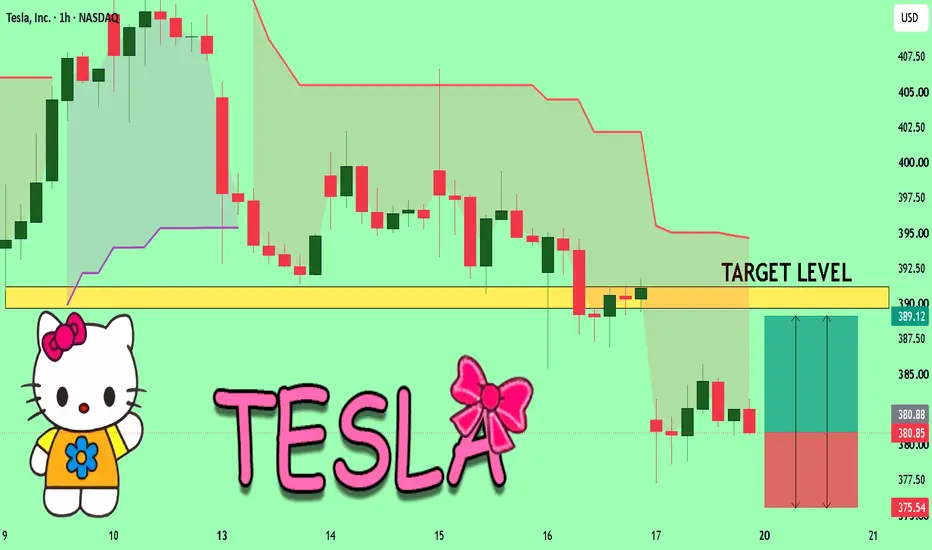
TSLA Bearish Rejection from Fair Value Gap (FVG)
Tesla (TSLA) is showing bearish momentum after rejecting the Fair Value Gap (FVG) and failing to reclaim the overhead supply zone. Price remains below the Ichimoku resistance, suggesting sellers are still in control.
If the current bearish structure holds, a continuation toward the major support
Compare with Tesla
Key facts today
Tesla (TSLA) expected Q2 adjusted EPS ~$0.54 on ~$25.7B revenue. Prior quarter: $0.41 EPS, $22.39B revenue, 480,126 vehicles delivered, 13.5 GWh energy storage deployed. 1
Tesla (TSLA) reports Q2 results; stock under pressure despite delivery gains. Model 3/Y forecast 96% of 2025 sales. July 24 at‑the‑money straddle ≈7% vs long‑term post‑earnings ~9%. 1
Tesla to boost Berlin Gigafactory output to ~7,500 vehicles/week (~375,000 yearly), a ~20% rise, and add about 3,500 workers, including ~1,000 hires for the manufacturing ramp. 1
1.20 USD
3.79 B USD
94.83 B USD
2.63 B
Next report date
—
Report period
—
EPS estimate
—
Revenue estimate
—
Profile
Sector
Industry
CEO
Elon Reeve Musk
Website
Headquarters
Austin
Founded
2003
IPO date
Jun 29, 2010
ISIN
US88160R1014
CUSIP
88160R101
FIGI
BBG000N9MNX3
Identifiers
ISIN US88160R1014
Tesla, Inc. engages in the design, development, manufacture, and sale of electric vehicles and energy generation and storage systems. The company operates through Automotive and Energy Generation and Storage. The Automotive segment includes the design, development, manufacture, sale, and lease of electric vehicles as well as sales of automotive regulatory credits. The Energy Generation and Storage segment is involved in the design, manufacture, installation, sale, and lease of stationary energy storage products and solar energy systems, and sale of solar energy systems incentives. The company was founded by Jeffrey B. Straubel, Elon Reeve Musk, Martin Eberhard, and Marc Tarpenning on July 1, 2003 and is headquartered in Austin, TX.
TSLA H1 MAP: 8.2/10 Wall at 415 vs Strong 389 Support▪️ TSLA H1 SNAPSHOT — EXECUTIVE SUMMARY
▪️ TSLA is currently trading near 394.79, hovering just above a strong support shelf after being rejected from the heavy supply cluster overhead. Market structure is consolidating, with price boxed between a well-defended floor below and a stack of stiff resi
TESLA Trading Opportunity! BUY!
My dear subscribers,
My technical analysis for TESLA is below:
The price is coiling around a solid key level - 380.88
Bias - Bullish
Technical Indicators: Pivot Points Low anticipates a potential price reversal.
Super trend shows a clear buy, giving a perfect indicators' convergence.
Goal - 3
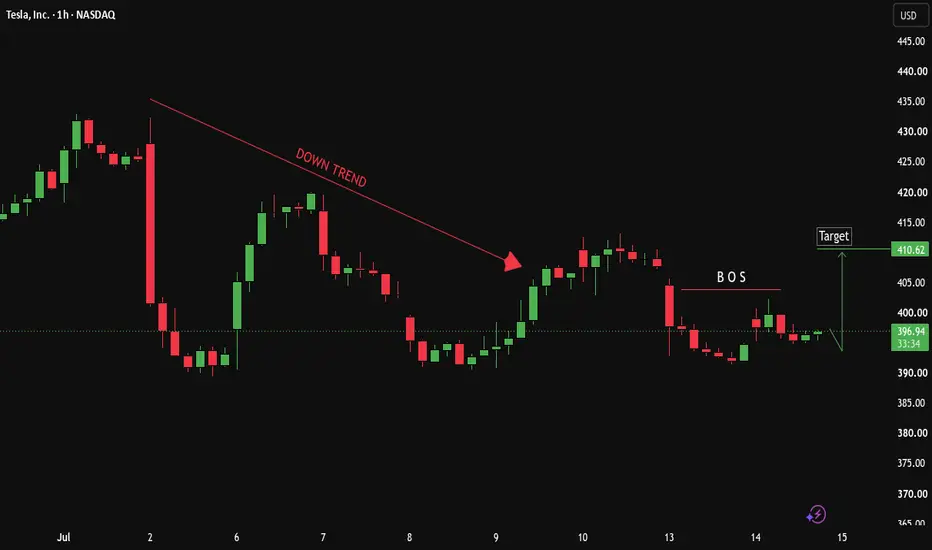
TESLA BUY SETUPTESLA is showing signs of potential bullish reversal after forming a (BOS) . A succesfull hold above support could trigger a move toward the next resistance zone . wait for conformation before entering and always manage your risk .
Entry : 395
Target :410
Stop loss : 390
Buy on conformation above
TSLA | Trend Flipped — Buy The Dip Before The Run!TSLA | Trend Flipped Bullish — Buy The Dip Before The Liquidity Run!
By analyzing the #TSLA (Tesla) chart on the 4H timeframe, we can see that the trend has decisively shifted from bearish to bullish. After an extended downtrend, buyers have wrestled back control — and the current pullback looks
Tesla: Pause before next break higherTesla has seen a very nice recovery above the 436 level back in May, which we highlighted as an important level point for bullish continuation, because it clearly shows that bulls are still active, especially since the whole decline from the December highs into the April 2026 lows unfolded in seven
Pre-Earnings Triangle in Tesla Tesla has been struggling all year, and now some traders may see risk of a break to the downside.
The first pattern on today’s chart is the tight range since July 2. The EV giant has made lower highs while remaining above roughly $390.50. That could be viewed as a bearish triangle, with potential f
TSLA Earnings incoming , make or break moment?
Tesla is down 6% on the month and the chart is giving us a very clear picture heading into earnings let's break it down.
After rejecting hard from the year high at $454, Tesla has been selling off through a descending wedge, now sitting at $391 with overnight already printing $385. The key zone t
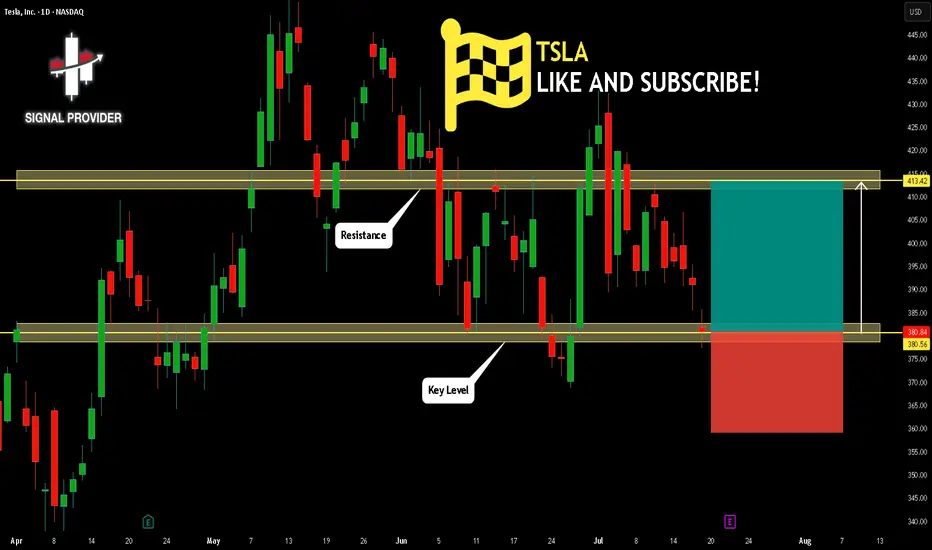
TSLA Will Go Up! Long!
Please, check our technical outlook for TSLA.
Time Frame: 1D
Current Trend: Bullish
Sentiment: Oversold (based on 7-period RSI)
Forecast: Bullish
The market is on a crucial zone of demand 380.56.
The oversold market condition in a combination with key structure gives us a relatively strong bull
Can Tesla Finally Break $433 or Will Another Lower High Form?Tesla has delivered strong headlines recently, but the chart suggests the real test is only beginning. After rebounding from around $369 to nearly $433, price failed to reclaim the previous lower highs and is now consolidating near $408, a level where multiple technical factors are starting to overl
See all ideas
Summarizing what the indicators are suggesting.
Neutral
SellBuy
Strong sellStrong buy
Strong sellSellNeutralBuyStrong buy
Neutral
SellBuy
Strong sellStrong buy
Strong sellSellNeutralBuyStrong buy
Neutral
SellBuy
Strong sellStrong buy
Strong sellSellNeutralBuyStrong buy
An aggregate view of professional's ratings.
Neutral
SellBuy
Strong sellStrong buy
Strong sellSellNeutralBuyStrong buy
Neutral
SellBuy
Strong sellStrong buy
Strong sellSellNeutralBuyStrong buy
Neutral
SellBuy
Strong sellStrong buy
Strong sellSellNeutralBuyStrong buy
Displays a symbol's price movements over previous years to identify recurring trends.
Weight1.63%
Market value37.62 B
Weight1.83%
Market value30.76 B
Weight1.62%
Market value14.21 B
Weight3.02%
Market value13.92 B
Weight1.62%
Market value12.73 B
Weight3.26%
Market value12.38 B
Weight3.33%
Market value4.11 B
Weight17.66%
Market value3.97 B
Weight3.02%
Market value2.95 B
Weight1.63%
Market value2.59 B
Weight1.62%
Market value2.48 B
Explore more ETFs
Frequently asked questions
The current price of TSLA is 369.57 USD — it has decreased by −2.96% in the past 24 hours. Watch Tesla, Inc. stock price performance more closely on the chart.
Depending on the exchange, the stock ticker may vary. For instance, on NASDAQ exchange Tesla, Inc. stocks are traded under the ticker TSLA.
TSLA stock has fallen by −8.66% compared to the previous week, the month change is a −7.17% fall, over the last year Tesla, Inc. has showed a 14.89% increase.
We've gathered analysts' opinions on Tesla, Inc. future price: according to them, TSLA price has a max estimate of 600.00 USD and a min estimate of 24.86 USD. Watch TSLA chart and read a more detailed Tesla, Inc. stock forecast: see what analysts think of Tesla, Inc. and suggest that you do with its stocks.
TSLA reached its all-time high on Dec 22, 2025 with the price of 498.83 USD, and its all-time low was 1.00 USD and was reached on Jul 7, 2010. View more price dynamics on TSLA chart.
See other stocks reaching their highest and lowest prices.
TSLA stock is 4.65% volatile and has beta coefficient of 1.96. Track Tesla, Inc. stock price on the chart and check out the list of the most volatile stocks — is Tesla, Inc. there?
Today Tesla, Inc. has the market capitalization of 1.47 T, it has decreased by −3.53% over the last week.
Yes, you can track Tesla, Inc. financials in yearly and quarterly reports right on TradingView.
Tesla, Inc. is going to release the next earnings report on Jul 22, 2026. Keep track of upcoming events with our Earnings Calendar.
TSLA earnings for the last quarter are 0.41 USD per share, whereas the estimation was 0.35 USD resulting in a 15.87% surprise. The estimated earnings for the next quarter are 0.52 USD per share. See more details about Tesla, Inc. earnings.
Tesla, Inc. revenue for the last quarter amounts to 22.39 B USD, despite the estimated figure of 22.10 B USD. In the next quarter, revenue is expected to reach 26.07 B USD.
TSLA net income for the last quarter is 477.00 M USD, while the quarter before that showed 840.00 M USD of net income which accounts for 0.00% change. Track more Tesla, Inc. financial stats to get the full picture.
No, TSLA doesn't pay any dividends to its shareholders. But don't worry, we've prepared a list of high-dividend stocks for you.
As of Jul 21, 2026, the company has 134.78 K employees. See our rating of the largest employees — is Tesla, Inc. on this list?
EBITDA measures a company's operating performance, its growth signifies an improvement in the efficiency of a company. Tesla, Inc. EBITDA is 11.59 B USD, and current EBITDA margin is 11.60%. See more stats in Tesla, Inc. financial statements.
Like other stocks, TSLA shares are traded on stock exchanges, e.g. Nasdaq, Nyse, Euronext, and the easiest way to buy them is through an online stock broker. To do this, you need to open an account and follow a broker's procedures, then start trading. You can trade Tesla, Inc. stock right from TradingView charts — choose your broker and connect to your account.
Investing in stocks requires a comprehensive research: you should carefully study all the available data, e.g. company's financials, related news, and its technical analysis. So Tesla, Inc. technincal analysis shows the strong sell today, and its 1 week rating is sell. Since market conditions are prone to changes, it's worth looking a bit further into the future — according to the 1 month rating Tesla, Inc. stock shows the neutral signal. See more of Tesla, Inc. technicals for a more comprehensive analysis.
If you're still not sure, try looking for inspiration in our curated watchlists.