TESLA Sellers In Panic! BUY!
My dear friends,
Please, find my technical outlook for TESLA below:
The price is coiling around a solid key level - 372.01
Bias - Bullish
Technical Indicators: Pivot Points High anticipates a potential price reversal.
Super trend shows a clear buy, giving a perfect indicators' convergence.
Goal - 376.04
Safe Stop Loss - 369.31
About Used Indicators:
The pivot point itself is simply the average of the high, low and closing prices from the previous trading day.
Disclosure: I am part of Tr
In-depth trading ideas
Price Action Resistance Rejection Puts 320 Liquidity in Focus🔹 TSLA is showing a rising market structure within an ascending channel after recovering from the 300–320 area. Price recently tested the 380–390 resistance zone and faced rejection, creating a short-term pullback toward the 350–360 support region. The recent move suggests that buyers are still defending the broader upward structure, while the resistance zone remains an important area for any potential breakout. The highlighted liquidity area around 320 also stands out as a key structural level
TSLA Swing IdeaAfter the MSS to the downside, I’m looking for TSLA to retrace back into the imbalance / FVG around the $364–$370 area.
If price delivers into that zone and shows rejection, I’ll be looking for shorts, targeting the low-resistance sell-side liquidity below. The idea is that once price reprices into the imbalance, there’s a cleaner path lower toward those resting lows.
I’m not looking to chase price down here - I’d rather see the retracement into the FVG first, then look for confirmation that se
TSLA | Breaker Block Retest — The Liquidity Sits BelowBy analyzing the #TSLA (Tesla) chart on the 4H timeframe, we can see a market that has already changed hands. The uptrend that carried price through spring broke down in a single violent move, and what looks like a recovery right now is price returning to the scene of that break rather than repairing it.
4H Timeframe
The context matters here. Through April and May, TSLA was in a clean bullish sequence — a CHoCH to the upside, then repeated BOS confirming buyers were setting the terms, carrying
Tesla Tests Key Resistance — Can Bulls Break Higher?Market Structure
Tesla remains in a medium-term recovery trend on the 4-hour chart after staging an impressive rebound from the late-July lows. The sequence of higher highs and higher lows remains intact, although the recent rejection near 380.00 suggests buyers are facing stronger selling pressure. Overall, the structure remains constructive while price continues to trade above key support.
Market Sentiment – Moderately Bullish
Market sentiment remains cautiously bullish. Buyers continue
Tesla: RejectedTesla stock has recently approached the $389.31 resistance twice, but was then rejected by this level and pulled back down. These recent sell-offs align with our Primary Scenario, which continues to project a lower low as part of the ongoing intermediate correction. Primarily, we place TSLA in the final downward wave, which should target the larger low of the current intermediate correction. We forecast this to form at slightly lower levels (at the deactivated Long-Term Entry Range). After that,
Tesla Bear Flag (Bearish) situation detected
www.tradingview.com
A possible Bear Flag pattern is still in play. This will suggest in a -25% to -30% drop within weeks
We keep our short positions strong, and are ready to short more if succesfull BF. We have no reason to go long now.
The trend is your friend. No financial advice.
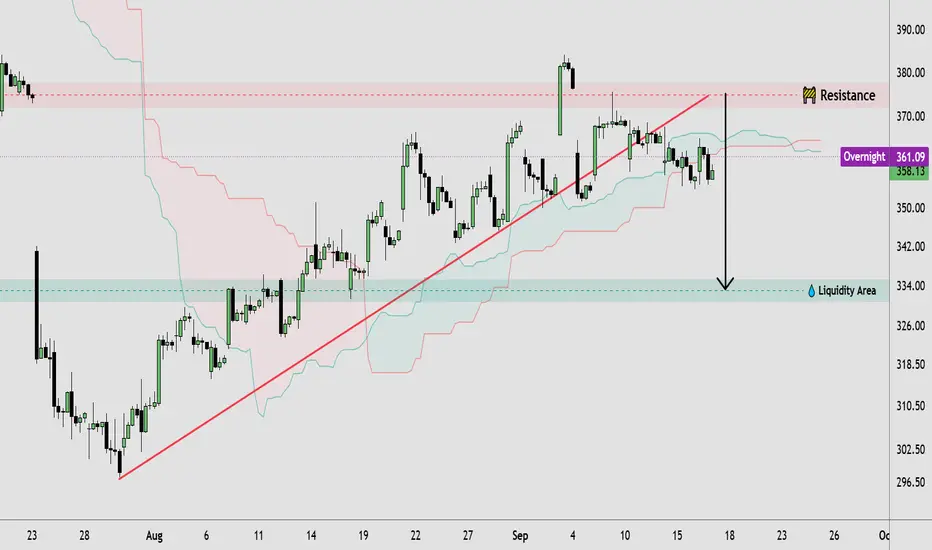
TSLA | Resistance Rejection & Liquidity Retest🔹 TSLA price action shows a broader upward market structure, with higher highs and higher lows developing from the August low. Price has recently consolidated beneath the highlighted resistance zone around 373–377, following a rejection from the 380+ area. The rising trendline continues to support the structure, while the current consolidation suggests a period of balance before the next directional move. The nearby liquidity area around 333–335 remains an important downside reference if selling
Tesla's Decline Toward $285 — A Deeper Correction ScenarioIf Tesla breaks below the $365.75 support level, selling pressure could intensify and open the path down to $285.
The Q3 sales report on October 2 is the key risk event; disappointment on deliveries or margins could act as the catalyst for the correction.
With a forward P/E above 210 and a PEG ratio near 9.3, the stock still carries a heavy growth premium that becomes sharply vulnerable if growth expectations slow.
Price target cuts from analysts like BNP Paribas (down to $268) suggest part of t
Tesla — The Bull Activator Is Back in Play⚡ Tesla has been recovering strongly from the major selloff and has now built a broad sideways structure between the key zones.
The recent rejection from the upper zone has pushed price back toward the middle of the range, but the bigger structure remains interesting as long as the lower zone continues to hold.
🏆 Previously:
📈 Bullish scenario
The most important bullish signal on the chart is the bull activator around the kink and Dynamic SR area. A clean reclaim of this structure wo
TSLA: Can $367 Hold? September 28–October 2
Tesla is on my trading list this week as its daily recovery meets a sharp breakdown on the lower timeframes. The main question is whether the current pullback becomes a successful retest of the daily trendline or develops into a failed breakout.
My thesis is conditional: the broader recovery still has a chance while the $365–$368 area holds, but immediate momentum favors sellers. Buyers need to reclaim $373–$375 first, then $377.50–$380, to make the bullish case stronger.
Catalysts this week
Tesla Elliott Wave Analysis: Bulls Attempt to Regain ControlTesla sold off aggressively in July following a disappointing earnings report, breaking below the 335 support and extending the deeper correction from the December highs. However, we still think this decline can be counted as wave C within a larger corrective structure.
Price is now reversing from the lower boundary of the declining channel, while the earnings gap has been filled and the bullish level was also tested. This opens the door for bulls to take control with wave 1 of a new five-wave
TSLA: weekly uptrend signal fired, bottom-picking entryGM lads,
TSLA fired a weekly uptrend signal this week. Price traded through 384.34, the range-expansion trigger for the week in progress, with 344.20 as the lower level. Long here at 381ish.
The signal holds while the week stays above last week's close, 364.27. A down close for the week would end it. Stop is 340.32, about 11% below entry, so I'd size for 1-2% of capital at risk there.
I'm treating it as a bottom-picking entry. The weekly is in, but what I'm really after is a monthly or quarte
TSLA short Trendline break + retest, daily Resistance
Short Entry 366
Stop 385
Target 340, 300
Risk management is much more important than a good entry point.
I am not a PRO trader. About 25% of my trades had been stopped quickly.
2026-12-18 PUT butterfly
BuyToOpen P270/295/320, 2.35 (P 320 Delta= -0.22)
no Stop in this option plan, max risk is 2.35.
TSLA — Bullish Reversal in ProgressThe current move is a bullish reversal from the $297.38 low, with price progressively moving higher.
The key area I’m watching is $433.41.
Price is currently moving toward this level, which represents an important area of interest within the broader structure.
My expectation is for the bullish reversal to continue toward $433.41. Once price reaches this area, I’ll be watching for confirmation that the bullish move has completed and the bearish move is ready to resume.
Key level: $433.41
Curr
HOW-TO: Read MSL Profit Navigator Signals📌 Overview
This educational example uses the TSLA 1-hour chart to explain how MSL Profit Navigator displays trend state, confirmed signals, ATR-based targets and dynamic stop outcomes.
The chart contains different completed LONG and SHORT scenarios. The current dashboard shows TREND: UP and Status: WAIT, meaning that the broader indicator state is bullish but no signal scenario is currently active.
The purpose of this publication is to explain how the visual elements work together. It is not a c
TSLA $432 Short-Mid Term TargetLooking at the weekly chart, I like that the weekly FVG held and price did not go below the 50% CE. I think the red weekly (bearish) FVG inverts into a bullish FVG and then runs to $432 as the first target and later to $453 for target2.
Already in TSLA with shares and cash secure puts, possibly will enter with calls if the bearish FVG inverts to a bullish FVG
TSLA Sept. 14–18: 360 Support vs. 370 Resistance Sets Up the Next Move
Tesla enters the new week around 365 after recovering strongly from the July low near 297. The Daily chart shows that the recovery is still intact, but TSLA has now reached an important resistance area where buyers have struggled to push price higher. The 1H chart confirms that price is consolidating rather than trending, while the GEX map places TSLA between the 362.5 HVL and a major call structure around 370.
For me, 360 to 370 is the key decision range for S