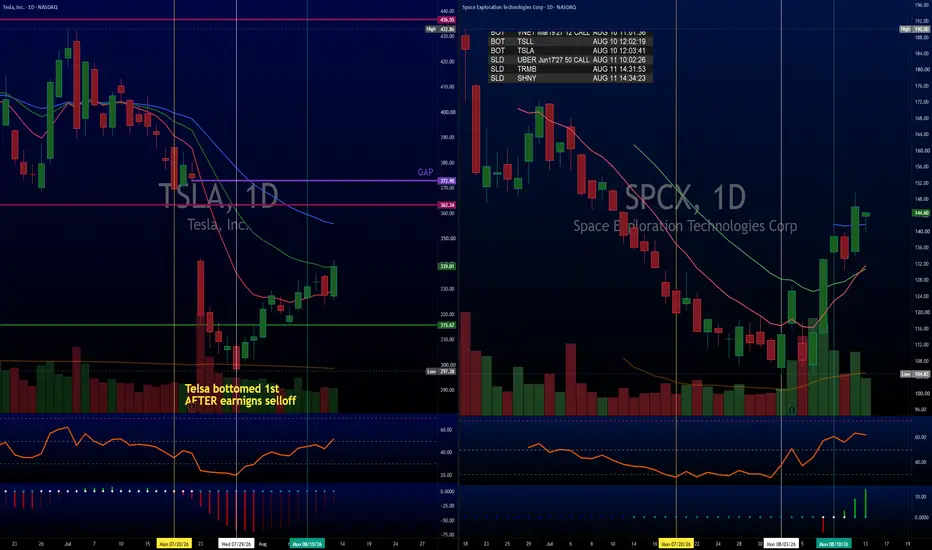
 SPCX Technical Setup
Strong momentum reversal: The chart setup has improved significantly after finding support near $105.
TTM Squeeze: Turned green, shows active increase in buying momentum.
RSI indicator: Leading the recovery, crossing above 50 and holding higher for multiple sessions.
Moving averages: Price reclaimed short term trend lines with a clear bullish crossover.
 TSLA Technical Setup
Catching up: TSLA set its floor first after the post earnings selloff and is steadily building higher lows.
RSI indicator: Strengthening quickly as it crosses back above the key 50 level.
TTM Squeeze: Histogram turned blue, which gives a green light that negative pressure is fading.
Moving averages: Trading above short term support lines, with a full bullish crossover remaining the next milestone.
The Takeaway
SPCX showed a sharper short term bounce, but TSLA continues to look like the better risk to reward play. Entering around the August 10 consolidation zone near $329. TSLA sits right underneath an unfilled earnings gap with proven fundamental support, making it the preferred core hold. OPINION.
TGtg!

منشورات ذات صلة
إخلاء المسؤولية
لا يُقصد بالمعلومات والمنشورات أن تكون، أو تشكل، أي نصيحة مالية أو استثمارية أو تجارية أو أنواع أخرى من النصائح أو التوصيات المقدمة أو المعتمدة من TradingView. اقرأ المزيد في شروط الاستخدام.
منشورات ذات صلة
إخلاء المسؤولية
لا يُقصد بالمعلومات والمنشورات أن تكون، أو تشكل، أي نصيحة مالية أو استثمارية أو تجارية أو أنواع أخرى من النصائح أو التوصيات المقدمة أو المعتمدة من TradingView. اقرأ المزيد في شروط الاستخدام.