
Market Structure
• Medium-term trend remains bullish
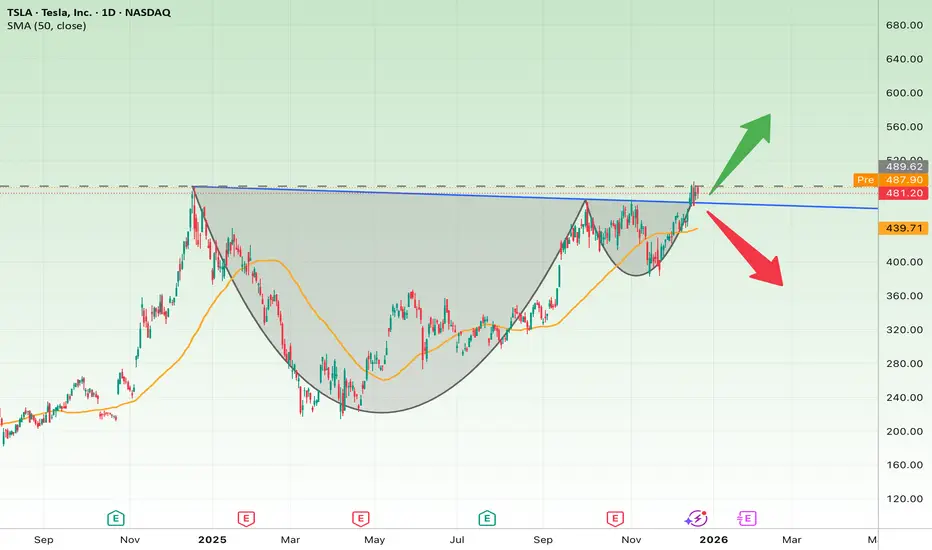
• Price is holding above the 50-day SMA (~$440) → trend is still valid
• TSLA is testing a major horizontal + dynamic resistance zone (480–490)
Key Pattern
• A clear Cup & Handle formation
• The rim of the cup aligns with current resistance
Bullish Scenario (Primary)
If TSLA:
• Breaks and holds above $490
• Confirms breakout with volume
Targets:
• 🎯 Target 1: $520–540
• 🎯 Target 2: $580–600
• Confirms continuation of the larger uptrend
Bearish / Pullback Scenario
If:
• Price gets rejected from the resistance zone
Key Supports:
• First support: $440–445 (50 SMA)
• Major support: $400–410
• Breakdown below → deeper correction toward ~$360 possible
Conclusion
• TSLA is at a critical decision level
• Breakout favors bulls
• Rejection leads to a healthy pullback within an uptrend

إخلاء المسؤولية
لا يُقصد بالمعلومات والمنشورات أن تكون، أو تشكل، أي نصيحة مالية أو استثمارية أو تجارية أو أنواع أخرى من النصائح أو التوصيات المقدمة أو المعتمدة من TradingView. اقرأ المزيد في شروط الاستخدام.
إخلاء المسؤولية
لا يُقصد بالمعلومات والمنشورات أن تكون، أو تشكل، أي نصيحة مالية أو استثمارية أو تجارية أو أنواع أخرى من النصائح أو التوصيات المقدمة أو المعتمدة من TradingView. اقرأ المزيد في شروط الاستخدام.