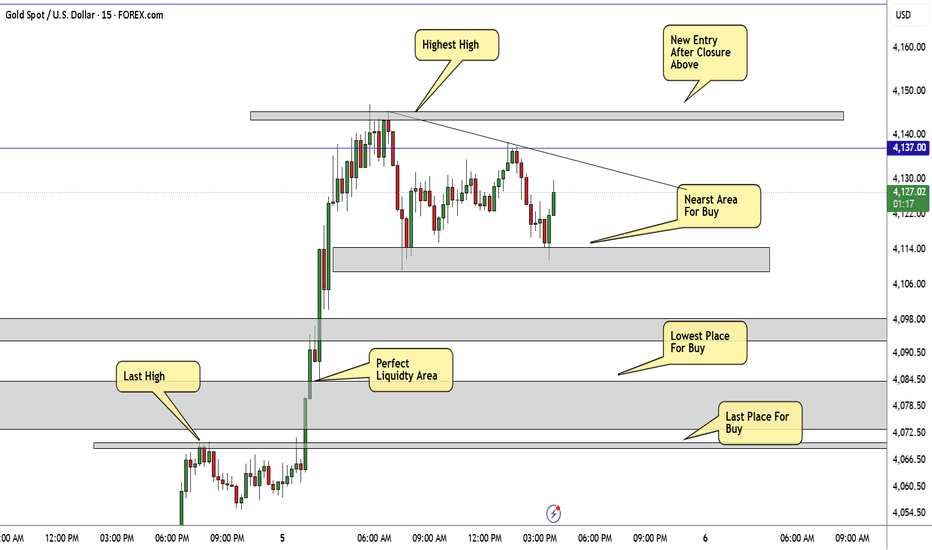
GOLD Very Bullish , Best Places For Buy Spotted , 2000 Pips !Here Is My 15 Mins Gold Chart , After we entered 2 long entries , now the price broke all res on his way and make a new high since 2 weeks , so now we have 3 places we can waiting the price to can enter a buy trade and moving with the new movement , first one will be the nearest area for buy around 4116.00 / 4110.00 , this is the support created today and the price touched it 2 times and bounced very good from it so it will be our nearest area for buy and we can targeting the highest high and if
Community ideas
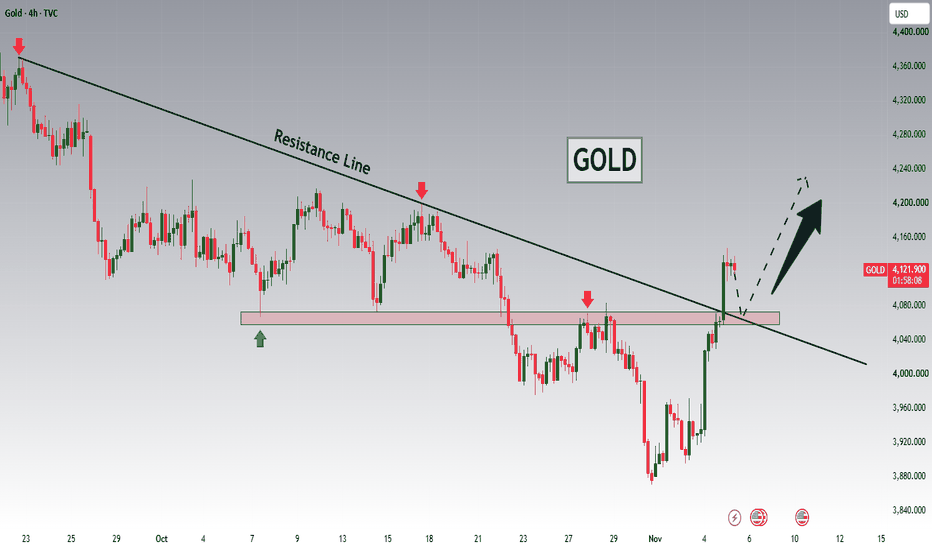
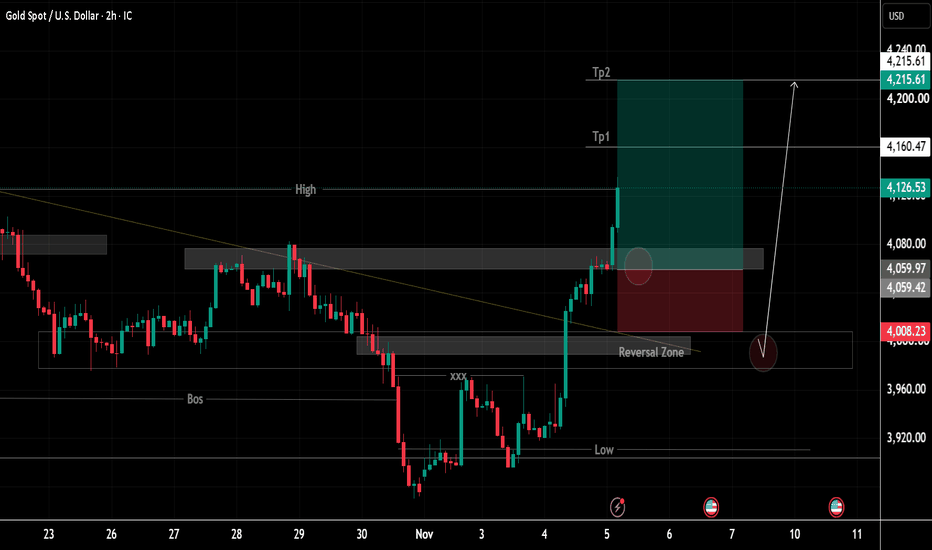
GOLD Price Update – Clean & Clear ExplanationGold is showing strong bullish momentum after a significant recovery from the 3,900 support region and buyers have successfully pushed price above the previous descending trendline and broken through the key resistance zone around 4,060–4,080.
The main focus Price is showing strong bullish momentum following a combination of fundamental developments and technical breakouts in the financial markets. The recent movement in Gold is attracting attention as investors react to changing US political a
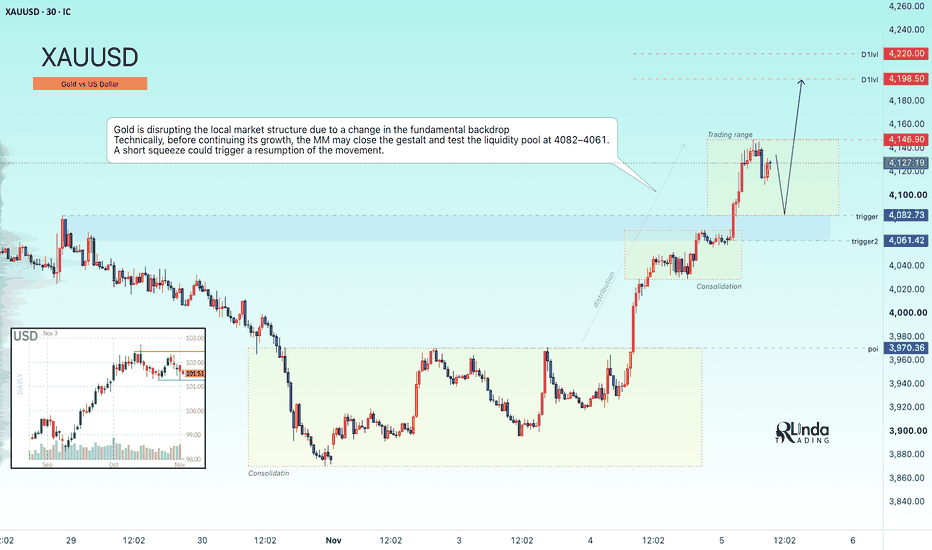
GOLD - The rally may continue after the correctionIC:XAUUSD rose to nearly $4,135 in the Asian session on Thursday, reaching a two-week high. Support comes from falling US bond yields and a weaker dollar after the Democrats’ victory in both chambers of Congress.
Falling oil and a weaker dollar give the metals market a chance; it is breaking the structure of the downtrend and entering a rally phase. The resistance zone of 4200–4220 can serve as an area of interest. The key trigger is Friday’s October Nonfarm Payrolls (NFP) report. ADP for
GOLD Breakout and Potential Retrace!Hey Traders, in today's trading session we are monitoring XAUUSD for a buying opportunity around 4060 zone, Gold was trading in a downtrend and currently is in a correction phase in which it is approaching the retrace area at 4060 support and resistance area.
Trade safe, Joe.
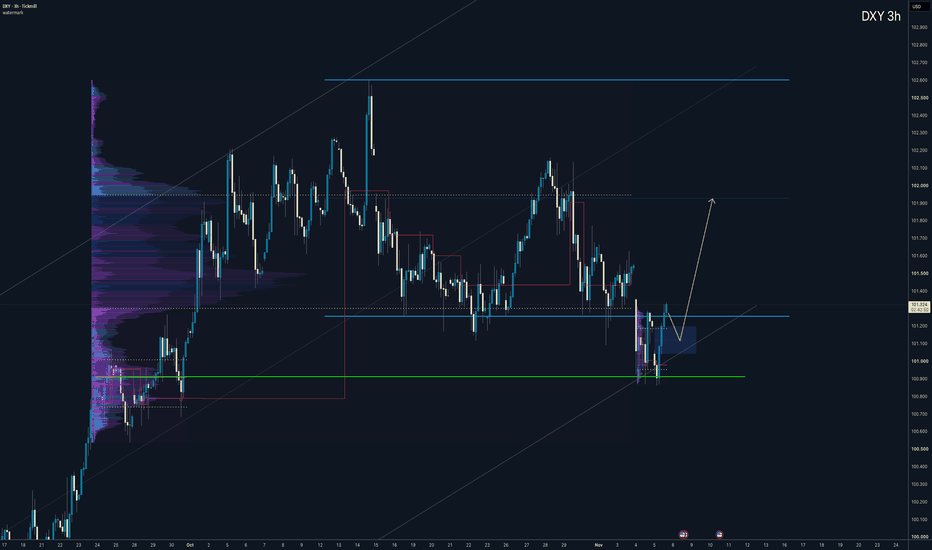
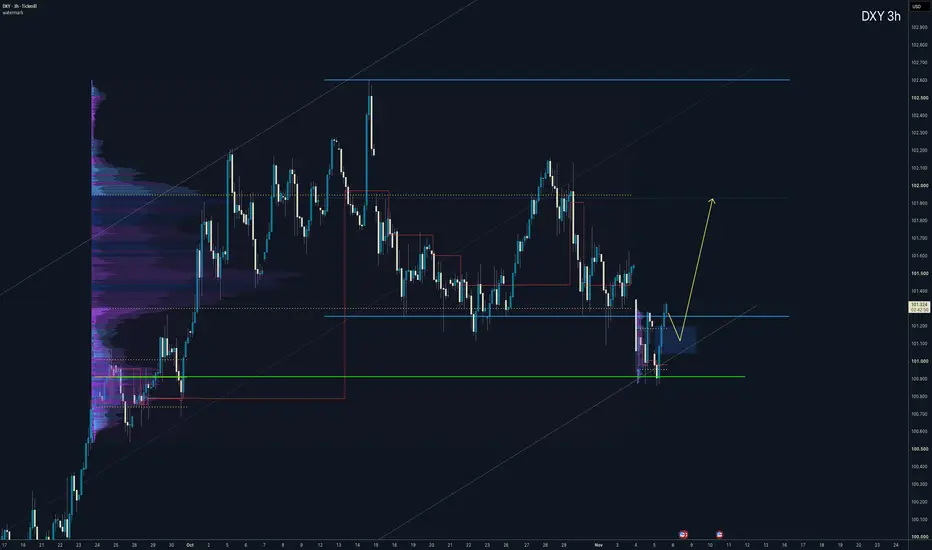
Dollar - Weekly CLS - Model 1Hi Friends, New CLS Range has been created and Im looking for Long Model 1 trade setup. As always after the manipulation in to the Key Level, below the CLS range and reaction, we need to see a confirmation switch from the manipulation phase - CIOD (change in order flow) in the the expansion.
⏳ Stay patient and enter only after candle close.
🎯 Target: 50% of the CLS range.
🎥 CLS Model 1 Video Explanation 📚 Bullish CLS Strategy Structure ⚠️ Risk Control is Key to Long Term Success
XAUUSDHello Traders! 👋
What are your thoughts on Gold?
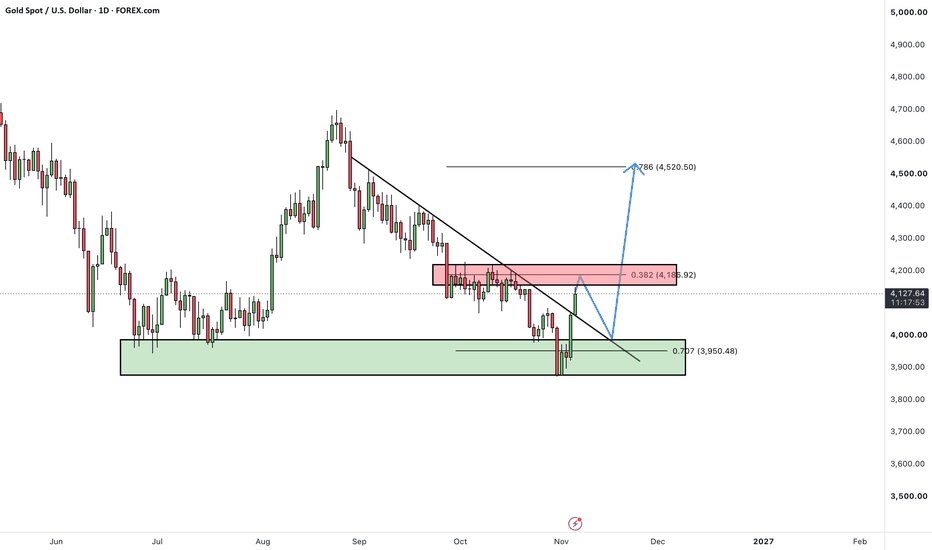
Gold has staged a recovery after breaking below the key $4,000 level last week. During the current week, buyers stepped in around the support zone, pushing prices back above the psychological $4,000 level.
More importantly, price has now broken above its descending trendline, indicating a potential shift in short-term market momentum.
However, with Gold approaching the key resistance area around $4,180–$4,200, a corrective move is anticipated
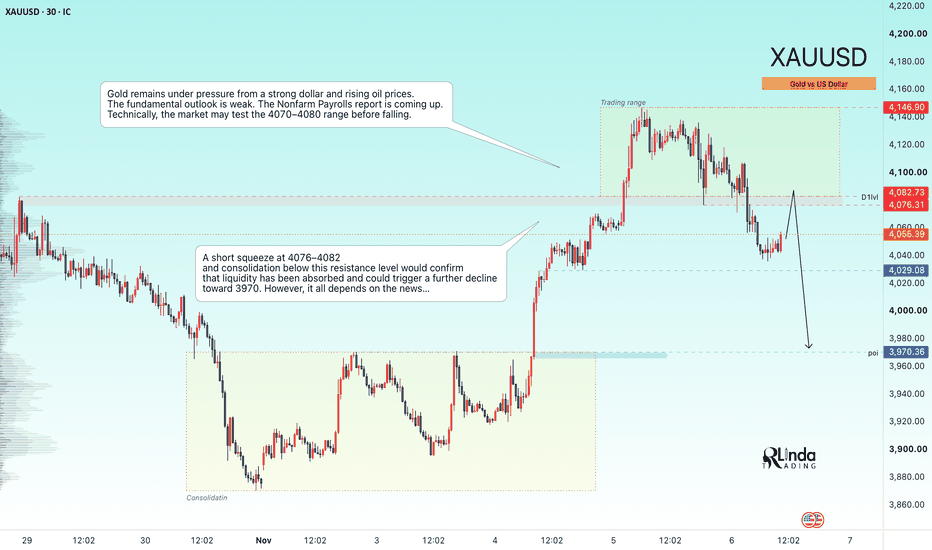
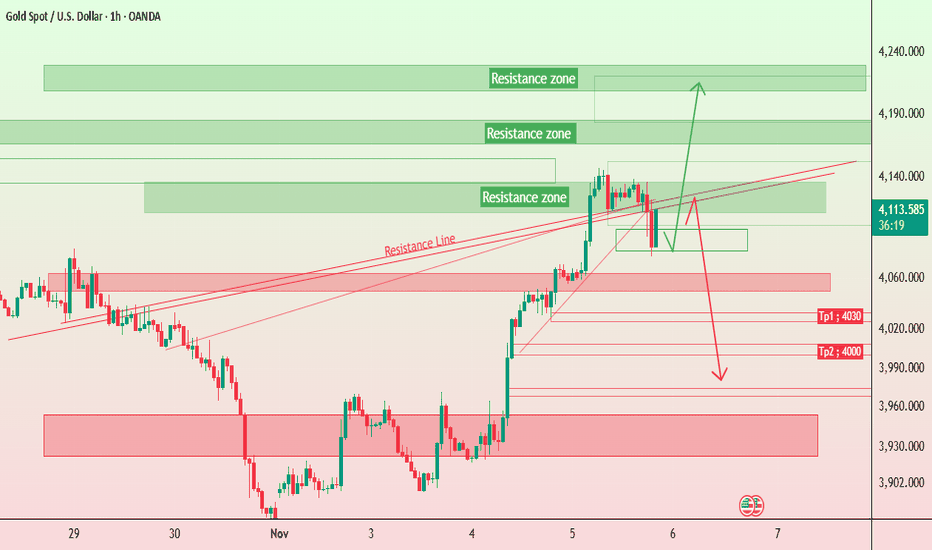
GOLD - The bearish trend continues. The NFP is coming upIC:XAUUSD remains in a downtrend, with the market selling off gains during the Asian session following the announcement of the Democrats' victory. The key risk for today is the Nonfarm Payrolls report
The dollar and oil are rebounding, while pressure on the gold market persists, as does the overall trend.
The key trigger is the NFP report. The data may have a limited impact on Fed expectations, as officials are concerned about persistent inflation and labor demand remains stable. Weak dat
GBP/USD Wedge Breakout PatternSetup Overview
GBP/USD is clearly showing signs of weakness following its failure to hold the advance inside the rising wedge. Price has been repeatedly rejected near the 1.3490–1.3504 resistance area, indicating that the buying is clearly starting to run out of steam.
Current price is around 1.3455 and the developing bearish structure is clearly pointing to a potential continuation of the downside. We're looking for a clean break below the wedge support, followed by a failed retest.
The down
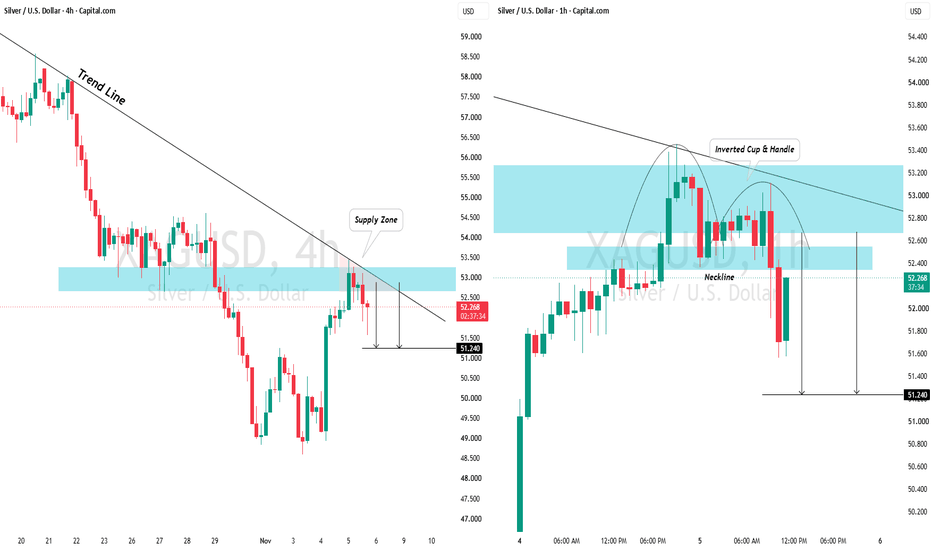
SILVER (XAG/USD): Strong Intraday Bearish SignalIt appears that 📉Silver may continue falling from the current falling trend line and horizontal resistance level on an intraday chart.
I see a clear significant bearish signal on the hourly time frame, specifically a bearish breakout from the neckline of an inverted cup and handle pattern.
The price may potentially retrace to at least 51.13.
USD/JPY – Triangle Breakout PatternSetup Overview
USD/JPY is forming a fairly well defined symmetrical triangle breakout on the daily chart, price having been gradually consolidating between the descending resistance and the rising support.
The lower highs and higher lows indicate we're approaching a decision point. Buyers are clearly trying to get some momentum in near the top of the range and the rising trendline is still providing some solid structure.
The bullish set up is starting to look interesting but the breakout sti
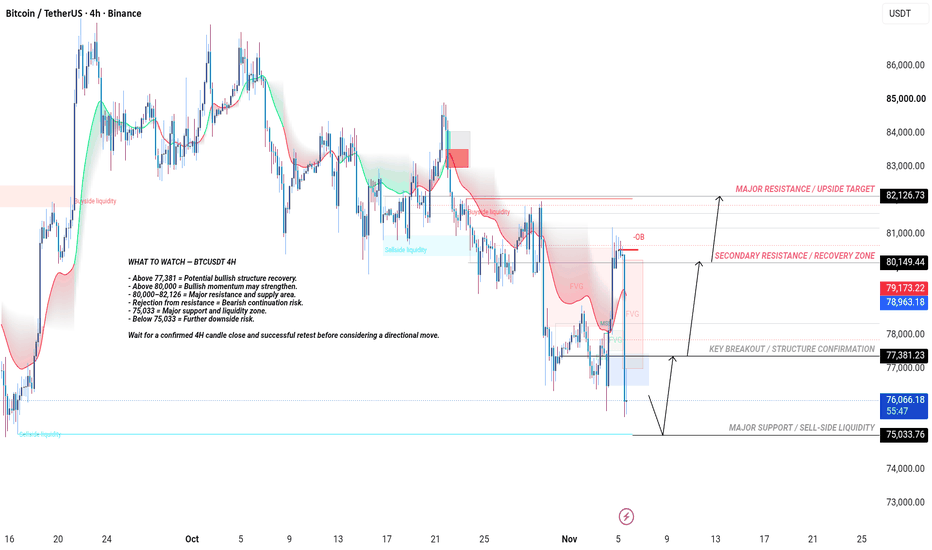
BTCUSDT 4H Analysis | Liquidity Sweep & Bullish RecoveryBTCUSDT 4H Analysis | Sell-Side Liquidity Sweep & Potential Bullish Recovery
1. Market Overview
Bitcoin (BTCUSDT) is showing signs of a potential bullish recovery on the 4-hour timeframe. The chart highlights an important liquidity area near 75,033, where price may attract sell-side liquidity before attempting a stronger upward move.
The projected bullish scenario focuses on a possible liquidity sweep, followed by a recovery toward 77,381, 80,000, and potentially 82,126.
The key question is
XAU/USD: COILED AT 4,100 — READY TO SPRING TO 4,282? By Leo · 05 November 2026
🧭 What is the chart telling us?
Look straight at the chart: price is sitting at 4,126.77 — right in the middle of the sideways band 4,100–4,143. That detail matters, because it confirms exactly what I've been saying: the market hasn't picked a side yet. It's still coiling, waiting for the news.
The structure on the chart is hand-drawn, pure price — no EMA, no RSI, no volume. Four tiers of levels:
🔹 4,183–4,219 — first supply zone, projected peak around 4,195 🔹 4,123
XAUUSD /GOLD Gold is currently trading around 4,087, following a strong bullish recovery. However, price is facing selling pressure near the 4,110–4,140 resistance zone, where buyers are struggling to maintain upward momentum. The recent rejection suggests that Gold may experience a short-term correction before its next major move.
Market Bias: Gold is approaching a critical support area around 4,080–4,100. If buyers defend this zone, a bullish recovery could push price toward 4,140, followed by 4,180–4,190
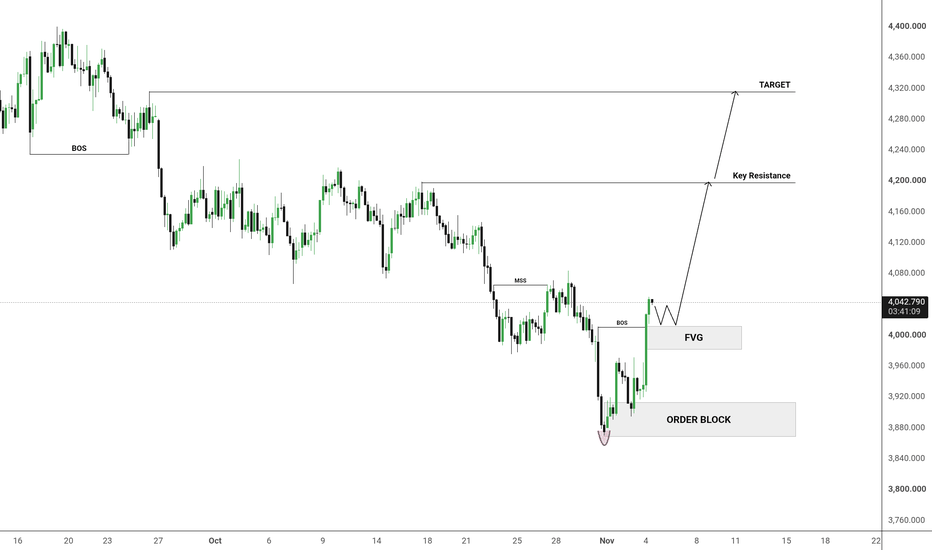
XAUUSD 4H: Liquidity Sweep, Bullish MSS & FVG ReclaimXAUUSD 4H | ICT Liquidity Sweep, Market Structure Shift & Bullish Expansion
Market Structure & Institutional Price Action
Gold has experienced a prolonged bearish movement from the upper price region, forming a sequence of lower highs and lower lows. However, the recent reaction from the lower Order Block area introduces an important development in the short-term market structure.
This analysis combines ICT concepts, Smart Money Concepts (SMC), liquidity theory, market structure, Fair Value G
A Rising Wedge, a Fading Rally, and a Decision ApproachingHello traders! Here’s my technical outlook based on the current EURUSD (1H) chart structure. EURUSD previously turned around from the Seller Zone and formed an ascending wedge pattern. Price then tested the upper boundary and is showing signs of rejection.Currently, EURUSD is trading below the 1.1280 Seller Zone while holding above the 1.1220 Buyer Zone. The ascending wedge pattern suggests a possible continuation of the decline toward support.As long as EURUSD remains below the 1.1280 Seller Zo
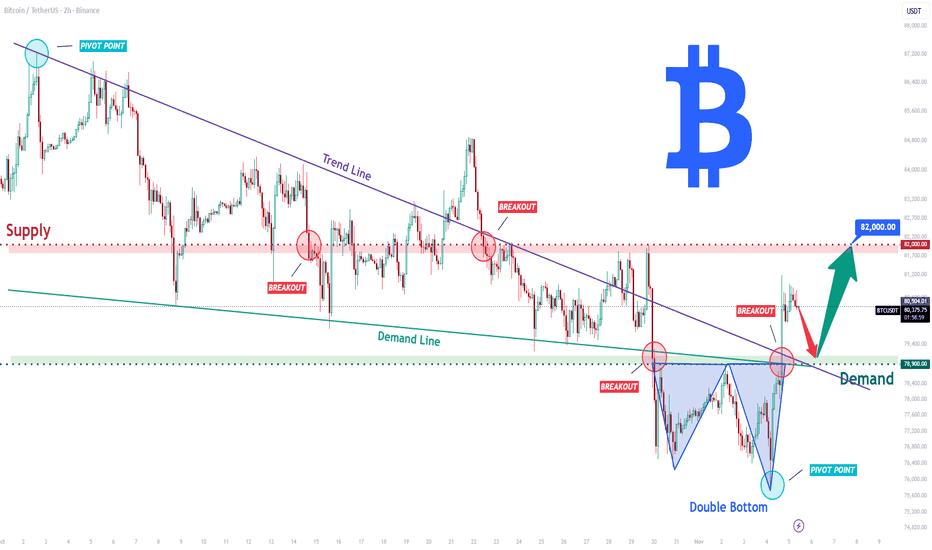
BTCUSDT Long: Double Bottom Pattern Signals a Possible RecoveryHello traders! Here’s my technical outlook based on the current BTCUSDT (2H) chart structure. BTCUSDT previously declined under the Trend Line and formed a Double Bottom near the Demand Zone. Price then bounced, showing signs of buyers stepping in.
Currently, BTCUSDT is trading below the 82,000 Supply Zone while holding above the 78,900 Demand Zone. The completed Double Bottom and recent bounce from support suggest buyers are preparing for another move higher.
As long as BTCUSDT remains above
Bitcoin Time to Test major Fibonacci levelsSummary
Fibonacci retracement levels are among the most important tools for identifying where a correction may end and where the trend may resume. In my view, the 0.5 and 0.618 levels are the last and most significant support or resistance zones because shallower corrections often react unpredictably and rarely give a clean opportunity to enter with the trend. Levels beyond 0.618, such as 0.786, sit too close to the start of the original move, which means the correction has almost erased the en
GBPUSD 1H: Resistance Rejection Signals Potential Bearish PullbaGBPUSD 1H: Resistance Rejection Signals Potential Bearish Pullback
GBPUSD is facing selling pressure near the 1.3500–1.3520 resistance zone after a strong bullish recovery. Rejection from this supply area could trigger a bearish correction toward the marked support levels, while sellers remain in control below resistance.
📉 Bearish Path
🎯 Objective 1: 1.3360
🎯 Objective 2: 1.3280
🛡️ Key Resistance Zone
The 1.3500–1.3520 area remains the major resistance zone. Failure to break above this regio
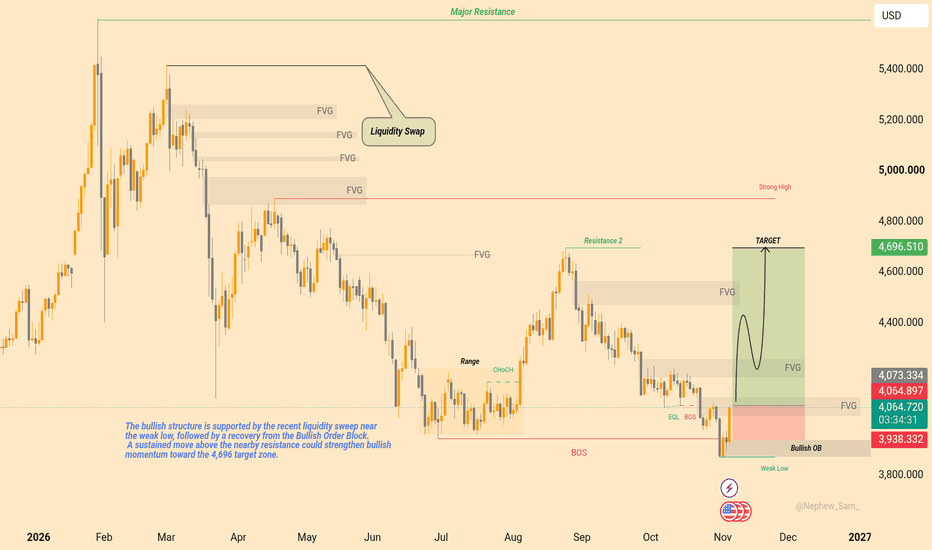
XAUUSD Analysis | Liquidity Sweep and Potential Bullish Reversal
This analysis focuses on Gold (XAUUSD) using Smart Money Concepts (SMC), liquidity, market structure, Fair Value Gaps (FVGs), and Order Block analysis.
Gold is currently trading around the 4,066 region after experiencing significant selling pressure. Recent price action shows a possible recovery from the lower support area, where a liquidity sweep and reaction from the Bullish Order Block have been highlighted.
The main focus is whether buyers can maintain this recovery and establish sufficie
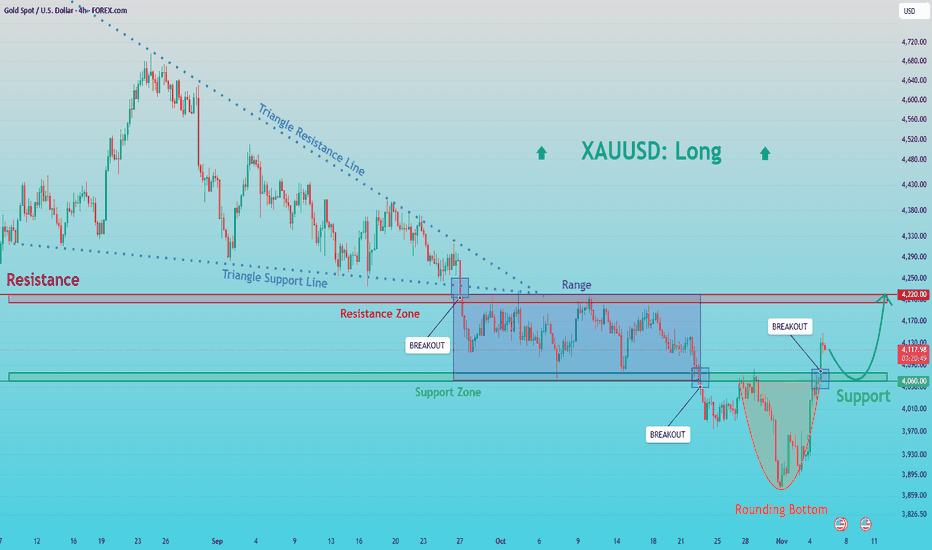
XAUUSD: Rounded Base Gives Gold a Fresh Technical FoundationHello everyone, here is my breakdown of the current XAUUSD setup.
Market Analysis
XAUUSD previously traded inside a triangle structure before entering a range. Price then formed a Rounding Bottom near the Support Zone and broke higher, showing signs of buyers stepping in.
Currently, XAUUSD is trading below the 4,220 Resistance Zone while holding above the 4,060 Support Zone. The completed Rounding Bottom and recent rebound from support suggest buyers may attempt another move higher.
My Scen
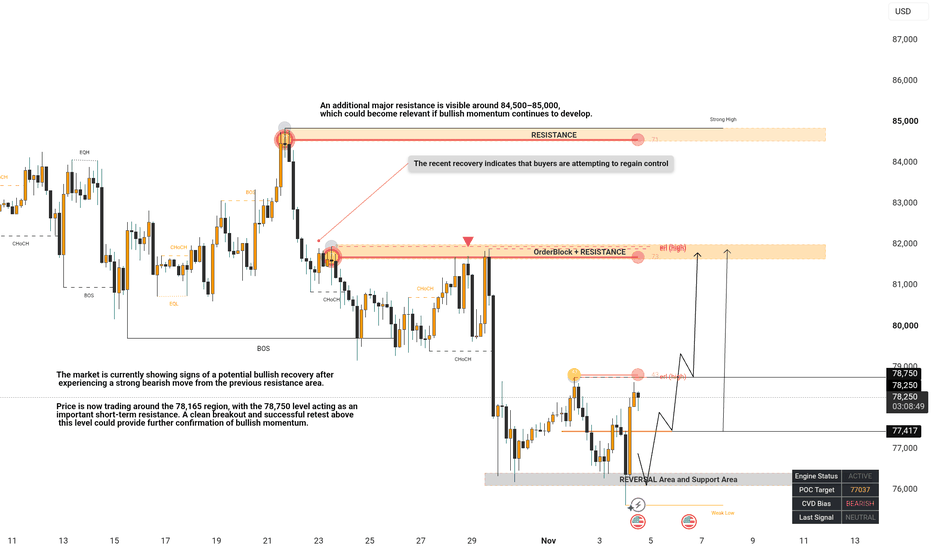
Btcusd Bullish Recovery Setup & Key Resistance ZonesMarket Structure Analysis | Bullish Recovery Setup & Key Resistance Zones
The market is currently showing signs of a potential bullish recovery after experiencing a strong bearish move from the previous resistance area. Price has reacted from the lower support and reversal zone, where buyers have started showing interest. The recent price action suggests that the market may be preparing for another upward move, but confirmation is still important before expecting a sustained bullish continuatio
1INCH Looks Bearish (8H)It appears that a bearish Diametric pattern is forming on 1INCH, with wave D nearing completion. We expect the price to potentially start moving downward soon as wave E begins, targeting the lower levels marked on the chart.
For this bearish scenario to remain valid, the price must respect the invalidation level. A confirmed 4H candle close above this level would invalidate the current analysis and challenge the expected wave structure.
As long as the invalidation condition remains intact, our
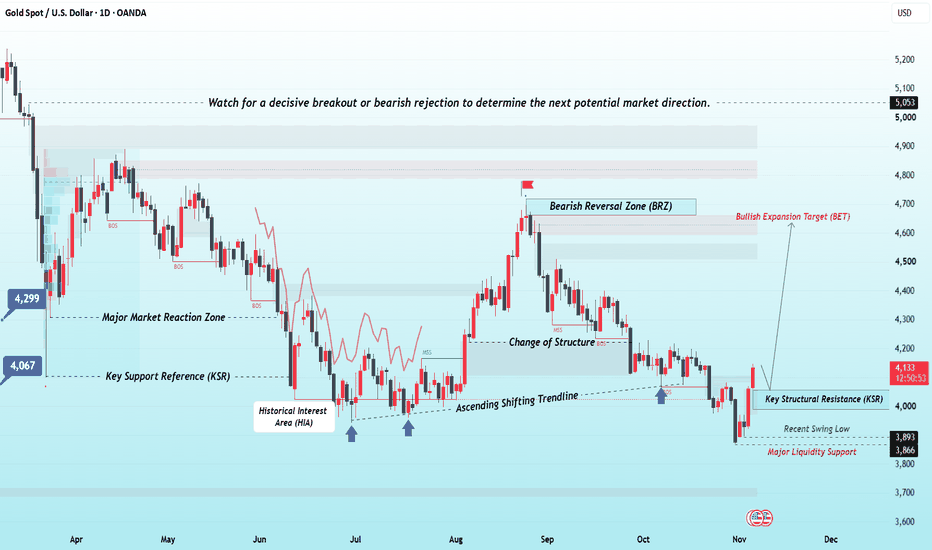
Institutional Zones, Liquidity & Bullish Expansion TargetsThis analysis highlights the current Gold (XAUUSD) market structure, focusing on institutional price zones, liquidity levels, key support and resistance, and potential upside opportunities.
The 4660 level represents a major bullish expansion target, while 4299 and 4026 serve as important structural reference levels. The 4067 zone highlights a key support area where price reactions may provide insight into market strength.
On the downside, 3893 and 3866 are important levels to monitor for suppo
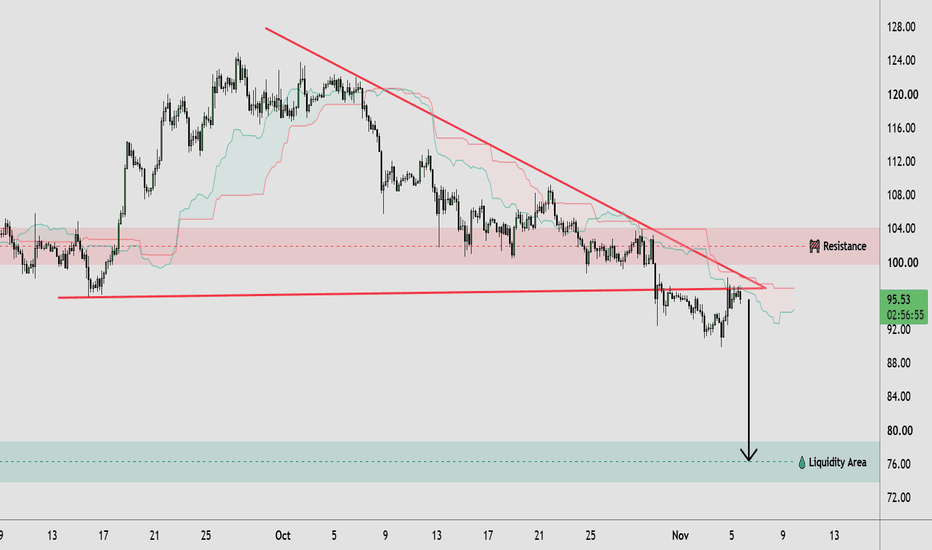
SOLUSDT Bearish Breakdown: $76 Liquidity Zone in Focus🔹 SOLUSDT Technical Analysis: Solana continues to show a bearish market structure, with consistent lower highs and lower lows forming beneath a descending resistance trendline. Price has broken below the key horizontal support around $95–$96, which previously acted as an important structural level. The recent recovery appears to be facing selling pressure near the broken support, while the $100–$104 resistance zone remains a significant barrier for buyers. This price action suggests that bearish