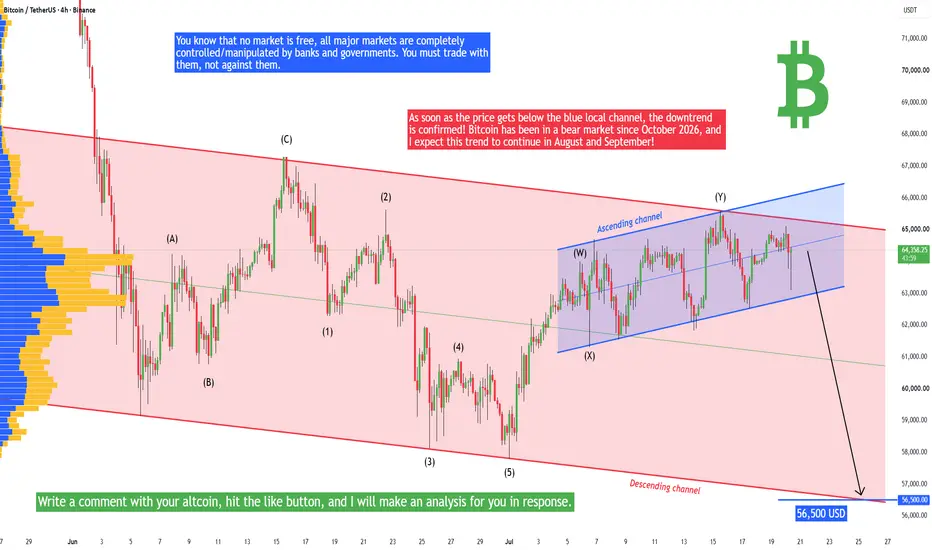
Bitcoin - Starting another big drop! 56k soon (42k then?)Bitcoin will soon enter a capitulation phase. Right now it's a good time to sell or short Bitcoin on futures. Why? The current price is at the top of the channel, which acts as a strong resistance. As soon as the price gets below the blue local channel, the downtrend is confirmed! Bitcoin has been i
Compare with BTC/USDT
Profile
Bitcoin, the first and most popular cryptocurrency, is known for its price volatility driven by institutional demand, regulations, and global events, while Tether (USDT) is widely used as a stable trading pair to avoid converting back to fiat. Together, Bitcoin and Tether play a central role in crypto markets, with Tether’s stability supporting Bitcoin trading and influencing investor behavior.
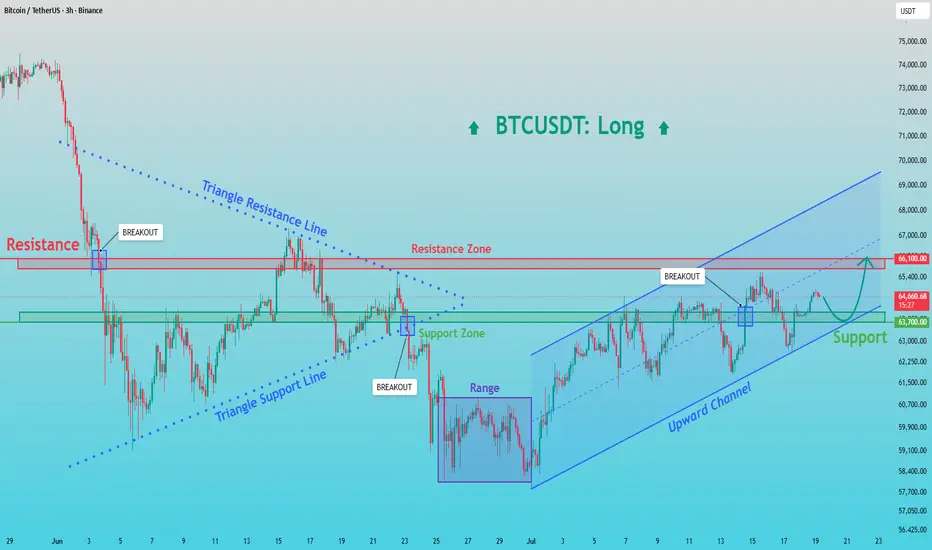
BTCUSDT: Buyers Target $66.1K After Successful Support RetestHello everyone, here is my breakdown of the current BTCUSDT setup.
Market Analysis
BTCUSDT previously traded inside a large symmetrical triangle before breaking below support, confirming a bearish move. After finding support, price consolidated inside a range and later broke higher into an ascend
Bitcoin Consolidation False break to downside Bitcoin is showing signs of short-term weakness after failing to sustain momentum near the recent highs around 64.8K–65.2K. The latest rejection suggests buyers are losing strength, allowing sellers to take control.
Keep an eye on overall market sentiment, U.S. economic data, and movements in the U
The Green Candle, is more dangerous than the red oneThe Green Candle That Could Make You Lose Everything
The moment you feel afraid of missing the move, the market may already be waiting for you.
Short-Term BTC Analysis
Bitcoin is approaching a very important resistance level, but the broader bearish move may still be far from over. I am current
BTCUSDTHello Traders! 👋
What are your thoughts on Bitcoin?
Bitcoin remains in a broader downtrend. After finding support around the $58,000 level, price has entered a corrective rally. However, this move is still considered a temporary correction within the prevailing bearish trend, with no confirmed sig
BTCUSDT Technical Outlook | Liquidity Sweep & Bullish Reversal SBTCUSDT is reacting from a key structural support following a liquidity sweep, indicating the potential for a bullish reversal. As long as price holds above the highlighted support, the technical outlook favors a recovery toward higher liquidity and resistance levels. A decisive break below support
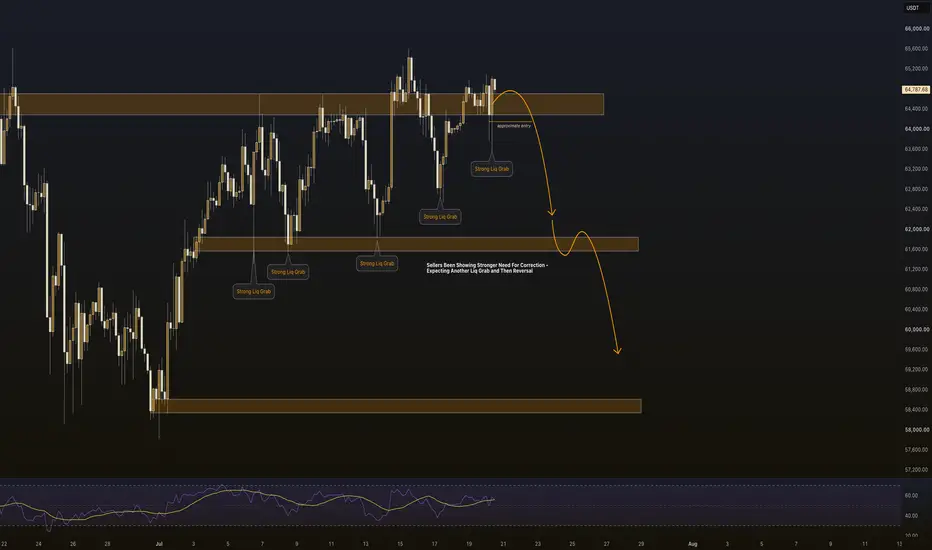
BTC – Bearish Rejection at 64,794, Eyes on 61,600 SweepBTC is printing repeated liquidity grabs into 64,794, and sellers are showing clear control heading into a correction.
Why This Level Matters:
Price keeps sweeping highs and failing to hold above the 64,400–64,794 supply zone. Each grab has ended in rejection, and momentum is now leaning firmly t
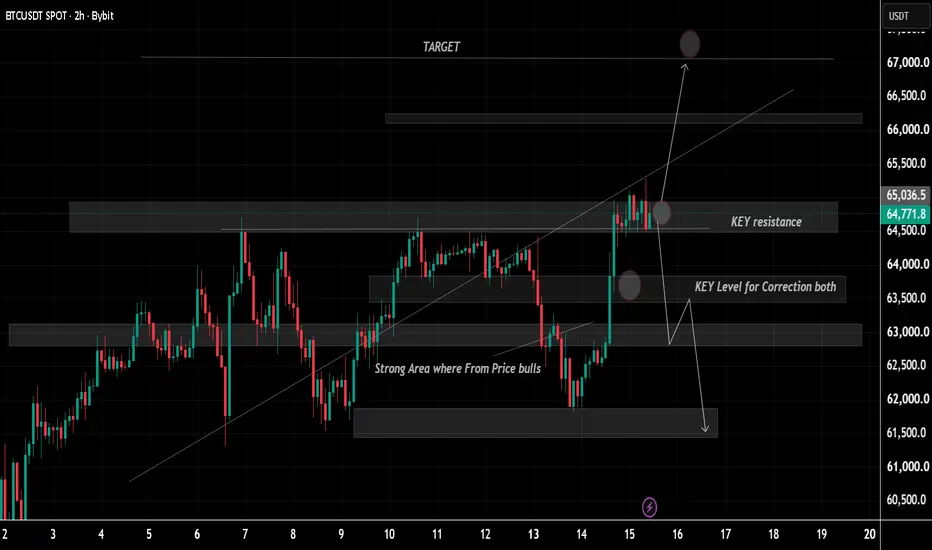
Bitcoin Price Update – Clean & Clear ExplanationBitcoin has reacted strongly from the 61,500–62,000 demand zone, where buyers stepped in and pushed the market sharply higher. This bullish momentum indicates that market sentiment remains positive, supported by continued institutional interest, ETF inflows, and improving overall crypto confidence.
BTCUSDT: Ascending Channel Confronts Supply ZoneHi!
Pattern: Price is moving inside an ascending channel and has completed a three-drives pattern.
Zone: The market is hitting a major Supply & Demand (S&D) zone at $65,600, showing signs of rejection.
Bias: Bearish. The focus is on short positions aiming for the lower channel support near $62,50
Bitcoin Retests Buyer Zone Inside an Ascending ChannelHello traders! Here’s my technical outlook based on the current BTCUSDT (1H) chart structure. BTCUSDT previously formed a Rounding Bottom, signaling the end of the previous decline and the beginning of a bullish recovery. Price later entered a broad ascending channel, repeatedly reacting between the
See all ideas
Summarizing what the indicators are suggesting.
Oscillators
Neutral
SellBuy
Strong sellStrong buy
Strong sellSellNeutralBuyStrong buy
Oscillators
Neutral
SellBuy
Strong sellStrong buy
Strong sellSellNeutralBuyStrong buy
Summary
Neutral
SellBuy
Strong sellStrong buy
Strong sellSellNeutralBuyStrong buy
Summary
Neutral
SellBuy
Strong sellStrong buy
Strong sellSellNeutralBuyStrong buy
Summary
Neutral
SellBuy
Strong sellStrong buy
Strong sellSellNeutralBuyStrong buy
Moving Averages
Neutral
SellBuy
Strong sellStrong buy
Strong sellSellNeutralBuyStrong buy
Moving Averages
Neutral
SellBuy
Strong sellStrong buy
Strong sellSellNeutralBuyStrong buy
Displays a symbol's price movements over previous years to identify recurring trends.
Frequently asked questions
The current price of Bitcoin / TetherUS (BTC) is 66,465.58 USDT — it has risen 0.41% in the past 24 hours. Try placing this info into the context by checking out what coins are also gaining and losing at the moment and seeing BTC price chart.
Bitcoin / TetherUS price has risen by 5.11% over the last week, its month performance shows a 1.90% increase, and as for the last year, Bitcoin / TetherUS has decreased by −43.32%. See more dynamics on BTC price chart.
Keep track of coins' changes with our Crypto Coins Heatmap.
Bitcoin / TetherUS (BTC) reached its highest price on Oct 6, 2025 — it amounted to 126,199.63 USDT. Find more insights on the BTC price chart.
See the list of crypto gainers and choose what best fits your strategy.
Bitcoin / TetherUS (BTC) reached the lowest price of 3,156.26 USDT on Dec 15, 2018. View more Bitcoin / TetherUS dynamics on the price chart.
See the list of crypto losers to find unexpected opportunities.
The safest choice when buying BTC is to go to a well-known crypto exchange. Some of the popular names are Binance, Coinbase, Kraken. But you'll have to find a reliable broker and create an account first. You can trade BTC right from TradingView charts — just choose a broker and connect to your account.
Crypto markets are famous for their volatility, so one should study all the available stats before adding crypto assets to their portfolio. Very often it's technical analysis that comes in handy. We prepared technical ratings for Bitcoin / TetherUS (BTC): today its technical analysis shows the buy signal, and according to the 1 week rating BTC shows the sell signal. And you'd better dig deeper and study 1 month rating too — it's neutral. Find inspiration in Bitcoin / TetherUS trading ideas and keep track of what's moving crypto markets with our crypto news feed.
Bitcoin / TetherUS (BTC) is just as reliable as any other crypto asset — this corner of the world market is highly volatile. Today, for instance, Bitcoin / TetherUS is estimated as 2.07% volatile. The only thing it means is that you must prepare and examine all available information before making a decision. And if you're not sure about Bitcoin / TetherUS, you can find more inspiration in our curated watchlists.
You can discuss Bitcoin / TetherUS (BTC) with other users in our public chats, Minds or in the comments to Ideas.