Your Altcoin Could Be My Next Analysis — Drop Your Ticker!What’s on your watchlist? 👀
The altcoin market is full of developing structures, but not every setup deserves our attention. Let’s find the charts with something interesting to offer!
I’m opening the comment section for ALTCOIN ANALYSIS REQUESTS! 🔥
Drop your favorite altcoin below, and I’ll select interesting setups for a detailed technical review covering:
📊 Market structure and major chart patterns
🎯 Potential breakout and breakdown levels
📍 Key demand and supply zones
🛡️ Invalidation levels and projected targets
How to participate: Simply comment with your altcoin ticker and preferred timeframe.
Whether your coin is approaching a major support zone, preparing for a breakout, or showing signs of a potential reversal, I want to see it!
DROP YOUR ALTCOIN BELOW. YOUR REQUEST COULD BE MY NEXT PUBLISHED ANALYSIS!
Let's discover the opportunities together.
Probability over prediction.
WESLAD Research
In-depth trading ideas
BTCUSDT Rebounds From 84K Buyer Zone — Can Bulls Reach 89K?Hello traders! Here’s my technical outlook based on the current BTCUSDT (2H) chart structure. BTCUSDT previously traded inside a range before breaking higher and later forming a descending structure. Price then bounced from the ascending Trend Line and broke above the Buyer Zone, shifting momentum bullish. Currently, BTCUSDT is trading below the 89,000 Seller Zone while holding above the 84,000 Buyer Zone and ascending Trend Line. The recent bounce from support suggests buyers are preparing for another move higher. As long as BTCUSDT remains above the 84,000 Buyer Zone and respects the ascending Trend Line, the bullish scenario remains valid. A continuation higher could push price toward the 89,000 Seller Zone (TP1). However, a breakdown and close below the Buyer Zone would weaken the bullish outlook and increase the possibility of further downside. Please share this idea with your friends and click "Boost" 🚀
BITCOIN - A strong market. Retest of resistance BINANCE:BTCUSDT.P is maintaining its local bullish trend, while the five-week consolidation following the strong rally — during which the coin broke its medium-term bearish trend — points to underlying market strength
After breaking the trend and staging a strong rally, Bitcoin has been consolidating for five weeks. Negative news failed to trigger a decline, while the long squeeze became a technical catalyst for further upside.
The coin continues to confirm its bullish market structure. The breakout of the wedge resistance, which marks the consolidation boundary, is triggering another retest of key resistance. The main focus is on 82,300–82,800. A close above this zone could accelerate the move toward 86K
Resistance levels: 82,300, 82,850, 86,000
Support levels: 80,500, 80,000
A retest of the 82,800 resistance could trigger a correction, but if the market manages to hold the local pullback within the current range, this would provide another confirmation of the market’s readiness for a rally. A close above 83,000 could become a technical catalyst for further upside toward 86K–100K
Best regards,
R. Linda!
Bitcoin: $82K Breakout Could Trigger the Next Leg HigherBitcoin: $82K Breakout Could Trigger the Next Leg Higher
Bitcoin is consolidating after breaking above the long-term descending trendline, with price currently holding inside the $74.7K–$82.2K range.
The key level to watch is $82.17K. A confirmed breakout and hold above this resistance could signal a continuation toward the next major resistance zones around $86K, $94K, and potentially $107K.
On the other hand, rejection around $82K could keep BTC range-bound, with $74.73K remaining an important support area.
The current structure suggests a potential bullish continuation, but confirmation is important rather than assuming the breakout will occur.
Key levels:
Target 1: $86K
Target 2: $94K
Target 3: $107K
You can find more details on the chart.
Thank you! 🍀
⚠️PS: Do your own analysis and use your own strategy to join the trade.
❤️ If this analysis helps your trading day, please support it with a like or comment ❤️
BTC Faces Strong Resistance After the BounceYesterday we saw a straight bounce, and BTC is now trending around this area while facing strong horizontal resistance.
This zone won’t be easy to break, especially with RSI already back in the overbought range.
So, we could see some sideways movement or a rejection from this level as the RSI cools off and resets below the overbought zone.
Let’s see how #BTC reacts here. 👀
Comment your views below.
BTC - Moving Averages says BOTTOM IN !Decembers and the period leading up to it have generally been a period of upward trading for BTC.
If we take a look at the daily timeframe, there are a few signs that the bottom may be in:
👉 Three Drives Down pattern ended
👉 Moving Averages Bullish Cross
👉 W-Bottom pattern
(👉 approaching year end...)
👉 Three Drives Down pattern ended early
👉 Moving Averages Bullish Cross
👉 W-Bottom pattern
This one is a bit of a hard spot, since it is such a "flat" pattern in the 4h, that effectively preceded and quietly announced the reversal.
Interesting to note that, after the previous cross, there was a 41% increase:
What are your thoughts - bottoms in or not?
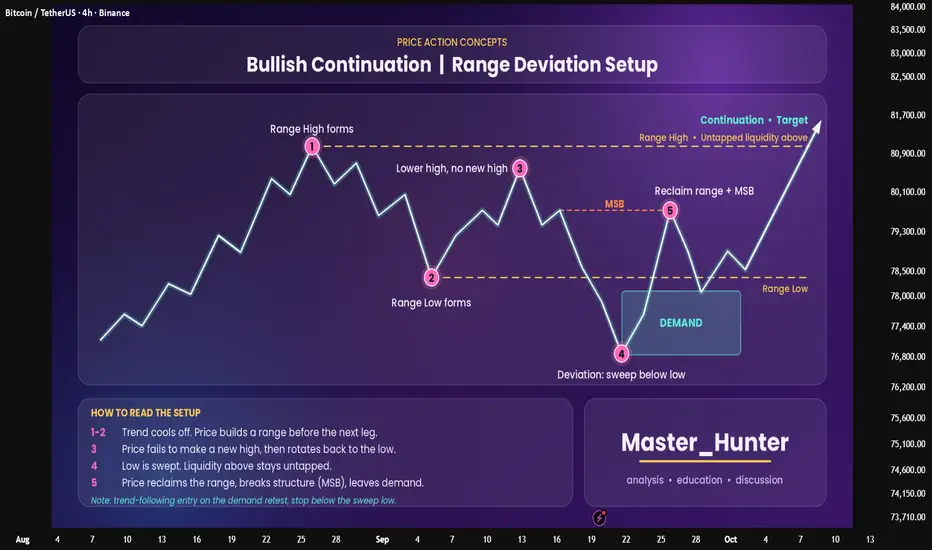
Bullish Continuation | Range Deviation SetupTrends don't move in a straight line. They pause, build a range, and often trap traders on both sides before the next leg. This setup shows how to read that pause and trade it with structure.
The 5 steps
Range High : the trend cools off and price prints a clear high.
Range Low : price rotates down and defines the bottom of the range.
Lower High : price fails to make a new high and drops back to the low. Buyers look weak here, and that's the trap.
Deviation (liquidity sweep) : price pushes below the range low and triggers stops. Liquidity above the range stays untapped.
Reclaim + MSB + Demand : price closes back inside the range and breaks the last lower high (Market Structure Break). The move leaves a Demand zone behind.
Why it works
The sweep below the low grabs sell-side liquidity. Once the low is reclaimed, the trapped sellers fuel the move up. The untapped liquidity above the range high becomes the natural target.
How to trade it
Entry : retest of the Demand zone after the MSB.
Stop-loss : below the sweep low.
Targets : scale out in stages: mid-range, then range high, then beyond it.
Confirmation : candle close back inside the range, plus volume or momentum shift.
Common mistakes
Entering on the sweep before price reclaims the range.
Trading it against a higher-timeframe downtrend.
Skipping the MSB and buying the first bounce.
This works on forex, crypto and indices, on any timeframe. Always confirm with higher-timeframe context.
Educational content only, not financial advice.
Where do you place your stop on a deviation setup: below the sweep low, or below the demand zone? Share your view and your own examples in the comments, and let's discuss.
Bitcoin Consolidation bullish breakout momentum Bitcoin is showing strong upside momentum after spending time consolidating around the 81,000–82,400 area. The latest impulsive breakout above the trading range indicates that buyers have taken control, with price now holding near 83,800.
Tecnically move is also being supported by improving crypto sentiment and renewed spot-Bitcoin ETF demand. Recent reports show Bitcoin recovering above $81K, with strong inflows late last week, while markets are also reacting to changing macro expectations and upcoming U.S. economic and geopolitical developments.
Resistance levels ; 85,500 / 87,010
Support levels ; 82,500 / 80500
As long as BTC maintains the breakout area around 82,400 / 82,000, bullish continuation remains possible toward the marked 85,500 and 87,000 target zones a sustained move back below the breakout area would weaken this bullish structure and could bring BTC back into the previous range.
Hope you found this analysis helpful. 👍
Like, Comment & Follow for more updates.
BTC Is at a Critical $87K Decision Zone!!CRYPTOCAP:BTC Update!!
BTC is testing a major resistance zone around $86.5K–$87K on the daily timeframe.
Price has been moving inside a rising structure since the June low, and we can see a similar ascending pattern from the previous move earlier this year. BTC is now approaching the upper trendline of the current structure.
The interesting part is the daily RSI, which has moved back above 70 and is showing signs of becoming stretched. We’re also seeing a small rejection from the $86.7K area.
If BTC breaks and closes cleanly above $87K, the next area to watch would be around $88K+.
But if this resistance holds, a pullback toward the lower trendline could come into play before another attempt higher.
$86.5K–$87K is the key zone right now. I’m watching the reaction here closely.
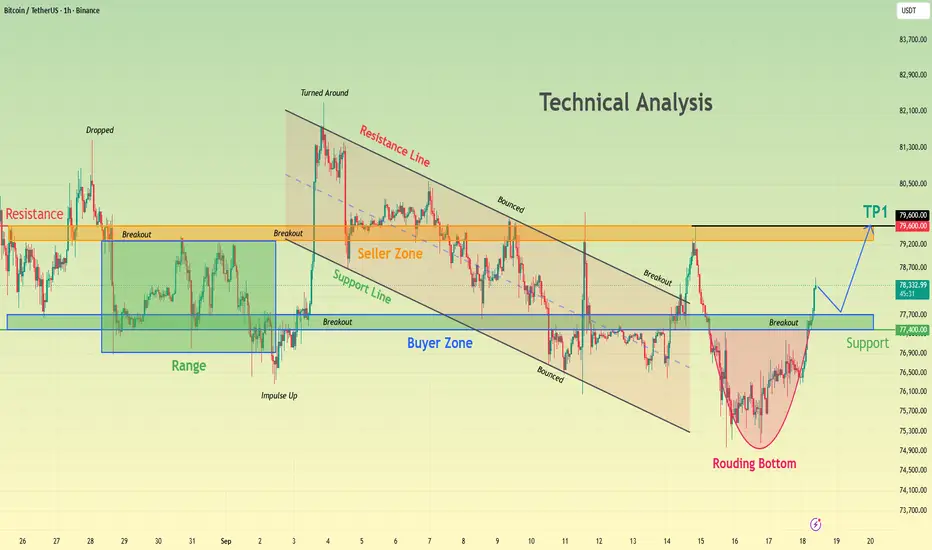
Bitcoin Outlook: Rounding Bottom Supports Further Upside To TP1Hello traders! Here’s my technical outlook based on the current BTCUSDT (1H) chart structure. BTCUSDT previously traded inside a range before breaking higher and later forming a descending structure. Price then created a Rounding Bottom near the lows and broke above the Buyer Zone, shifting momentum bullish.Currently, BTCUSDT is trading below the 79,600 Seller Zone while holding above the 77,400 Buyer Zone and Support Level. The recent bounce from the Rounding Bottom suggests buyers are preparing for another move higher. As long as BTCUSDT remains above the 77,400 Buyer Zone and respects the current support structure, the bullish scenario remains valid. A continuation higher could push price toward the 79,600 Seller Zone (TP1). However, a breakdown and close below the Buyer Zone would weaken the bullish outlook and increase the possibility of further downside. Please share this idea with your friends and click "Boost" 🚀
BTCUSDT: Sellers Defend 87,400 as 80,000 Comes Into FocusHello everyone, here is my breakdown of the current BTCUSDT setup.
Market Analysis
BTCUSDT previously traded inside ranges and a triangle structure before breaking higher. Price then entered a downward channel, tested the Resistance Zone near 87,400, and was rejected, shifting the short-term structure bearish.
Currently, BTCUSDT is trading below the 87,400 Resistance Zone while holding above the 80,000 Support Zone. The recent rejection from resistance suggest sellers may attempt another move lower.
My Scenario & Strategy
As long as BTCUSDT remains below the 87,400 Resistance Zone, the bearish scenario remains valid. A continuation lower could push price toward the 80,000 Support Zone (TP1).
However, a breakout and close above 87,400 would weaken the bearish outlook and increase the possibility of further upside.
That’s the setup I’m tracking. Thank you for your attention, and always manage your risk.
₿ BTCUSDT — BUY SETUP...₿ BTCUSDT — BUY SETUP 📈
Buy Retest Zone: 80,500–81,000
🎯 Target Path
T1: 84,800
T2: 86,500
T3: 87,800–88,000
🛡️ Risk Invalidation: Below 80,000
📊 Market Analysis
BTC has made a strong bullish breakout above the previous resistance around 82,000, followed by a sharp expansion toward 84,300+. The chart now shows 80,500–81,000 as the key breakout-support area. If price pulls back into this zone and buyers defend it, the bullish structure remains intact and the next upside levels are 84,800, 86,500, and finally the 87,800–88,000 target zone.
Resistance: 84,800 → 86,500 → 88,000
Key Support: 80,500–81,000
Major Support: 75,200–76,000
Invalidation: A sustained move below 80,000 would weaken the breakout structure and invalidate this bullish target path.
BITCOIN - Bullish trend. Consolidation before rallyBINANCE:BTCUSDT.P previously went through a trend reversal phase and broke above the key 83K resistance. Consolidation is forming above this zone, hinting at further upside, however...
The fundamental backdrop remains unstable. However, profit-taking in BTC is currently not particularly strong, and there is no significant selling pressure. Consolidation following the strong rally, along with the weak reaction to negative news, points to market strength. Spot ETF inflows are gaining momentum. Trading volumes are increasing. Altcoins are showing strong growth, so far without significant leverage. Technically, the backdrop is becoming increasingly favorable...
Bitcoin is breaking through the 83K resistance and consolidating above this zone, indicating readiness for a rally. The market is confirming the trend reversal; however, a correction aimed at hunting liquidity could occur before further upside. The key focus is on 82,300–80K.
Resistance levels: 87,400, 90,000, 100K
Support levels: 82,800, 82,300, 80K
The retest of the May support level formed a 82,800–82,300 liquidity pool, which could be tested before another move higher. A long squeeze could shift the balance of power in favor of buyers and trigger further upside toward 90K–100K.
Best regards, R. Linda!
Bitcoin Price Update – Clean & Clear ExplanationBitcoin is showing a clear bearish correction after facing strong resistance near the 85,000 –86,000 zone and Price recently pushed toward the 87,000 area, but the rejection from the upper resistance zone has brought stronger selling pressure back into the market.
Technically bearish setup would weaken if BTC strongly reclaims and holds above 86,000 a sustained breakout above 87,000–87,050 would indicate that buyers are regaining control and could shift the short-term structure back toward the upside recent market data also shows BTC pulling back after briefly trading above 87K, while remaining significantly higher over the previous week.
TP1: 82,528
TP2: 81,037
TP3: 80,000
As long as Bitcoin remains below the 85,000–86,000 resistance area, the short-term structure can continue to favor a downside move. A confirmed break below the current 84,000 support area could increase selling pressure and expose the next support levels around 82,528, followed by 81,037 and the 80,000 psychological zone.
Overall structure: BTC is currently in a pullback/correction phase below the 85K–86K resistance zone. Watch the reaction around 84K and the confirmation at 82.5K before expecting the next major downside leg.
your support means a lot! If you found this analysis useful, leave a Like and tell me your thoughts in the comments. Best of luck with your trading journey! 🚀
Bitcoin Price Update – Clean & Clear ExplanationBTCUSDT is showing a strong bullish structure on the 4H chart after breaking above the major 82,131 resistance/high zone. Price has accelerated upward with strong buying momentum, confirming a breakout from the previous consolidation and descending structure.
The current price is around 85,937, with the breakout holding above the previous resistance area. As long as BTC remains above 82,131, the bullish setup stays active. A successful continuation could push price toward TP1 at 88,055, followed by TP2 around 90,084.
The key invalidation area is below 79,852. A sustained move back below this level would weaken the bullish structure and increase the possibility of a deeper correction.
Overall: BTC is currently showing strong upside momentum, with 82,131 acting as the key breakout/support zone and 88,055–90,084 as the next major upside targets.
your support means a lot! If you found this analysis useful, leave a Like and tell me your thoughts in the comments. Best of luck with your trading journey! 🚀
TradeCityPro | Bitcoin Daily Analysis #369👋 Welcome to TradeCity Pro!
Let’s take a look at Bitcoin. The bullish move in the market has started!
⌛️ 1H Timeframe
Yesterday, Bitcoin managed to establish a close above 76,793 and started a bullish move.
🔔 This move is still ongoing, and price has even broken above 79,274.
📊 Buying volume has increased significantly, while RSI has also established above 70 and entered the overbought zone.
✨ If you already have a long position, I suggest keeping it open as long as RSI remains in the overbought zone, and taking profit once RSI exits the overbought zone.
💡 There is an important resistance zone between 81,289 and 82,561, and there is a high probability of price being rejected from this zone. However, if price maintains its momentum and manages to break through this zone, a very sharp move could begin.
✔️ For a new position, we currently don’t have a trigger. I’ll personally wait for a proper structure to form before opening a position.
❌ Disclaimer ❌
Trading futures is highly risky and dangerous. If you're not an expert, these triggers may not be suitable for you. You should first learn risk and capital management. You can also use the educational content from this channel.
Finally, these triggers reflect my personal opinions on price action, and the market may move completely against this analysis. So, do your own research before opening any position.
Bitcoin Surges +7% — Is $85K a Breakout or a Bull Trap?Bitcoin ( BINANCE:BTCUSDT ) has gained more than 6–7% over the past few hours, building strong bullish momentum.
However, the rally is now entering a major technical resistance structure, while recent regulatory uncertainty and mixed institutional flows remain important risks.
Can Bitcoin establish itself above $85,000, or is the current move setting up another correction?
Macro Outlook
From a fundamental perspective, downside risk has not disappeared.
Bitcoin ETF flows have recently been volatile rather than consistently bullish, while the failure of the CLARITY Act to advance in the U.S. Senate has added further regulatory uncertainty.
For this reason, the current rally still needs confirmation before a sustained bullish continuation can be assumed.
Technical Analysis
Bitcoin is currently trading inside the Heavy Resistance Zone($84,500-$79,350), near the major Potential Reversal Zone(PRZ) , the Cumulative Short Liquidation Leverage($85,400-$82,300), and the Resistance Lines.
There is also a possibility that Bitcoin could finally fill the upper CME Gap($84,560-$83,215) after several months.
From an Elliott Wave perspective, Bitcoin appears to be completing Primary Wave 5, while Primary Wave 3 developed as an Extended Wave.
A Negative Regular Divergence(RD-) is also visible between Consecutive Peaks, providing another warning that bullish momentum may be weakening.
💡 Educational Note: When Wave 5 approaches major resistance while a Negative Regular Divergence develops, the risk of trend exhaustion and a corrective move can increase.
I expect Bitcoin to first enter deeper into the Cumulative Short Liquidation Leverage and the major Potential Reversal Zone(PRZ), potentially filling the upper CME Gap.
A Bull Trap above the Heavy Resistance Zone is also possible before the next bearish move begins.
From this area, I expect Bitcoin to decline toward at least $79,000. If bearish momentum increases, the correction could extend toward the key trading level of $77,700.
Trade Setup
First Take Profit(TP): $79,000
Second Take Profit(TP): $77,700
Stop Loss(SL): $87,300(Worst)
Key Trading Level: $77,700
Upper CME Gap: $84,560-$83,215
Which level do you think Bitcoin will reach first?
🔴 $77,700
🟢 $87,300
📌 Bitcoin Analysis(BTCUSDT) Daily time frame.
🛑 Always use proper risk management and set a Stop Loss(SL) for every position.
🚀 If this analysis helps your trading plan, a BOOST would help more traders discover it.
BTC Path Toward $96K Is Taking ShapeBitcoin has completed the $82.5K test and successfully defended the $74K support zone. Price is now approaching the key resistance once more.
A sustained breakout above $82.5K could provide the confirmation needed for further expansion toward the $95K–$97K HTF supply zone.
The structure remains valid above $73.1K.
Probability over prediction.
WESLAD Research
Bitcoin Breakout Retest — Is $90K the Next Target?Bitcoin ( BINANCE:BTCUSDT ) appears to have successfully broken above the Heavy Resistance Zone and is now completing a pullback toward this area.
BTC also reacted very well to the Cumulative Long Liquidation Leverage($83,220-$82,300) and started to move higher from this zone.
Can Bitcoin confirm the breakout and extend its bullish move above $87,000?
Technical Analysis
From an Elliott Wave perspective, Bitcoin appears to have completed Primary Wave 4, suggesting that the next Impulsive Waves could begin developing over the coming hours.
The current pullback toward the previously broken Heavy Resistance Zone could also act as a retest before another bullish move.
💡 Educational Note: After a resistance breakout, a pullback toward the broken zone can act as a bullish retest if buyers successfully defend the area as new support.
I expect Bitcoin to rise at least toward the Cumulative Short Liquidation Leverage.
If bullish momentum increases, BTC could extend the move toward the major Potential Reversal Zone(PRZ) .
Trade Setup
First Take Profit(TP): $86,870
Second Take Profit(TP): $88,810
Stop Loss(SL): $81,770
Cumulative Long Liquidation Leverage: $83,220-$82,300
Upper CME Gap: $87,825-$87,700
Potential Reversal Zone(PRZ): $91,860-$88,760
Do you think Bitcoin can move back above $87,000?
🟢 Yes
🔴 No
📌 Bitcoin Analysis(BTCUSDT), 4-hour time frame.
🛑 Always use proper risk management and set a Stop Loss(SL) for every position.
🚀 If this analysis helps your trading plan, a BOOST would help more traders discover it.
BTCUSDT Long: Bulls Hold 82,100 as Price Targets 87,000Hello traders! Here’s my technical outlook based on the current BTCUSDT (4H) chart structure. BTCUSDT previously traded inside an ascending channel and range before breaking higher and continuing within a broader ascending channel. Price then tested the upper area near the Supply Zone.
Currently, BTCUSDT is trading below the 87,000 Supply Zone while holding above the 82,100 Demand Zone and the ascending channel support. The recent bounce from support suggests buyers are preparing for another move higher.
As long as BTCUSDT remains above 82,100 and respects the ascending channel, the bullish scenario remains valid. A continuation higher could target 87,000 (TP1). However, a break below 82,100 would weaken the bullish outlook. Manage your risk!
Bitcoin:False Breakout at $76,500? Bulls Eye $79,300 and $80,880Bitcoin:False Breakout at $76,500? Bulls Eye $79,300 and $80,880
Bitcoin tested a major support zone near $76,500 that has repeatedly acted as an important reaction area on the 4H chart.
Price recently broke below this level, but the move has so far failed to produce strong continuation. Instead, BTC has started consolidating back around the zone, raising the possibility that the breakdown could develop into a false breakout.
If Bitcoin can hold above $76,500, the next important resistance areas are:
$79,300
$80,880
A decisive rejection from $76,500 or another sustained move below the support zone would weaken the bullish scenario and could expose BTC to further downside.
Given that the Clarity Act failed to pass the procedural vote and BTC did not fall more than 75000, then this is increasing the chances of BTC rising further.
You can find more details on the chart.
Thank you! 🍀
⚠️PS: Do your own analysis and use your own strategy to join the trade.
❤️ If this analysis helps your trading day, please support it with a like or comment ❤️
#BTCUSDT LONG SET UP ALERT !#BTC
The price is moving within a bearish channel on the 1-hour timeframe; it has reached the lower boundary and appears poised for a rebound. A retest of this boundary is expected, supporting some upward movement.
The Relative Strength Index (RSI) indicates a bearish trend, but an upward breakout is likely due to oversold conditions on the 1-hour chart.
There is initial support at 74,960, acting as a primary support zone.
A key support zone (marked in green) exists at 72,769; the price has rebounded from this area multiple times, making it a strong support level.
The price is trending toward the 100-period moving average—a level we are currently approaching—which supports the case for a rise.
Entry Price: 80,365
Target 1: 81,262
Target 2: 82,446
Target 3: 83,800
Stop Loss: At the green resistance zone.
Remember this simple rule: Capital management.
If you have any questions, please leave a comment.
Thank you.