Bitcoin Rebounds Ahead of $11B Options Expiry — Is $82K Next?Bitcoin started moving higher before reaching the Heavy Support Zone($79,150-$80,400), reacting from an area near the key trading level of $81,250.
The short-term recovery is gaining momentum, but tomorrow’s major Bitcoin options expiry could significantly increase volatility.
Can Bitcoin extend this move toward $82,000, or will sellers regain control?
Macro Outlook
More than $11 billion in Bitcoin options are scheduled to expire on October 30, which could increase volatility as traders adju
Ascending Broadening Wedge
Bitcoin Starts the Week Higher — Is This Rally a Bull Trap?Bitcoin ( BINANCE:BTCUSDT ) started the new week with a bullish move of more than 2%, but the recovery has developed with relatively low trading volume.
BTC is still trading inside an Expanding Ending Diagonal, which also resembles an Ascending Broadening Wedge Pattern from a classical technical analysis perspective.
Can Bitcoin break above $87,000-$88,000, or is another move below the Support Zone($84,940-$85,460) approaching?
Technical Analysis
From an Elliott Wave perspective, Bitcoin app
Breakout Confirmed: Is the Next Rally Just Beginning?Trade Rationale
Diamond Pattern Breakout confirms bullish continuation.
Law of Polarity validated as the breakout zone is acting as strong support.
Ascending Broadening Wedge Breakout signals expanding bullish momentum.
Higher High–Higher Low structure keeps the primary trend positive.
Pattern Target: ₹420+
Support Zone: ₹370–₹375
SNDK: Bullish Reversal after 50% correctionSNDK just took heavy correction (50%); Historical correction level for SNDK
However, it has recently reached level of $1050, which has following confluences:
1- Ascending Wedge Bottom Trendline Support
2- Target Completion of HnS pattern
3- A horizontal support level
4- Golden Pocket Fib level
5- 200EMA Support Level
A Powerful confluence zone should be sign of bullish reversal.
Entry now for Short term Trade with target levels of $1500
New Entry for Target Levels of $ 4000 after breakou
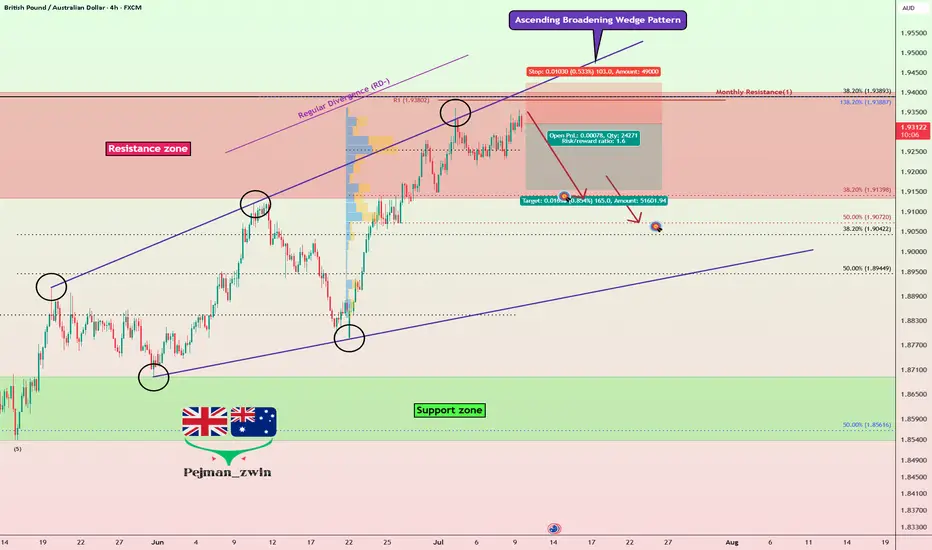
GBPAUD Ascending Broadening Wedge: Is a Short Setup Forming?Today, I want to share a Short opportunity on GBPAUD ( FX:GBPAUD ). Stay with me.
GBPAUD is currently trading around the upper boundary of a resistance zone(1.9400 AUD-1.9133 AUD).
From a classic technical analysis point of view, the chart seems to be forming an Ascending Broadening Wedge pattern. Since the third peak has formed within the resistance zone(1.9400 AUD-1.9133 AUD), we might be facing at least a downward correction.
Also, we can see a negative Regular Divergence(RD-) between t
Kotak Bank at Key Short-Term Support ZoneKotak Bank: Trading Near Key Support Zone
This is the 1-hour timeframe chart of Kotak Bank. The stock is moving within a well-defined parallel channel, with strong support levels aligned with key Fibonacci retracement zones.
Support Zones:
Aggressive Traders: ₹372 – ₹375
Safe Traders: ₹360 – ₹365 (Parallel Channel Support + Fibonacci Golden Ratio)
Upside Targets:
Target 1: ₹400
Target 2: ₹405
As long as the stock remains within the channel structure, the overall setup stays positive. The u
is HYPE (hyperliquid) overbought? -SHORT-🙋♀️🙋♂️😃🌍🐮 Hello all 🙋♀️🙋♂️😃🌍🐮
I would like to say I am overall still bearish 🐻🐻❄️🐨🐼 on the market for now as bitcoin fell below a key price of 77k and has continued to fall, I have had my eyes set on 59k BTC price for a couple of months now to finish out the perfect bear market (see previous ideas for more information)
HYPE reached a new ATH of 67 dollars during the crashing market today which is impressive and perpetual futures trades have seen billions of dollars worth of volume.
Taking Profit on BTC Shorts; Looking to Get Tiny Long ExposureOriginally Posted: 02/05/2026
Reposted For Compliance: 02/13/2026
BTC and MSTR are at potential PCZs of Bullish Gartley; The two assets moved down leading to MSTR earnings and negative unrealized losses expectations. I do think that BTC will ultimately move back down, but from where it is now, looking at all of the downside short leverage that has been building at these lower levels, I think there is a high chance of it short squeezing to the upside and for it to be fast and violent move up to
Bitcoin simple bullish harmonics/trend lines/corrections~1W VIEWHello all!
🙋♀️🙋♂️🌍☯️🗻
Thanks for coming today. This post is just simple TA and we see here a long term ASCENDING channel for bitcoin. Inside the wedge are 2 bullish harmonics formed over months along with post bear 🐻 market 💹 correction descending channels.
🌊🤸🤸♂️
Our current situation looks a lot like 2022 after the bear market we correct for a month or two.
No big deal. We can look to aim at a new ATH if past trends continue possibly bullish 🐂🎯 by April.
This is just an i
TMPV – Pattern Formation on ChartThis is the 1-hour timeframe chart of TMPV.
After the channel breakout, the stock is forming a broadening wedge and is currently trading near resistance.
A confirmed breakout above this level ( 390 ) could trigger an upside move towards the 450 target. However, if the resistance holds, the stock may witness another corrective decline.
Major support is placed near the 335 level.
Thank You ..
Breaking: Broadcom Inc. (AVGO) Surged 11% Yesterday Eyeing $500 Broadcom Inc. (NASDAQ; NASDAQ:AVGO ) shares saw a noteworthy uptick of 11% in extended market trading further extending the gains to todays premarket session up by 2.34%.
Should the stock break the ceiling of the $388 resistant zone, coupled with the RSI at 61, a bullish move to the $500 resistant is feasible and possibly $700 before the year runs out.
Similarly, failure to pull that stunt from NASDAQ:AVGO might resort to a move to the $250 support point.
With earnings slated for December
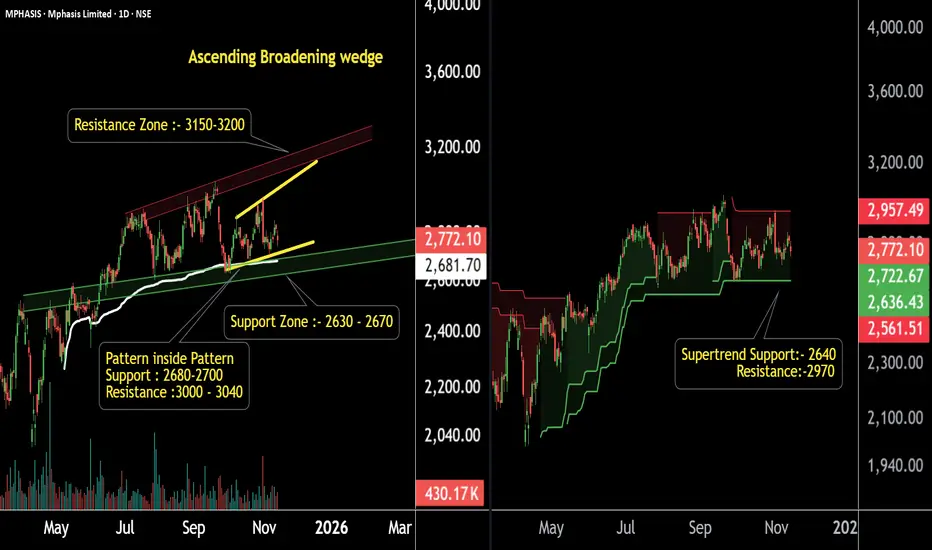
Mphasis Technical Levels for Smart TradingThis is the daily timeframe chart of Mphasis.
Mphasis is moving within a well-defined market structure and is forming a pattern inside a pattern.
The major support zone lies between ₹2630–₹2670, while the smaller internal pattern is taking support near ₹2670–₹2700.
The Supertrend indicator is also positive, with Supertrend support positioned around ₹2640.
If these levels sustain, we may witness higher prices in Mphasis.
Thank you !!
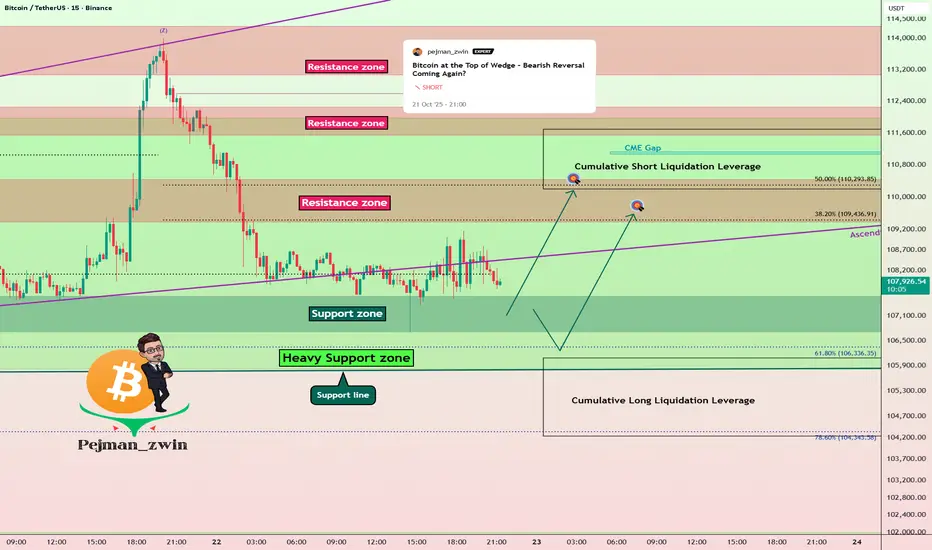
Bitcoin Short Term Setup – One More Push Before Fall?As I expected in yesterday’s idea , Bitcoin( BINANCE:BTCUSDT ) dropped down into the lower ranges of the Heavy Support zone($111,980-$105,820) .
Today, I want to share a quick 15-minute timeframe analysis with you.
Currently, Bitcoin is moving near that Support zone($107,580-$106,700) , but it hasn’t managed to break the lower line of the ascending broadening wedge pattern with strong momentum .
So I expect Bitcoin might at least make another move up to the Resistance zone($
IDFC First Bank Holding Firm — Buyers Defending Key LevelsIDFC First Bank – Daily Chart Analysis
Timeframe: Daily chart observation.
Price Structure: The stock is trading within a well-defined parallel channel.
Support Zone: Strong support identified near the ₹67–₹69 range.
Upside Target: If the support zone holds, the next potential upside target lies around ₹81–₹82.
Outlook: Sustaining above the support levels may lead to higher prices in the upcoming sessions.
Thank you.
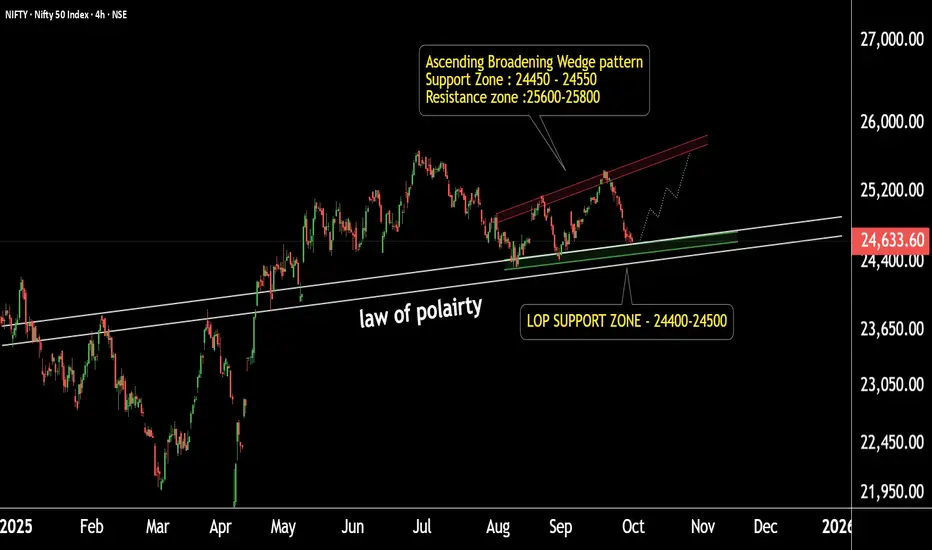
Strong Base Formed ! Nifty Positioned for Explosive Move This is the daily timeframe chart of Nifty 50.
Nifty 50 is sustaining above the LOP support zone around 24,400–24,500. The index has formed an ascending broadening wedge pattern at this support and appears to be completing the last leg of the structure.
Support Zone: 24,500–24,550
Resistance Zone: 25,600–25,800
If the support zone holds, we may see higher prices in Nifty 50 in the coming sessions.
Thank you.
NZDUSD Hits Strong Resistances – Bearish Reversal Ahead?NZDUSD ( OANDA:NZDUSD ) is currently trading near the Resistance zone($0.6000-$0.5958) , Potential Reversal Zone(PRZ) , and Resistance lines .
From a classical technical analysis perspective, NZDUSD seems to be completing the Ascending Broadening Wedge Pattern .
From an Elliott wave theory perspective, NZDUSD seems to have completed the microwave C of the microwave Y of the main wave B . So we should wait for the next bearish waves .
Also, we can see the Regular Divergence(RD-)
GSFC chart showing a hidden setup… Is this the breakout moment?GSFC Chart Update (4H Timeframe)
Chart 1:
Stock has formed a symmetrical broadening wedge.
If the stock respects the resistance, there is a possibility of a Head & Shoulders pattern.
Key support zone: 202 – 204.
Chart 2:
GSFC is forming an ascending broadening wedge pattern.
Support lies in the 192 – 195 range.
If this level sustains, potential pattern target is around 240.
Thank You !!
Breakout Alert!Granules India is ready to shine—watch this spaceGranules India Limited – Technical Outlook
Weekly Timeframe
Granules India is moving within a well-defined parallel channel. The stock is currently approaching its middle boundary resistance near 560–590 levels and support near 430-450
On the daily chart, the stock has formed a descending parallel channel, and this time, the chances of a breakout are higher as the price action has developed a double bottom formation.
Daily Timeframe
Additionally, Granules India is forming an ascending broad
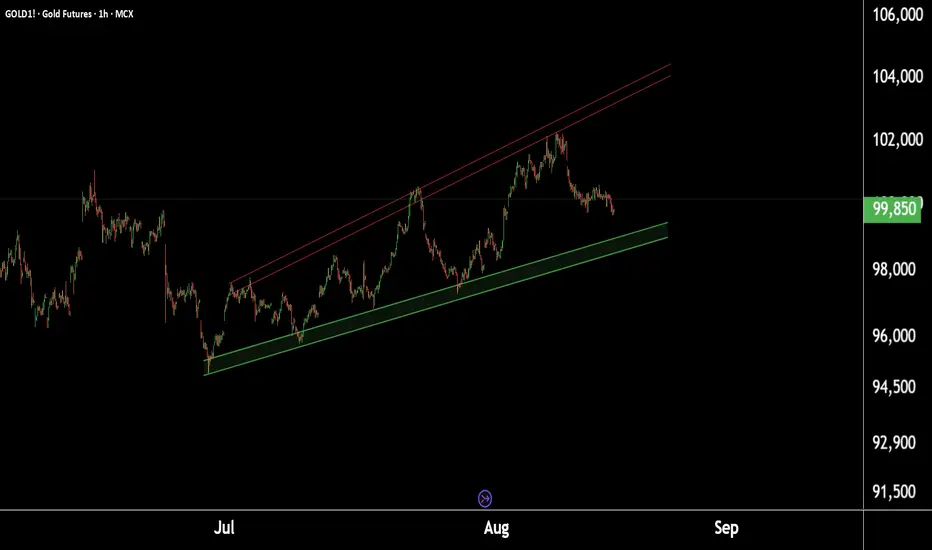
Gold at Crucial Levels – Buy or Sell? Watch These Key Price ZoneDaily Gold Update:
This is the daily timeframe chart of Gold1!.
Gold1! is forming an ascending broadening wedge pattern with support in the ₹98,500–₹98,800 range.
If this support holds, we may see higher prices.
However, if it breaks, Gold1! could decline towards its pattern target near ₹95,000.
Thank You !!
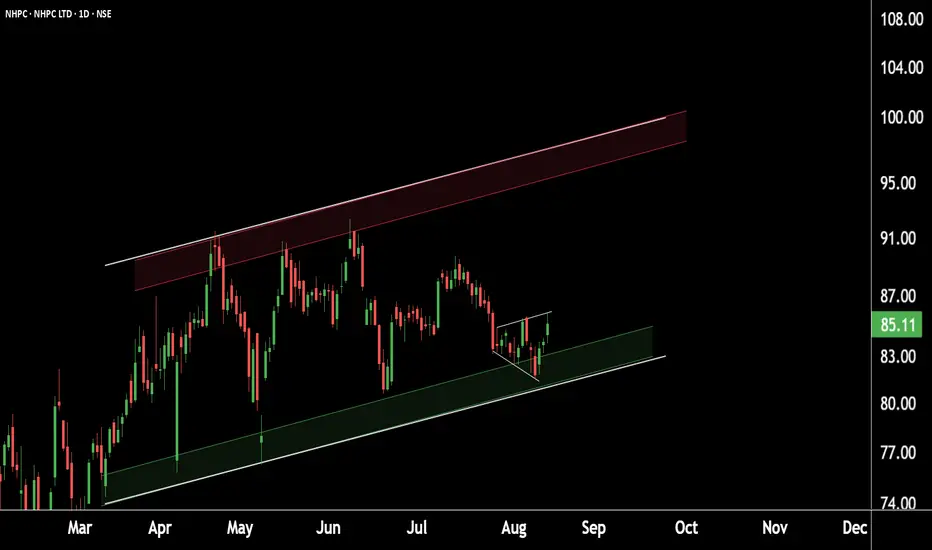
Energizing gains – Initiating NHPC buy.Chart timeframe: Daily chart of NHPC.
Pattern formation: Broadening pattern observed.
Support zone: Currently taking support along the parallel channel in the ₹80–₹83 range.
Price outlook: Sustaining this support zone could lead to higher price levels.
Note: Continue monitoring price action for confirmation.
Thank You !!
Breakout Alert: PVR Gearing Up for a Strong MoveThis is the daily chart of PVR INOX.
PVRINOX is forming a broadening pattern within a larger broadening structure.
The smaller pattern has a breakout target of ₹1200, which coincides with the major resistance level of the larger pattern.
PVRINOX having a strong support zone near at 970-990 zone.
If this level is sustain then we may see higher prices in PVRINOX.
Thank You !!
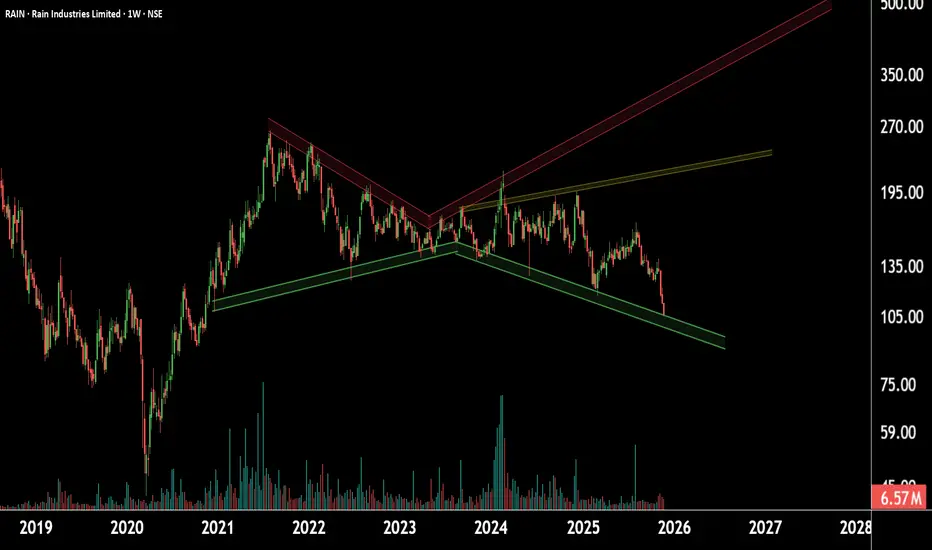
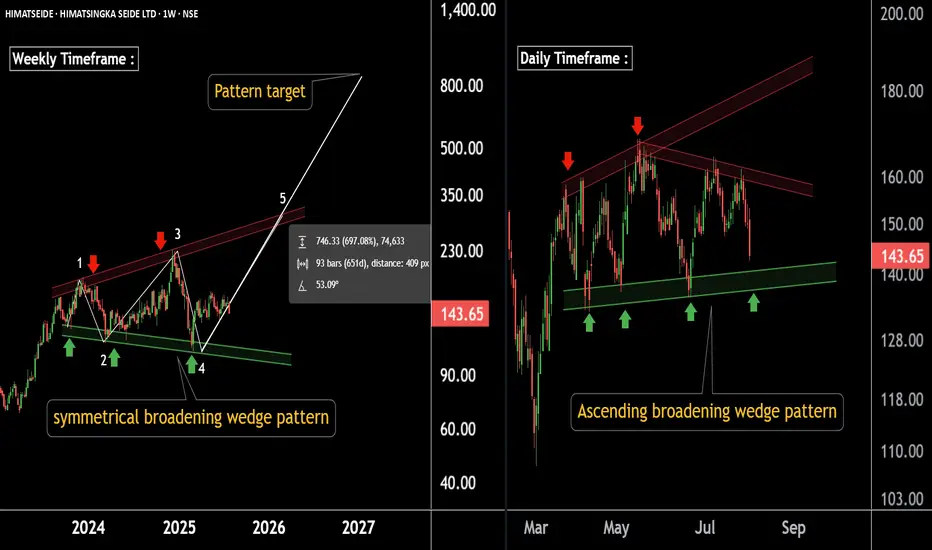
Massive Base Formation on Charts – Potential Multibagger LoadingThere are two Chart of HIMATSINGKA SEIDE.
Himatsingka Seide is forming a symmetrical broadening wedge pattern on the weekly timeframe, with a strong support zone near ₹100.
On the daily timeframe, Himatsingka Seide is forming an ascending broadening wedge pattern, with a crucial support level near ₹135.
If this level is Sustain then we may see higher prices in Himatsingka Seide.
Thank You !!