End of hibernation for the bears?AMEX:SPY is at a pivotal point and could potentially be at the top of the bullish cycle that began in October 2022. If this prediction proves accurate, I think we could see a maximum low of $510 for this year. There are a couple of caveats, including one that will be a clear indicator of whether or not this wave count is accurate, which I will explain later.
On the 1000R chart ($10), this uptrend was confirmed by Supertrend and volume activity. Volume drastically increased at the start of W
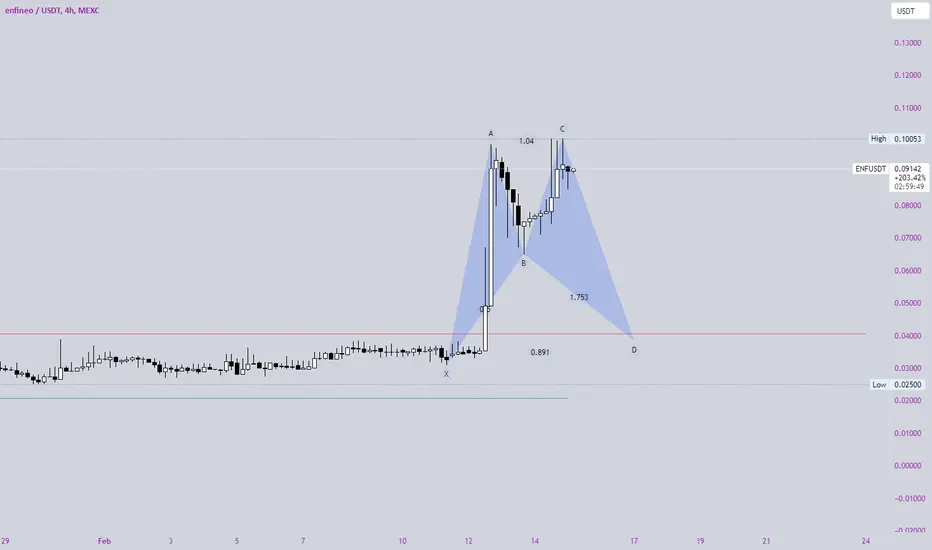
Butterfly
Pepe USDT Day Trading Idea 1 March 2025Pepe USDT Day Trading Idea
Fib drawn from high to low of the rane were currently in. Obvious rejectioon at 0.5 and forming a Triangle Pattern if you will.
Day idea 1:
Possible 0.236 support with monthly as a backup at that level or S1 at 0.0000748. Trend reversal from suppoort with a possible high between 0.382 and 0.888 or R1 at 0.0000838. If S1 is hit be aware of the monthly being resistance at 0.236.
Day idea 2:
Possible S2 at 0.0000703 which fulfills the larger range Butterfly Gartley dep
Pepe Bearish Bat Harmonic BUT into a Bullish Gartley with FibExThis might blow our minds.
Bearish BAT Harmonic to 0.5 playing out to possibly the red C wave retracement 0.382 BUT at the same time being the 0.618 from X to A leading into a bullish Gartley! Bullish gartley B to C can reject at 0.382, 0.5, 0.618 or 0.888 depicted is at 0.618. For a retracement back to a D.
Fib retracement from X to A to D gives a high range of the Butterfly Harmonic posted here:
This corresponds with BTCUSDT Gartley Harmonic which gave me this idea posted here:
Just a
AMZN butterfly & $192.The stock trend of Amazon (AMZN) in 2024 showed significant upward movement, with the price reaching a peak of $230 and a low of $145 during the year, driven by strong market performance and investor confidence.
However, In 2025 based on technical analysis, the formation of a Butterfly harmonic pattern suggests a highly probable correction toward the $190 level .
This pattern, often appearing after an extended bullish trend, indicates a potential reversal. Given the current market dynamic
Pepe Butterfly Gartley UpdateHey guys, Pepe Butterfly Gartley just hit the target low at (D) which is now extended to 1.618 if the target is probably hit.
For S and R levels I'm using the "Day Trading Booster BY DGT". Great indicator for day trading levels.
Target high on D retracement back to (A) top of the range.
This is an update that originally started here:
This idea also goes with my posted idea "Pepe USDT Day Trading Idea 1 March 2025".
Pepe Butterfly Gartley Update - Daily Fib Resistance LevelsHey guys, Pepe Butterfly Gartley just hit the target low at (D).
Although a bullish gartley, we still have to make sure we dont lose the lowest low just put in. That would invalidate the pattern.
Fibs - bright numbers on the right are all valid resistance levels up until 0.618 to see lower! Would be good to clear 0.618 and monthly resistance for some strength in the uptrend.
Usually this pattern is bullish in terms that the price will retrace (up) to point A.
Down trend, given the big
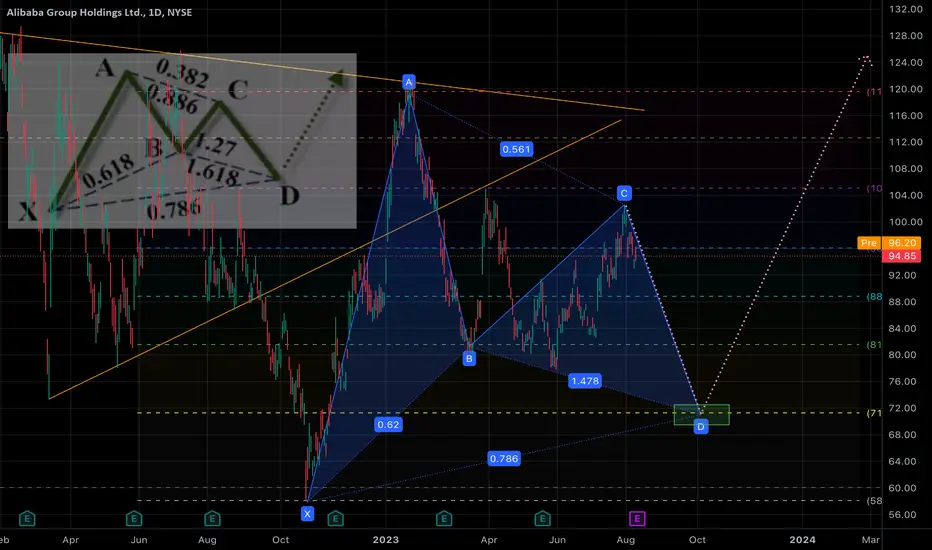
The reduction target is $70-73According to the Butterfly pattern, the Fibo perfectly converges the decline to the target of $ 70-73. The timing is not clear when we will get there, but according to the schedule of the decline of #HSI1, we should reach it by October 2023, there will be an excellent point for going to long to new heights.
PTM Platinum Asset Mgmt (ASX) Monthly 2Monthly chart has clear 5 wave move into longer term bullish fibonacci cluster level
This stock has taken a battering over the last few years and recently there is a monthly spinning top outside of the bollinger bands and a gap on the weekly at $1.05, so there is at least 25-30c to close this...
I'm looking at the longer term bullish bias, so wont be trading this as a short to medium term trade...
Full disclosure... I already have a position in this stock within the last month or so
PLong
PTM Platinum Asset Mgmt (ASX) Monthly Long term butterfly pattern on the Monthly
Hit long term fibonacci cluster,
I've already bought this as a long term position
PLong
Bearish Logscale Butterfly T2 with Bearish MACD & RSI DivergenceBitcoin appears to be set up at the 1.902 HOP for a Type 2 retest of the Logscale Bearish Butterfly that resulted in a major Type 1 reaction from the 1.618 Fibonacci Extension back in 2021, where it dropped from $69,000 to $15,500 over the course of several months before ultimately bottoming at the PCZ of a smaller Log Scale Bullish Butterfly which signaled the Type 2 run up to the 1.902 HOP of the Bearish Butterfly where it is now. As it tests this level the MACD and RSI are both Diverging
Lululemon is Getting Sour. LULUThis is not a perfect harmonic, far from it. The AB bounce is quite high, although mostly in wick, and BCD is only 0.786 of XAB fibtime wise. Nonetheless, vWAP cross happened with the bearish engulfing and Ehlers UltraSmoother is resistant with down going gradient. Stoch/RSI and VZO flipped a while back and %PCT has been progressively dropping and will no doubt flip soon with that bearish candle.
Reversal on Mondelez Looking Favorable. MDLZA clear Elliott 5 wave impulse down is complete, along with classical divergences on the momentum indicator. Willing to bet that this is a reversal with MIDAS line cross and US/vWAP acting as resistance in synchronicity. Interestingly, there's a double harmonic that formed in the more long term aspect - a deep Bat and a butterfly within deep bat. VZO and Ehlers Stoch/RSI are divergent, so disregarding the readings in this instance.
Up,Up and Away for NVidia. NVDAThere is a constellation of indicator crosses that add meaning to go long on this one, at least in the short run. There is a confluent cross of VZO plus offset and Ehler's Stochastic RSI. Also BB %PCT is looking to cross soon. Adding to the above, both the vWAP and US are supporting upward momentum on price, exiting OBOS area on momentum indicator, but most importantly there is a cross off the green MIDAS line. In our experience any cross of a volume/volatility line is highly, highly significant
Tick Tock, It's Melting Time!Oh, look at Gold Butterfly thinking it's all that! But guess what, Gold Butterfly?
Your golden days are numbered! You're about to start declining from your fancy Fibonacci level at 2812 bucks.
Yeah, that's right, time to say goodbye to the high life and start melting down those gold bars.
You thought you were so precious, but turns out you're just like everyone else - on the decline! Better start looking for a new gig, Gold Butterfly, because your time in the spotlight is fading faster tha
Gold Today Outlook
AronnoFX will not accept any liability for loss or damage as a result of
reliance on the information contained within this channel including
data, quotes, charts and buy/sell signals.
If you like this idea, do not forget to support with a like and follow.
Traders, if you like this idea or have your own opinion, please feel free command me.
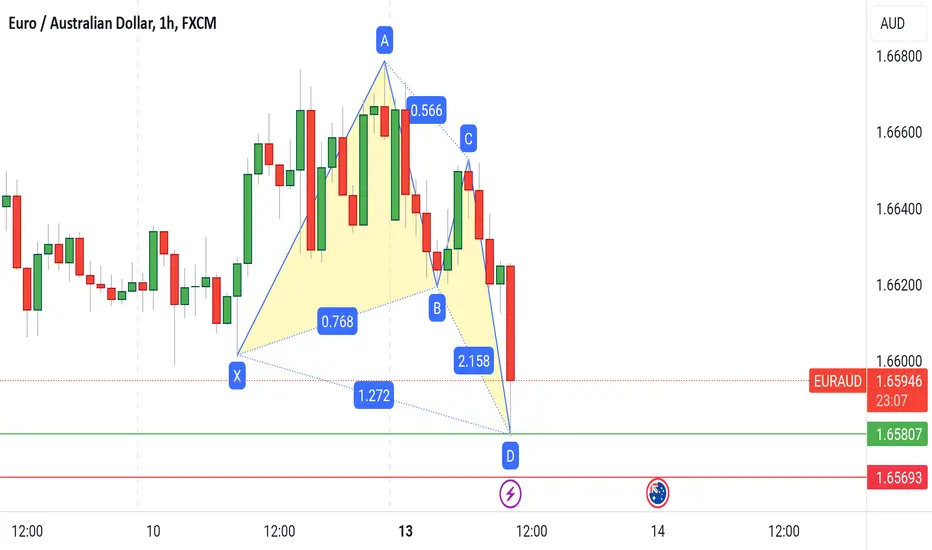
EURCAD BUTTERFLY PATTERNHarmonic Pattern Trading Strategy:
1. Combine patterns with 2-3 confirmations (e.g., MA, BB, RSI, Stoch) for increased accuracy.
2. Implement proper risk management.
3. Limit exposure to 3% of capital per trade.
4. Exercise caution: Not every Harmonic Pattern presents a good trading opportunity.
5. Conduct thorough diligence and analysis before trading.
Disciplined approach = Enhanced edge.
BUTTERFLY PATTERNHarmonic Pattern Trading Strategy:
1. Combine patterns with 2-3 confirmations (e.g., MA, BB, RSI, Stoch) for increased accuracy.
2. Implement proper risk management.
3. Limit exposure to 3% of capital per trade.
4. Exercise caution: Not every Harmonic Pattern presents a good trading opportunity.
5. Conduct thorough diligence and analysis before trading.
Disciplined approach = Enhanced edge.