Long
Long
 Long
Long
 Long
Long
Goldman Sachs Pulls BackGoldman Sachs hit a new high two weeks ago, and now it’s pulled back.
The first pattern on today’s chart is the May 22 weekly close of $996.73. GS bounced slightly above that level on June 10 and now is showing potential signs of stabilizing in the same area. Is new support getting established?
Second, the investment bank made a lower low and higher high yesterday compared with the preceding session. That bullish outside candle could suggest that the most recent slide is ending.
Next, stochastics have dipped to an oversold condition and prices are near the bottom of the Keltner Channel.
Finally, the 20-day simple moving average (SMA) is above the 50-day SMA. Both are above the 100-day SMA, which is also above the 200-day SMA. Such an alignment, with faster SMAs above slower ones, may reflect a longer-term uptrend.
TradeStation has, for decades, advanced the trading industry, providing access to stocks, options and futures. If you're born to trade, we could be for you. Learn more here about TradingView’s Broker of the Year!
Past performance, whether actual or indicated by historical tests of strategies, is no guarantee of future performance or success. There is a possibility that you may sustain a loss equal to or greater than your entire investment regardless of which asset class you trade (equities, options or futures); therefore, you should not invest or risk money that you cannot afford to lose. Online trading is not suitable for all investors. View the document titled Characteristics and Risks of Standardized Options at www.TradeStation.com . Before trading any asset class, customers must read the relevant risk disclosure statements on www.TradeStation.com . System access and trade placement and execution may be delayed or fail due to market volatility and volume, quote delays, system and software errors, Internet traffic, outages and other factors.
Securities and futures trading is offered to self-directed customers by TradeStation Securities, Inc., a broker-dealer registered with the Securities and Exchange Commission and a futures commission merchant licensed with the Commodity Futures Trading Commission). TradeStation Securities is a member of the Financial Industry Regulatory Authority, the National Futures Association, and a number of exchanges.
TradeStation Securities, Inc. and TradeStation Technologies, Inc. are each wholly owned subsidiaries of TradeStation Group, Inc., both operating, and providing products and services, under the TradeStation brand and trademark. When applying for, or purchasing, accounts, subscriptions, products and services, it is important that you know which company you will be dealing with. Visit www.TradeStation.com for further important information explaining what this means. Nifty Analysis EOD – July 2, 2026 – Thursday🟢 Nifty Analysis EOD – July 2, 2026 – Thursday 🔴
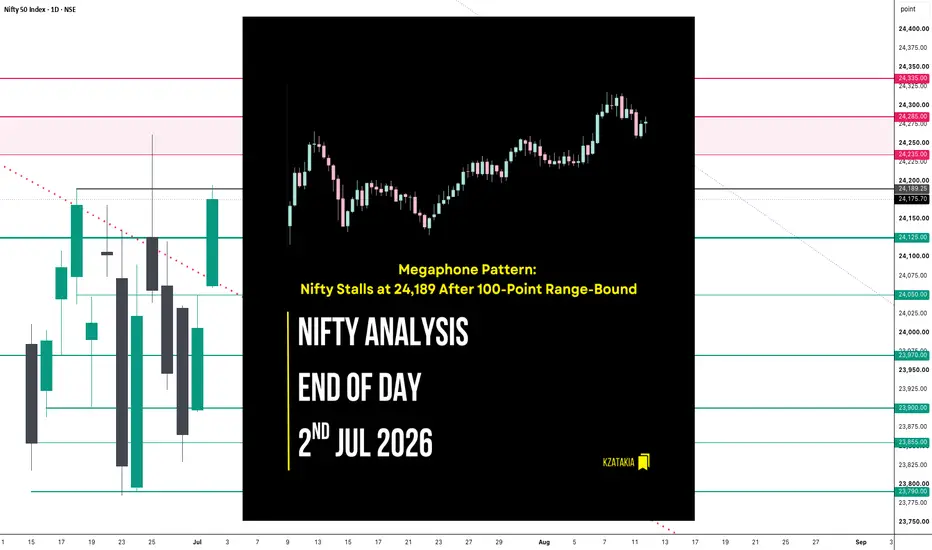
Megaphone Pattern: Nifty Stalls at 24,189 After 100-Point Range-Bound
🗞 Nifty Summary
Nifty opened with an 87-point gap up above PDH and the LTF trendline, found base just 17 points below the open, and then ran another 100 points to the upside within 30 minutes — breaking through the resistance zone of 24,075 ~ 24,125 smoothly to mark the high at 24,159.45 at that stage. Unable to hold up there, price slipped back 84 points and came down to CDO, where CDO held as support. For the next hour or so, Nifty stayed boxed inside a 30-point range. Price tested CDO once more, formed a Double Bottom, and moved up sharply toward 24,125, trying to clear this resistance — and that’s when a rare Megaphone pattern started building, one that stays active into the next session. Before the IBH breakout, price stayed stuck within 10-15 points for close to 40 minutes. Around 2:30 PM, the long-awaited IBH breakout finally came, but it faced rejection at 24,189.25 (previous swing high), and the day closed at 24,167.95, with adjusted closing at 24,175.70.
Most of the session played out inside the 100-point IB range, and even after the breakout, the total intraday range stayed within 135.75 points. I was watching for the previous day’s inside bar pattern target of 24,240 to get tapped — the gap-up open and that first 30-minute, 100-point move looked promising, but the day couldn’t quite capture the benefit of that setup.
🛡 5 Min Intraday Chart with Levels
📉 Daily Time Frame Chart with Intraday Levels
🕯 Daily Candle Breakdown
Open: 24,062.20
High: 24,194.55
Low: 24,058.80
Close: 24,175.70
Change: +169.85 (+0.71%)
🏗️ Structure Breakdown
Type: Strong Bullish — buyers stayed in control through most of the session
Range: ≈ 135.75 points — low volatility
Body: ≈ 113.50 points — steady buying pressure through the session
Upper Wick: ≈ 18.85 points — mild rejection near the highs, some supply showing up close to 24,189
Lower Wick: ≈ 3.40 points — barely any selling pressure, demand held close to the open
🛡 5 Min Intraday Chart
⚔️ Gladiator Strategy Update
ATR: 239.26
IB Range: 100.65 → Medium
Market Structure: ImBalanced
Trade Highlights:
11:06 Short Trade: Trailing SL Hit
12:14 Long Trade: Target Hit (R:R 1:3.06)
Trade Summary: Two trades today — the short at 11:06 gave back its gains as the trailing SL hit, while the long at 12:14 caught a clean target at R:R 1:3.06. Good to see the system lock in a solid R:R trade even inside this choppy, ImBalanced structure. Missed riding the IBH breakout follow-through though, stayed more a conservative trader on that second leg. Small win, no real damage — I’ll take that as a decent day for a learner like me.
🧱 Support & Resistance Levels
Resistance Zones: 24,189 | 24,235 ~ 24,285 | 24,335
Support Zones: 24,125 | 24,050 | 23,970
🧠 Final Thoughts
“Some walls don’t fall on the first push — they just remind you to wait for the second one.”
What stood out today was the Double Bottom at CDO holding up twice, and that Megaphone pattern building right as price pushed into 24,125. Doesn’t happen often, so I’m watching how it plays out.
If 24,189 gives way, 24,235 ~ 24,285 and then 24,335 could open up above. If 24,125 doesn’t hold, 24,050 and 23,970 come into play on the downside.
With the Megaphone still active, tomorrow might open with a bit more movement than usual, so staying patient on the first move feels like the right approach.
✏️ Disclaimer
This is my personal digital diary and represents my own analysis and point of view. It is not financial advice; please consult a professional advisor before making any trading decisions. Long 
 Long
Long
GBPUSD with Engulfing by INTELA strategyEngulfing Pro by INTELA + RVOL Context
Overview
Engulfing Pro by INTELA is a price action strategy designed to identify high-probability Engulfing patterns and filter them using Relative Volume (RVOL) analysis. The goal is not simply to trade every engulfing candle, but to distinguish between low-quality signals and those backed by meaningful market participation.
The strategy combines three key concepts:
Engulfing Price Action
Market Structure & Location
Relative Volume Confirmation (RVOL)
By incorporating volume context, traders can avoid many of the false signals commonly associated with traditional engulfing setups.
Core Idea
Not all engulfing candles are created equal.
An engulfing pattern occurring in the middle of a range, with average or declining volume, often lacks conviction and tends to produce inconsistent results.
Conversely, when an engulfing candle appears:
✅ At a significant swing point
✅ Near a support or resistance zone
✅ After a pullback or retest
✅ Accompanied by above-average relative volume
the probability of a meaningful move increases significantly.
The strategy seeks to identify these high-quality situations.
Relative Volume (RVOL) Filter
One of the most important components is the RVOL analysis.
Instead of comparing current volume against a simple moving average of recent candles, the indicator compares volume against the average volume of the same time period from previous trading sessions.
This provides a more realistic assessment of market participation by accounting for intraday volume cycles.
Example
A volume spike occurring at 09:00 should not be compared to volume recorded during a low-liquidity period such as lunchtime.
Instead, it is compared to the historical average volume of previous 09:00 candles.
This creates a more accurate measure of whether institutional or large-player activity is entering the market.
Signal Classification
✅ High-Quality Signals
Characteristics:
Strong engulfing candle
Occurs at market extremes, swing highs or swing lows
Supports the prevailing market narrative
RVOL above normal levels
Clear profit objective nearby
Examples:
Reversal after a liquidity sweep.
Pullback continuation during a strong trend.
Retest of a breakout level.
❌ Low-Quality Signals
Characteristics:
Engulfing pattern inside consolidation.
Signal appears directly into resistance or support.
Low or average RVOL.
Poor risk-to-reward profile.
Appears after an extended move without structure.
These setups are often ignored, even when the engulfing pattern itself is technically valid.
Entry Logic
The strategy is designed around limit-order execution rather than chasing momentum.
Bullish Setup
Bullish engulfing candle forms.
RVOL confirms participation.
Buy limit order placed at 80% retracement of the engulfing candle.
Stop-loss placed at the opening price of the engulfing candle.
Pending order expires after a predefined number of candles if not triggered.
Bearish Setup
Bearish engulfing candle forms.
RVOL confirms participation.
Sell limit order placed at 80% retracement of the engulfing candle.
Stop-loss placed at the opening price of the engulfing candle.
Pending order expires if price fails to retrace within the allowed time window.
What This Strategy Tries to Achieve
The objective is not to generate a large number of trades, but to focus on quality opportunities where:
Price action shows intent.
Volume confirms participation.
Market structure provides context.
Risk remains clearly defined.
This creates a more selective trading approach that prioritizes location and conviction over signal frequency.
Disclaimer
This tool is intended for educational and analytical purposes only. No indicator or strategy can predict market movements with certainty. Always perform your own analysis and apply proper risk management before trading live capital.
"The engulfing pattern provides the signal. RVOL provides the conviction. Market structure provides the context." – INTELA Short 
 Long
Long
BTC/USD | Bitcoin Still Fighting Around $60K! (READ THE CAPTION)By analyzing the #Bitcoin chart on the weekly timeframe, we can see that all assumptions from the previous analysis remain valid. BTC is once again trading around the key $60,000 region, and the market is still trying to decide whether buyers can reclaim this psychological level or not.
Right now, the $58,000 – $60,000 area remains one of the most important demand zones on the chart. If Bitcoin manages to stabilize above $60K, we could see a short-term recovery toward $63,000, followed by $66,000, and potentially $70,000 if momentum improves.
On the downside, if buyers fail to defend this region, the next important demand zone remains between $52,500 – $56,000.
The market has not received many positive catalysts recently, and that can increase fear among traders. However, for long-term investors, these types of demand zones can still be attractive accumulation areas if they manage risk properly and avoid emotional entries.
For now, patience is key. Bitcoin is sitting at a major decision zone, and the reaction around $60K will likely shape the next major move.
Please support me with your likes and comments to motivate me to share more analysis with you and share your opinion about the possible trend of this chart with me !
Best Regards , Arman Shaban Long 
Long 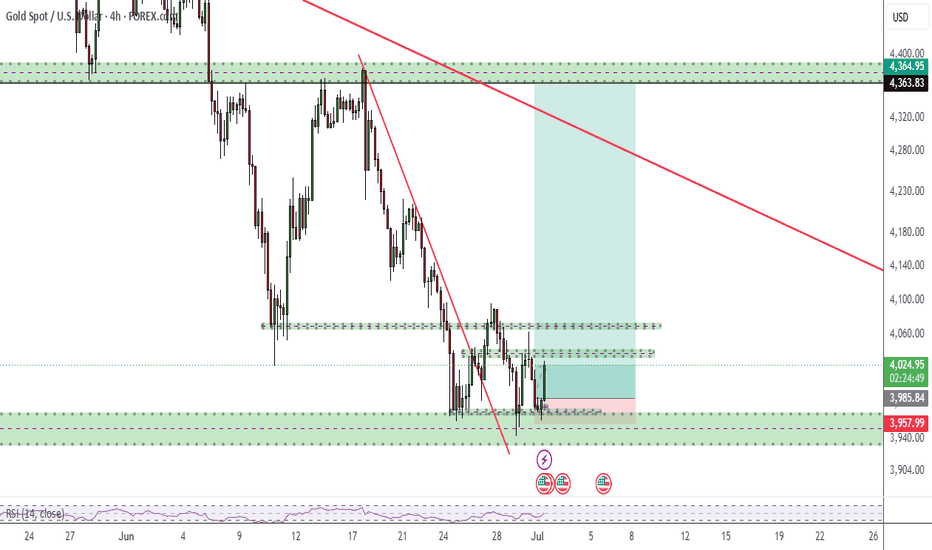
Nifty Analysis EOD – July 1, 2026 – Wednesday🟢 Nifty Analysis EOD – July 1, 2026 – Wednesday 🔴
Inside Bar Standoff: Nifty Holds Above 24,000
🗞 Nifty Summary
Nifty opened flat to positive and found a base around 23,895, then climbed steadily and gradually up to test 24,020. At this point it faced rejection and slipped sharply by 73 points, but VWAP came to the rescue. Another push higher led to a breach of PDH, though the index couldn’t sustain above it — IBH and R1 on the downside acted as support, and price formed an MC around the mid-session mark. The rest of the session was spent between 24,000 ~ 24,050, and the day closed at 23,988.10, with an adjusted close of 24,005.85, holding above the 24K mark.
Overall, as expected, today looked like a consolidation day — that holds up if we ignore the 15-point upper shadow above PDH, in which case the daily candle forms an inside bar pattern. This session is reminding me of the previous Wednesday’s move, the one right after the Nifty weekly expiry on 23 June.
Going into the next session, bulls will have to deal with the 24,075 ~ 24,125 zone, which could turn into a real hurdle, along with an LTF trendline have to face the same area.
Before any of that though, tomorrow’s opening tick matters most — if it opens inside today’s range, the breakout plan is clearer, but a gap up or down either side means waiting for IB to guide things.
The daily candle forming an inside bar suggests the market might still be deciding its next direction.
🛡 5 Min Intraday Chart with Levels
📉 Daily Time Frame Chart with Intraday Levels
🕯 Daily Candle Breakdown
Open: 23,897.65
High: 24,049.90
Low: 23,895.10
Close: 24,005.85
Change: +140.10 (+0.59%)
🏗️ Structure Breakdown
Type: Strong Bullish — buyers stayed in control through most of the session
Range: ≈154.80 points — moderate volatility
Body: ≈108.20 points — reflects fairly firm buying pressure through the day
Upper Wick: ≈44.05 points — a bit of rejection near the highs
Lower Wick: ≈2.55 points — barely any selling pressure, lows were defended easily
🛡 5 Min Intraday Chart
⚔️ Gladiator Strategy Update
ATR: 244.88
IB Range: 101.30 → Medium
Market Structure: Balanced
Trade Highlights:
09:29 Long Trade: Target Hit (R:R 1:3.62)
11:33 Short Trade: SL Hit
14:34 Short Trade: Trailing SL Hit
Trade Summary: The morning long trade worked out well, hitting target with a solid R:R of 3.62 — the system did its job there. The 11:33 short didn’t work and stopped out, and the 14:34 short also got stopped, though trailing at least protected part of that move. Two out of three not landing is a reminder that not every setup plays out, even when the logic looks fine going in. Still sticking with the process and taking whatever the day gives.
🧱 Support & Resistance Levels
Resistance Zones: 24040 | 24075 ~ 24125 | 24190 | 24235 ~ 24285
Support Zones: 23970 | 23900 | 23855 | 23790 | 23650 ~ 23620
🧠 Final Thoughts
“Some days the market just wants to breathe — today felt like one of those pauses.”
Today felt like a pause after the recent run — price pushed toward 24,020, got rejected, but never really broke down before buyers stepped back in near VWAP.
The 24,075 ~ 24,125 zone looks like the next real test, and the LTF trendline sits right around there too. If tomorrow opens inside today’s range, the plan is clearer; a gap either side and it’s probably better to just wait for IB to settle first.
Nothing to force here — just watching how price reacts at that zone before deciding anything.
✏️ Disclaimer
This is my personal digital diary and represents my own analysis and point of view. It is not financial advice; please consult a professional advisor before making any trading decisions. XAU/USD | Gold Holding Key Demand Zone, Recovery Ahead?By analyzing the #Gold chart on the 2H timeframe, we can see that after the recent volatility, the initial bearish move played out as expected, although price dropped slightly deeper than anticipated. Currently, Gold is trading around the $4025 region. In my view, we may first see a short-term pullback before the next bullish attempt begins. The most important area to watch is the $3990 – $3997 demand zone. As long as price holds above this region, the short-term recovery scenario remains valid.
The nearest demand zones are located around $3990 – $3997, followed by deeper support around $3958 – $3970. On the upside, the closest supply zones are around $4045 – $4060, followed by the stronger resistance area between $4092 – $4125.
If buyers defend the current demand zone, the next short-term upside targets to monitor are $4045, followed by $4060, then $4092, $4100, and potentially $4125 if bullish momentum continues to build. For now, I expect a minor correction first, then another bullish attempt as long as Gold continues to hold above the key $3990 – $3997 zone.
Please support me with your likes and comments to motivate me to share more analysis with you and share your opinion about the possible trend of this chart with me !
Best Regards , Arman Shaban Long 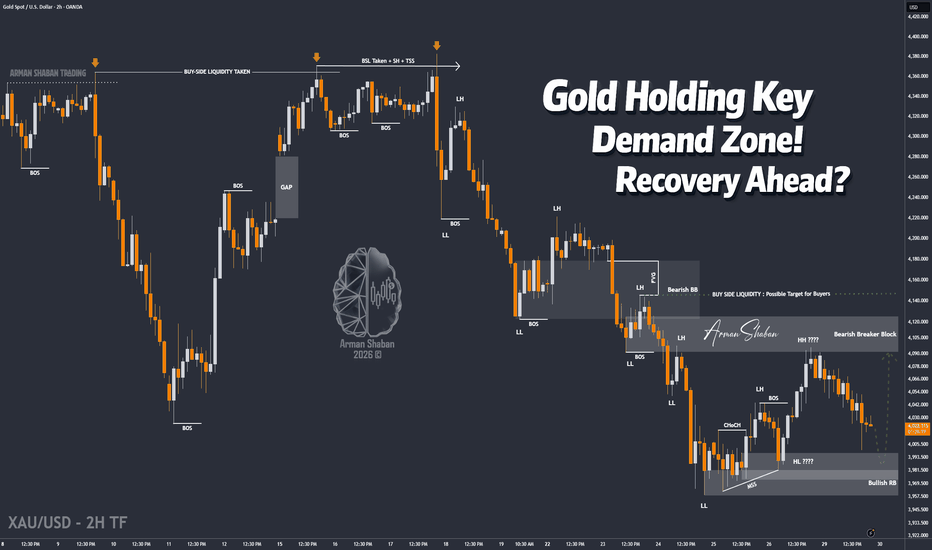
Long 
Long 

 Long
Long


 Long
Long