
Crude oil slides as bullish catalysts fail to fireIf you can’t get crude rallying on the threat of Iranian barrels being removed from the market and energy exports from the Gulf being permanently blocked, what does that tell you about where the path of least resistance may lie for crude oil in the near term?
That’s the question I and others are likely asking themselves in the wake of Monday’s unusual decline.
First we saw WTI comprehensively rejected at downtrend resistance that has been in place from the high set in the early stages of the Iran war late last week. Then Monday’s unwind completed a three-candle evening star, warning of reversal risk following the bounce from early August.
Now, that does not mean we’re about to see some immediate unwind. But it does make price action today important for confirmation.
The level I’m watching is $83.60 a barrel. It is only a minor, although it has acted as both resistance and support several times this month.
A break and close beneath $83.60 would build confidence in the prospects for a sustained extension of Monday’s move, presenting a setup where shorts could be initiated beneath the level with a tight stop above for protection, targeting lower levels.
The first would be $80, where the price found support in the middle of this month. Beneath that, the next area of interest sits between $78.40 and $77.33 a barrel, with the confluence of the 50-day and 200-day simple moving averages and horizontal support at $77.50.
If WTI were to break the uptrend running from the July lows, it would bode well for a possible retest of the lows set in July, given the price has been coiling in a symmetrical triangle structure over the past couple of months.
Like the price action, the message from the oscillators is one of increasing caution for the bulls. RSI (14) has broken the uptrend that had been in place from the August low and is now sitting only marginally above the neutral 50 level. MACD is also converging with the signal line, although it remains positive.
The broader message is that upside momentum is showing signs of dissipating, adding to the sense that directional risks may be shifting.
Of course, If I'm wrong and we see a break above downtrend resistance running from the March highs, it would point to an increased probability of an extension of the bounce from the low set earlier this month, putting $87.65, $93.30 and $95 a barrel in play for longs.
Good luck!
DS  Short
Short
Long trade
📊 BTCUSD — POC / VALUE-AREA READ
Monday 24 August 2026
Entry Time: 12:00 PM NY Time
Session: NY Session PM
Direction: 🟢 Buyside
From the chart, the trade details appear to be:
Entry: ~79,143.69
Target: ~79,985.49 (+1.064%)
Stop: ~78,937.02 (0.261%)
RR: 4.07R
POC / Value Map
Visible profile references:
Developing VA Low: ~76,991.92
Developing POC: ~77,275.64
Developing VA High: ~77,393.28
Modified VWAP: ~77,821.01
Current price: ~79,777
Target: ~79,985
POC Narrative
BTC has already completed the major lower-value recovery.
Price is now trading well above the developing POC, VAH and VWAP, which tells us this is no longer a mean-reversion setup. It is a higher-value continuation/expansion trade.
The auction has progressed through:
76.99K VAL → 77.28K POC → 77.39K VAH → 77.82K VWAP → 79.14K entry → 79.98K target
That is strong bullish value migration.
What the POC Is Telling Us Now
The important point is that the entire developing value area is now far beneath current price.
That means buyers have already forced the market out of balance and into a higher-price discovery phase. As long as BTC holds above the 79.1K entry/breakout region, the POC structure supports continuation rather than a return to the old value area.
The next logical objective is the upper liquidity around 79.98K–80K. If BTC fails back below 79.14K and begins accepting lower, then the market could start rotating toward the nearest internal support before any deeper return toward VWAP.
SNAP POC Read
MAP → value established around 77K
RAID → lower liquidity already worked
RECLAIM → POC / VAH / VWAP all recovered
SHIFT → bullish value migration confirmed
EXECUTE → ~79,143.69
CONFIRM → acceptance above the breakout region
PAY → 🎯 ~79,985 / 80K liquidity
Final Read
✅ POC reclaimed
✅ VAH reclaimed
✅ VWAP reclaimed
✅ Price in higher-value discovery
✅ Entry above old value
✅ Clear external liquidity at ~80K
✅ 4.07R planned asymmetry
POC roadmap:
76.99K VAL → 77.28K POC → 77.39K VAH → 77.82K VWAP → 79.14K Entry → 79.98K PAY
@SNAPTradingFramework  Long
Long
Nasdaq: Lower Low and Lower HighsThe Nasdaq-100 has limped for months, and some traders may see more difficulties ahead.
The first pattern on today’s chart is the series of lower highs since early June. Combined with July’s lower low, those might reflect weakening in the intermediate term.
Second, NDX probed slightly above its previous week’s high last Monday, August 17. However, it was quickly rejected and fell under the week’s low. The resulting bearish outside candle is a potential reversal pattern.
Third, MACD has turned negative.
This tepid price action comes at a time of historic earnings growth. Does that reflect doubts that conditions will remain as strong in coming months?
TradeStation has, for decades, advanced the trading industry, providing access to stocks, options and futures. If you're born to trade, we could be for you. Learn more here about TradingView’s Broker of the Year!
Past performance, whether actual or indicated by historical tests of strategies, is no guarantee of future performance or success. There is a possibility that you may sustain a loss equal to or greater than your entire investment regardless of which asset class you trade (equities, options or futures); therefore, you should not invest or risk money that you cannot afford to lose. Online trading is not suitable for all investors. View the document titled Characteristics and Risks of Standardized Options at www.TradeStation.com . Before trading any asset class, customers must read the relevant risk disclosure statements on www.TradeStation.com . System access and trade placement and execution may be delayed or fail due to market volatility and volume, quote delays, system and software errors, Internet traffic, outages and other factors.
Securities and futures trading is offered to self-directed customers by TradeStation Securities, Inc., a broker-dealer registered with the Securities and Exchange Commission and a futures commission merchant licensed with the Commodity Futures Trading Commission). TradeStation Securities is a member of the Financial Industry Regulatory Authority, the National Futures Association, and a number of exchanges.
TradeStation Securities, Inc. and TradeStation Technologies, Inc. are each wholly owned subsidiaries of TradeStation Group, Inc., both operating, and providing products and services, under the TradeStation brand and trademark. When applying for, or purchasing, accounts, subscriptions, products and services, it is important that you know which company you will be dealing with. Visit www.TradeStation.com for further important information explaining what this means.  Long
Long
BTCUSDT – Bearish Fade of the 78,9K Spike, Eyes on 62,7K LLBitcoin just fired off a sharp expansion into 79K, and the structure behind it looks weak and ready to fade back down.
Why This Level Matters:
The rally ran through the weekend with no correction, which usually sets up a violent snap-back. News-driven moves like this rarely hold, and the sharp push higher looks more like a liquidity hunt than genuine strength.
Gameplan / Primary Scenario:
We are fading this spike with two short entries (choose one of them). Early entry is active now at 76,850, and the ideal entry sits slightly lower into the 76K zone for a cleaner fill. From there we target a full retrace toward the 62,7K local lows. Stop sits above the expansion zone near 84,1K — wide by design, since the target more than justifies the risk. Just stay careful, because a final push into the expansion zone above is still possible before price rolls over.
If this added value, boost it forward. What are your thoughts?
Swallow Academy Short 

 Short
Short
Dow rebound echoes July's bullish setupAfter a big leg lower on Thursday, the Dow reversed sharply on Friday, bouncing from just above the 50-day moving average and the uptrend running from the April 30 low. The move itself came after a failed break beneath 52,800, a level that has repeatedly acted as both support and resistance over the past several months.
Rather than the bounce itself, what piqued my interest was how closely the price action mirrored what happened in late July. Back then, a similar test of the 50-day moving average and rising trendline sparked a sharp reversal that eventually carried the index to a record high of 54,747.
That puts 53,247 in focus today, the low set on Wednesday prior to Thursday’s leg lower. The price has recovered the level in Asian trade, and should it continue to hold above it, I think there is enough in Friday’s reversal to consider a potential long setup.
Longs could be set with a tight stop beneath 53,247 for protection, targeting a move back towards the record high at 54,747. The 54,000 area is worth watching along the way given the price repeatedly failed there earlier this month.
The main caveat on the setup comes from the oscillators. RSI (14) continues to trend back towards the neutral 50 level, suggesting upside momentum has faded from earlier in the month, while MACD has staged a bearish crossover and is also moving back towards zero. It's not an outright bearish signal but it's hardly bullish, either.
Even so, with the broader uptrend intact, the price action remains constructive while 53,247 holds. Of course, a sustained break back below 53,247 would invalidate the bullish setup.
Good luck!
DS  Long
Long
 Long
Long
Bitcoin (BTC/USD) Market Structure Breakout & Liquidity AnalysisBitcoin (BTC/USD) Market Structure Breakout & Liquidity Analysis Guide
This BTC/USD 1D chart represents a complete market cycle from downtrend, accumulation, structure shift, breakout, and potential continuation. Every candle provides information about buyer and seller strength, liquidity movement, and market direction.
---
1. Initial Bearish Candles — Selling Pressure
Large Red Candles:
These candles show aggressive selling momentum as sellers dominate the market.
Reason:
Strong supply entered the market, creating lower lows and bearish structure.
Long Wick Candles:
Price moved lower but recovered before closing.
Reason:
Buyers started defending lower price areas.
---
2. Accumulation Phase — Smart Money Activity
Small Body Candles:
Price moved sideways with reduced volatility.
Reason:
Market was balancing while buyers and sellers collected liquidity.
Repeated Support Rejection Candles:
Price tested the lower zone multiple times.
Reason:
Demand was present and sellers failed to push price lower.
---
3. Trendline Formation — Market Structure
Candles Respecting Black Trendline:
Price created higher lows while holding support.
Reason:
Buyers maintained control and protected the bullish structure.
Downtrend Resistance Candles:
Price repeatedly reacted from the falling trendline.
Reason:
Sellers were defending resistance until breakout confirmation.
---
4. Break of Structure (BOS) Phase
Strong Bullish Breakout Candle:
A powerful candle moved above previous resistance.
Reason:
Buyers overcame selling pressure and confirmed a market structure shift.
Follow-Up Bullish Candles:
Multiple candles continued higher.
Reason:
Momentum increased after BOS confirmation.
---
5. CHoCH (Change of Character) Phase
Reversal Candles Around CHoCH:
Price changed its previous bearish behavior.
Reason:
Market control shifted from sellers to buyers.
Higher Low Formation:
Candles created a stronger base.
Reason:
Buyers showed confidence at support levels.
---
6. Fair Value Gap (FVG) Reaction
Strong Expansion Candle:
Price moved quickly leaving an imbalance.
Reason:
Aggressive buying created a Fair Value Gap.
Pullback Candles Into FVG:
Price may revisit the imbalance area.
Reason:
Markets often rebalance before continuing.
---
7. Current Breakout Area
Large Green Breakout Candle:
Price broke above the consolidation range.
Reason:
Liquidity was taken and buyers gained momentum.
Small Correction Candles:
Temporary pullback after expansion.
Reason:
Traders take profits and new buyers enter.
---
8. Target Zone Candles
Movement Toward 82,708 Level:
Price approaches previous resistance.
Reason:
This area contains potential liquidity and selling pressure.
Break Above Previous High:
Strong continuation candles can target 97,701.
Reason:
New highs create further bullish expansion.
---
Final Trading Lesson
Every candle tells a story:
Big Body Candle = Strong Momentum
Long Wick = Rejection
Small Candle = Accumulation/Indecision
BOS Candle = Structure Confirmation
Retest Candle = Entry Confirmation
FVG Reaction = Institutional Interest
Professional traders do not predict every candle; they understand the reason behind candle movement using Price Action, Market Structure, and Liquidity Long 
Short 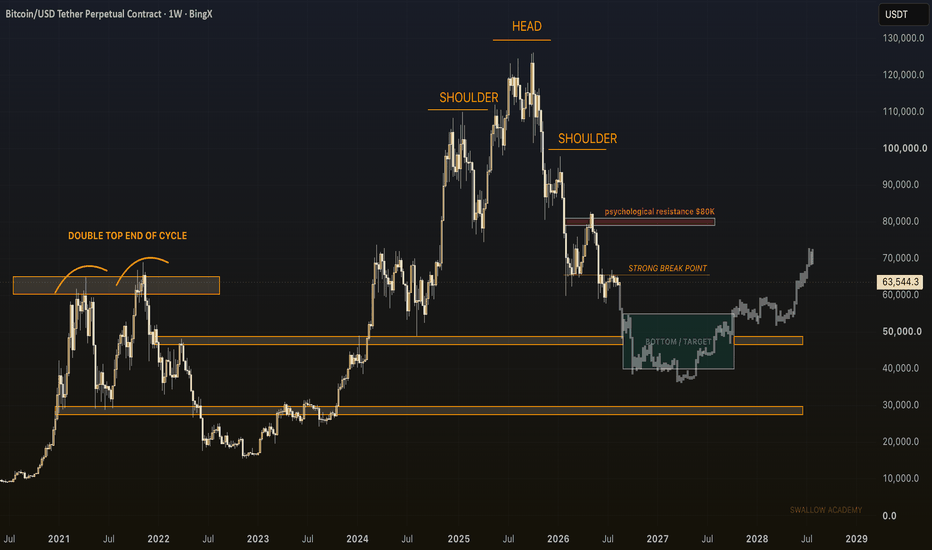
Short 
Possible accumulation pattern according to Wyckoff.The initial drop toward 60k comes with a significant increase in volume, which could correspond to a Selling Climax (SC). From there, we see a strong rebound toward 76k which we can interpret as the Automatic Rally (AR), followed by the development of the trading range.
The price returns several times toward the lower part of the range, even reaching 59k. For now, I interpret this as a Secondary Test, since we still haven't seen a clear Spring.
If we are indeed looking at an accumulation structure, I would expect the price to sweep the range lows again — the Spring — and quickly reclaim the structure. After that, we should see a Sign of Strength (SOS), eventually followed by a Last Point of Support (LPS).
The 76k area is important because it was the AR high. If price breaks above it and turns it into support, the structure would start to gain strength. A break above 82k would be a much clearer confirmation that the accumulation range is complete and the Markup phase is beginning.
It's also possible that the shakeout has already occurred and that the price is now moving higher to begin the expansion phase. Simple Break of Structure BoS Trading Strategy Explained
One of the best and most reliable strategies to trade a break of structure BoS is to apply multiple time frame analysis.
In this article, I will teach you my break of structure forex trading strategy. You will get a complete step-by-step guide with examples.
Let's start with a quick theory, and let me explain to you what a break of structure BoS is in Smart Money Concept SMC trading.
In a bullish trend, break of structure BoS is an important event that signifies a continuation of an uptrend. It is based on a violation and a candle close above the level of the last higher high (HH).
After a breakout, the broken level becomes the first strong support for trend-following buying.
Check multiple examples of confirmed breaks of structure BoS on GBPNZD forex pair on a weekly time frame.
In a downtrend, Break of Structure BoS means a bearish trend continuation. Break of Structure is considered to be confirmed when a candle closes below the level of the last lower low (LL).
The broken key level becomes the closest strong support for buying.
That's the example of a healthy downtrend on USDJPY forex pair on a daily. Each break of structure BoS pushed the prices lower, providing a strong signal to sell.
What newbie traders do incorrectly, they trade break of structure without a confirmation strategy, and it leads to substantial losses.
Though GBPCHF is trading in a bullish trend and though each BoS provided a trend-following signal. The price retraced significantly lower below the broken structure before the growth resumed.
When the price retests a broken structure after BoS in a bullish trend, start lower time frame analysis.
If you identified a break of structure on a daily, analyze 4h/1h time frames.
If on a 4H, then 30/15 minutes.
After the price sets a new higher high with BoS in uptrend, it usually starts trading in a minor bearish trend on lower time frames.
With our strategy, your signal to buy will be a retest of a broken structure and a consequent bullish Change of Character CHoCH. That will provide an accurate bullish signal.
In a bearish trend, analyze the lower time frames after a retest of a broken structure. Your signal to sell will be a bearish Change of Character CHoCH.
Look at a price action on EURCHF on a daily.
We see a strong bullish trend and a confirmed Break of Structure BoS.
According to the rules of our trading strategy, we start analyzing 4h/1h time frames after a retest of a broken level of the last Higher High.
Our signal to buy is an intraday bullish CHoCH. We open a long trade after that with the stop loss below the intraday lows and take profit being the current high.
That's how simple this strategy is.
Multiple time frame analysis provides the extra level of security.
Strong lower time frame confirmation substantially increases the win ratio of a trading setup.
❤️Please, support my work with like, thank you!❤️
I am part of Trade Nation's Influencer program and receive a monthly fee for using their TradingView charts in my analysis.  Education
 Long
Long
XAU/USD | Gold Breaks $4500,Now We’re Inside A Major Supply ZoneBy analyzing the #Gold chart on the 2H timeframe, we can see that after last night’s analysis, Gold finally managed to break above the psychological $4500 level and extended its rally all the way toward $4542.
Currently, Gold is trading around $4511 and has reached a very important supply area. The reaction from this zone will be extremely important for the next move.
We also need to remember that this aggressive rally created a large liquidity void on the chart. If sellers step in strongly from the current supply area and Gold drops below $4451 and stabilizes there, we could see a much deeper correction toward $4430, then $4400, and potentially $4370.
However, it is still too early to confirm that bearish scenario. Gold is currently holding above $4500, and if buyers manage to stabilize price above this psychological level, the bullish move could continue.
In that case, the next upside targets to monitor are $4530, followed by $4550, $4565, then $4580, and potentially the major $4600 level.
For now, $4500 remains the key level. Holding above it keeps the bullish scenario alive, while a strong rejection followed by a break below $4451 could completely change the short-term picture.
Please support me with your likes and comments to motivate me to share more analysis with you and share your opinion about the possible trend of this chart with me !
Best Regards , Arman Shaban Long 
Long 
 Long
Long
 Short
Short
BTC/USD | Bitcoin Explodes 27% Higher! Worth The 70-Day Wait? :)By analyzing the #Bitcoin chart on the weekly timeframe, we can see that the patience finally paid off. :)) In the previous analysis, I said Bitcoin had been painfully boring for more than 70 days, but that these long consolidation phases often end exactly when everyone gets tired of waiting. And that is exactly what happened.
Bitcoin started its move from around the $62K region, first filled the FVG we had been monitoring, and then continued pushing aggressively higher all the way toward $79,500. That is more than 27% growth from the analysis area. What a pump! I hope you managed to take advantage of this move.
The main bullish scenario is still valid. The next important area is the major supply zone around $81,000 – $87,000. If buyers manage to break through this region, the next upside targets I’m watching are $84,000, $87,000, then $90,000 – $96,000. If the larger bullish expansion continues after that, $100,000 becomes the next major psychological target, followed by the long-term supply area around $112,000 – $126,000.
For now, Bitcoin has finally woken up after more than two months of testing everyone’s patience. :)) Let’s see how far this bullish wave can go.
Please support me with your likes and comments to motivate me to share more analysis with you and share your opinion about the possible trend of this chart with me !
Best Regards , Arman Shaban Long 


