Turning Conflicting Signals into Structured DecisionsOne of the biggest misconceptions in trading is the belief that every good opportunity should look obvious. Many traders wait for every indicator, every chart pattern, and every momentum signal to point in the same direction before considering a position. While this sounds logical, markets rarely offer such perfect alignment.
Instead, they often present conflicting information. A chart may display a bullish pattern while momentum remains weak. A trend may appear constructive while resistance sits immediately overhead. Oscillators may begin improving before price confirms the move.
At first glance, conflicting signals appear to complicate decision-making. In reality, they can offer one of the most valuable lessons in trading: uncertainty is unavoidable, but risk can still be structured.
This idea can be illustrated using Ether futures as a practical case study.
Every Decision Has Pros and Cons
Trading is not unique in requiring decisions under uncertainty.
Buying a home involves weighing location against cost. Accepting a new job means balancing opportunity against risk. Starting a business requires optimism while acknowledging uncertainty.
Every meaningful decision contains arguments for and against it.
Financial markets are no different.
Waiting until every piece of evidence agrees often means waiting for a move that has already developed. On the other hand, acting on a single indicator while ignoring conflicting information can expose traders to unnecessary risk.
Rather than searching for certainty, experienced traders often focus on building a structured process for evaluating competing evidence.
The objective is not to eliminate uncertainty.
The objective is to make disciplined decisions despite uncertainty.
A Chart That Tells Two Stories
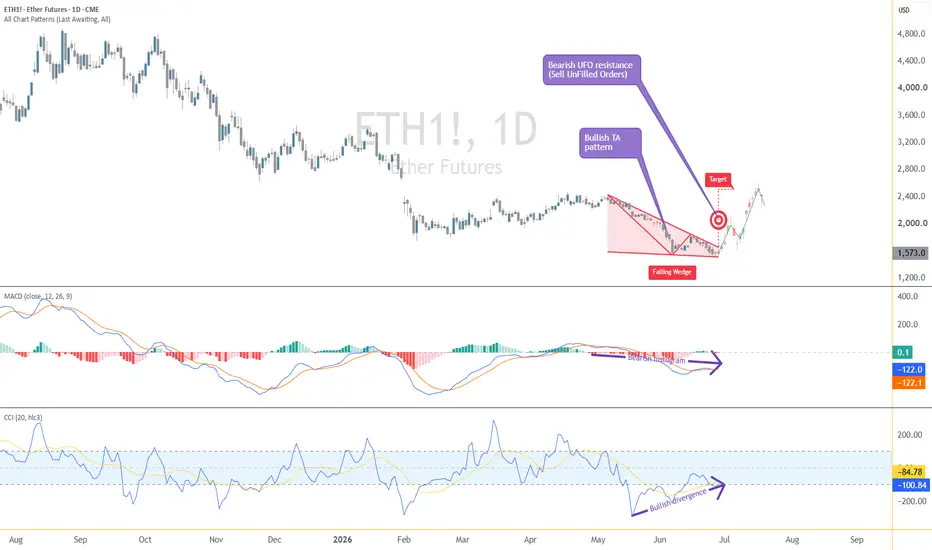
The accompanying daily chart of Ether futures provides an interesting example.
At first glance, several bullish characteristics are visible.
Price has developed a falling wedge, a classical chart pattern frequently associated with the possibility of an upside resolution after a period of declining prices. As the wedge narrows, selling pressure appears to become less aggressive, allowing buyers an opportunity to regain control.
The Commodity Channel Index (CCI) adds another constructive observation.
Although price recently produced lower lows, the CCI formed a bullish divergence, suggesting downside momentum may be weakening. Divergences do not guarantee reversals, but they often encourage traders to monitor price action more closely.
If those were the only observations available, many traders might conclude that the market presents a constructive technical picture.
However, the chart also contains meaningful bearish evidence.
Immediately above price lies a bearish UFO resistance (Sell UnFilled Orders) between approximately 1,959.0 and 2,140.5. This area represents a zone where previously unexecuted sell orders may still be waiting, potentially increasing selling pressure should price revisit the region.
Momentum also introduces caution.
The MACD histogram remains below the zero line, indicating bearish momentum has not fully reversed despite recent price improvement.
The result is a chart where neither buyers nor sellers possess overwhelming technical evidence.
Bullish signals exist.
Bearish signals exist.
Neither side completely dominates the discussion.
For many traders, this is exactly where uncertainty begins.
Replacing Opinions with a Decision Matrix
Instead of asking a simple question—
"Is this chart bullish or bearish?"
—it may be more useful to ask a different one:
"What evidence supports each side?"
Viewed this way, the chart becomes less emotional and more objective.
Bullish observations
Falling wedge pattern.
CCI bullish divergence.
Early signs that selling pressure may be slowing.
Bearish observations
Bearish UFO resistance directly overhead.
MACD histogram remains negative.
Overhead supply may limit upside progress.
Notice that none of these observations automatically invalidates the others.
All of them can be true simultaneously.
Markets frequently contain conflicting information because buyers and sellers are continuously expressing different opinions.
The purpose of technical analysis is not to identify certainty.
It is to organize evidence into a structured decision-making process.
The Hidden Opportunity Inside Conflicting Signals
Many traders stop their analysis once they recognize conflicting signals.
They conclude that uncertainty means no opportunity exists.
Yet conflicting evidence often creates another characteristic that deserves attention.
When opposing technical arguments meet within a relatively narrow price range, the market frequently resolves the disagreement sooner rather than later.
In other words, the market may reveal relatively quickly which side has gained control.
This can create an important advantage from a risk management perspective.
Suppose a trader believes the bullish interpretation deserves greater weight.
If the bullish thesis is correct, price should continue respecting the falling wedge while attempting to challenge the overhead resistance.
If the bullish thesis is incorrect, the market may invalidate the pattern relatively quickly by breaking decisively below the wedge.
The chart therefore provides a clearly identifiable point where the original hypothesis would no longer be supported.
Rather than focusing exclusively on whether the market eventually moves higher, the trader can focus on whether the original idea remains valid.
This distinction is important.
Successful trading is often less about predicting direction and more about defining when a trading idea is no longer supported by evidence.
A Hypothetical Case Study
Consider a purely illustrative example.
A trader observes the falling wedge beginning to resolve to the upside while recognizing that meaningful resistance remains overhead.
Rather than assuming the bullish pattern must succeed, the trader constructs a hypothesis.
The hypothesis could be summarized as follows:
The falling wedge suggests buyers may be regaining control.
The bullish CCI divergence supports the possibility of improving momentum.
Overhead UFO resistance represents the first significant obstacle.
The bearish MACD histogram reminds traders that downside momentum has not fully disappeared.
Under this framework, a hypothetical long position might only be considered after sufficient confirmation that buyers are attempting to regain control.
Equally important, the trader defines an invalidation level before entering the position.
On this chart, a decisive move below approximately 1,504 would represent a meaningful breakdown beneath the falling wedge, suggesting the bullish technical structure has failed.
If that occurs, the original thesis would no longer be supported.
Notice that this approach is not built around certainty.
It is built around predefined risk.
Should the bullish interpretation prove incorrect, the trader knows relatively quickly that the hypothesis requires reassessment.
Conversely, if buyers continue gaining control, price may begin challenging the identified resistance area.
Whether the market ultimately succeeds or fails is less important than the process itself.
The lesson is that structured decisions begin with clearly defining both the opportunity and the conditions under which that opportunity no longer exists.
Ether Futures and Micro Ether Futures
This case study uses CME Ether futures and Micro Ether futures to illustrate the concepts discussed above.
The standard Ether futures contract (ticker: ETH) represents 50 ether, providing exposure suitable for larger notional positions. The Micro Ether futures contract (ticker: MET) represents 0.1 ether, allowing traders to adjust exposure in much smaller increments while following the same underlying market. Both contracts are cash settled using the CME CF Ether-Dollar Reference Rate.
From a contract specification perspective:
ETH (Ether Futures): The minimum price fluctuation for ETH is 0.50 index points, equivalent to $25.00 per contract.
MET (Micro Ether Futures): The minimum price fluctuation for MET is 0.50 index points, equivalent to $0.05 per contract.
Because cryptocurrency markets can experience elevated volatility, margin requirements may change over time.
At the time of writing, traders should expect approximately:
ETH Margin: approximately $25,000 per contract.
MET Margin: approximately $50 per contract.
These figures are exchange requirements and remain subject to periodic adjustment as market conditions evolve. Traders should always verify current requirements with their broker before initiating any position.
The availability of both standard and micro-sized contracts gives market participants flexibility to align position size with their individual risk management framework.
Risk Management Comes Before Direction
Perhaps the most valuable lesson from this chart has little to do with Ether itself.
It concerns risk management.
Charts containing conflicting signals remind traders that no indicator deserves absolute trust.
Instead of searching for perfect agreement, traders may benefit from asking three simple questions:
What evidence supports the trade?
What evidence argues against it?
At what price would my original idea no longer be valid?
Answering those questions before entering a position encourages discipline rather than emotion.
Equally important, a relatively small predefined risk does not imply a trade is "safe."
Unexpected news, volatility, and execution differences can always influence outcomes.
Position sizing should therefore remain consistent with an individual's overall trading plan, regardless of how attractive a particular technical setup may appear.
Being proven wrong quickly is not a failure.
Failing to recognize when the original hypothesis has been invalidated is often the greater risk.
Final Thoughts
Conflicting technical signals are often viewed as obstacles.
In practice, they can become valuable teachers.
They encourage traders to organize evidence objectively rather than searching for certainty where none exists.
The falling wedge, bullish CCI divergence, bearish UFO resistance, and bearish MACD histogram each contribute meaningful information.
None should be ignored.
Rather than asking which indicator is "correct," traders may find greater value in asking how all available evidence fits together within a structured decision-making process.
Markets will always contain uncertainty.
Good risk management does not eliminate that uncertainty.
It simply provides a disciplined framework for navigating it.
Data Consideration
When charting futures, the data provided could be delayed. Traders working with the ticker symbols discussed in this idea may prefer to use CME Group real-time data plan on TradingView: www.tradingview.com - This consideration is particularly important for shorter-term traders, whereas it may be less critical for those focused on longer-term trading strategies.
General Disclaimer
The trade ideas presented herein are solely for illustrative purposes forming a part of a case study intended to demonstrate key principles in risk management within the context of the specific market scenarios discussed. These ideas are not to be interpreted as investment recommendations or financial advice. They do not endorse or promote any specific trading strategies, financial products, or services. The information provided is based on data believed to be reliable; however, its accuracy or completeness cannot be guaranteed. Trading in financial markets involves risks, including the potential loss of principal. Each individual should conduct their own research and consult with professional financial advisors before making any investment decisions. The author or publisher of this content bears no responsibility for any actions taken based on the information provided or for any resultant financial or other losses.  Education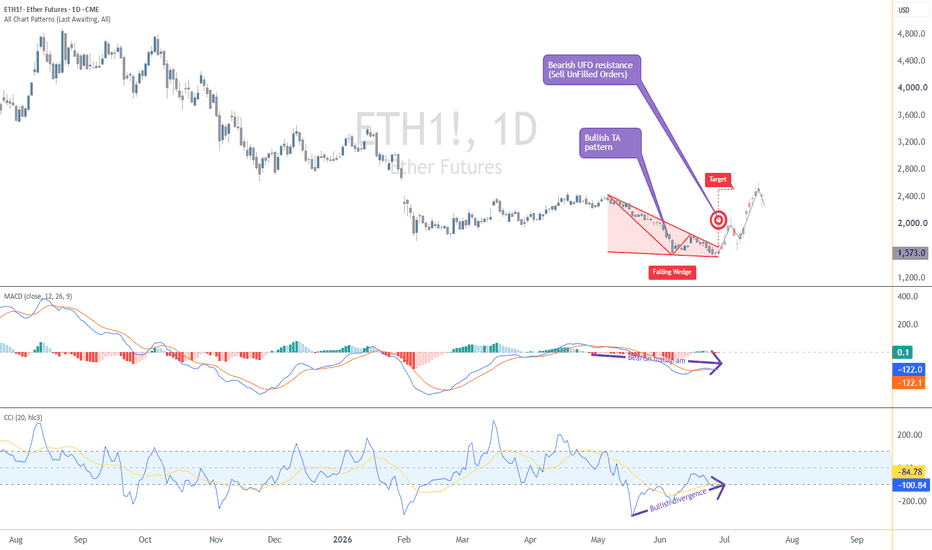
 Short
Short
JOBY: when the market doubts - smart money positionsJoby Aviation is currently at a point where fundamentals are moving ahead of price. While the market is still focused on losses, the company is already transitioning into real operations. A recent flight over San Francisco wasn’t a test — it was proof of execution in one of the most complex urban environments in the U.S. At the same time, participation in the eIPP program opens the path to early commercial operations across 10 states in 2026.This is no longer R&D - this is pre-revenue infrastructure scaling.
Financially , the company is built for this phase. Joby holds $1.4B in cash, with approximately $1.8B raised over the last six months, providing runway for aggressive expansion. Revenue remains limited at $31M per quarter, largely driven by Blade, while operating expenses stand at $238M and net loss at $122M - typical for a company transitioning into production. The 2026 outlook targets $105–150M revenue with projected cash usage of $340–370M in the first half. Meanwhile, FAA certification is progressing, manufacturing is expanding (Ohio + California), and international agreements (Dubai, Saudi Arabia, Kazakhstan, Uber, Delta) are already in place. This is not a concept - it’s an ecosystem being deployed.
Now to the chart - and this is where the real story unfolds.
After the impulse to $20.95, price entered a correction phase and is now trading near $8.97. The key structure on the chart is the 6.96–7.48 zone, where FVG + OTE + MA100 align with the golden pocket. This is not just support - this is a higher timeframe demand zone where liquidity is expected to be taken.
Above, the chart clearly marks $9.93 and $13.96 as key levels. A breakout above $9.93 confirms a structural shift and opens the path toward $13.96, where the next liquidity cluster sits.
Momentum indicators confirm a compression phase rather than continuation down. ADX at 24.87 signals lack of strong trend, while DI- (20.56) only slightly exceeds DI+ (19.06) - bearish control is weakening. CCI at -139.65 shows deep oversold conditions, while CCI MA at 5.78 is already curling upward - an early sign of momentum shift. PVO at 0.85% indicates weak volume expansion, and Volume Delta at -2.27M confirms selling pressure without aggression.
This is the key insight: the market is selling - but not pushing lower.
Price is currently trading in a low-liquidity zone between key levels, which explains the lack of impulse. Such phases always resolve with expansion — the only question is from which level.
The scenario is clear.
Either price reclaims $9.93, confirming structure shift and targeting $13.96,
or it moves into the 6.96–7.48 confluence zone, where FVG, OTE, and MA100 align - forming the strongest entry zone on the chart.
These are not emotional entries. These are planned ones.
Joby is not about current profitability - it’s about execution of a new market. The company has capital, infrastructure, regulatory progress, and global contracts. The only missing piece is scale.
Markets don’t wait for profitability.
They reprice when inevitability becomes clear.
And that moment often comes earlier than expected.  Long
Long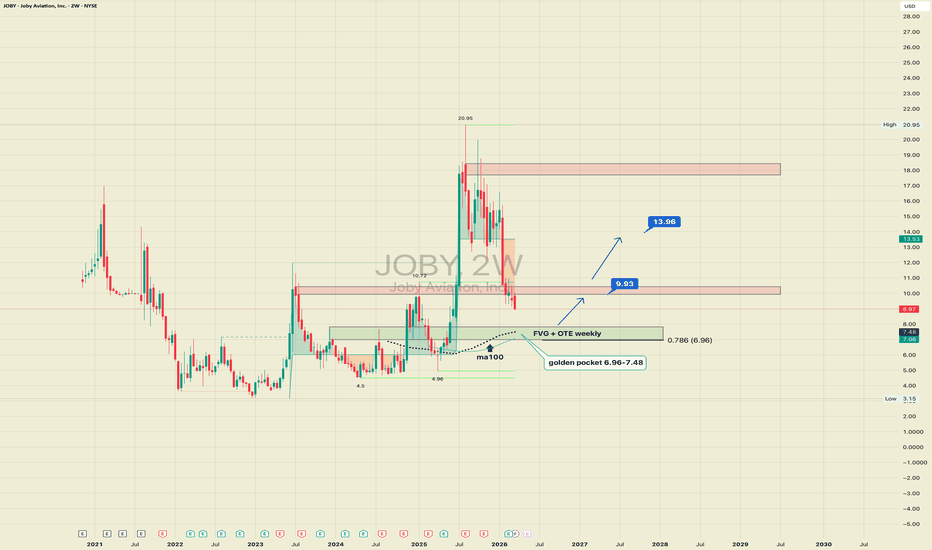
When Oversold Meets Support: A Timeless Market StrategyWhen Markets Stretch Too Far
Financial markets rarely move in straight lines. Instead, price tends to oscillate between phases of expansion and exhaustion as buyers and sellers continuously compete for control. During periods of strong directional momentum, price can move rapidly away from equilibrium, creating conditions where the market may become temporarily stretched.
Technical indicators are often used to measure these moments of imbalance. One widely used momentum indicator is the Commodity Channel Index (CCI), which helps traders assess when price movements may have reached statistically extreme conditions relative to recent price behavior.
However, experienced market participants typically avoid relying on indicators alone. Instead, they often look for confluence between momentum signals and structural price levels. In other words, an oversold indicator reading becomes more meaningful when it occurs near a historically relevant support zone.
The current setup in Euro FX futures traded at CME illustrates this concept well. A recent sharp decline has pushed momentum indicators into deeply oversold territory, while price simultaneously approaches a significant support area that aligns with a zone of UnFilled Orders (UFOs). When such factors align, traders may begin evaluating whether a potential stabilization or rebound attempt could emerge.
Understanding the Current Market Structure
The recent market structure shows a notable downside move that has brought price toward a historically relevant support level near 1.14240. In classical technical analysis, support zones represent areas where buying interest has previously emerged strongly enough to slow or reverse a decline.
These levels often attract attention because they reflect points where the market previously reached a temporary balance between supply and demand. As price approaches such areas again, traders often monitor whether participants are willing to defend the level once more.
In this case, the 1.14240 region has acted as a structural reference point within the broader price history. When markets revisit previously important zones, it frequently becomes a moment where market participants reassess risk and opportunity.
While support levels do not guarantee a reversal, they often become areas where decision-making intensifies, making them natural locations for traders to evaluate potential trade scenarios.
Momentum Exhaustion: Reading the CCI Indicator
Momentum indicators provide another layer of information about market conditions. The Commodity Channel Index (CCI) is designed to measure how far price deviates from its recent average, helping identify periods where the market may have moved too far in one direction.
In the current environment, the CCI has reached extreme oversold territory, indicating that the recent downward move has been unusually strong relative to recent price behavior.
Oversold conditions can sometimes persist during powerful trends, which is why momentum indicators alone are rarely used as trade signals. However, when extreme readings appear simultaneously with a structural support level, traders often begin watching the market more closely for signs that selling pressure could begin to slow.
This combination of momentum exhaustion and price support forms the foundation of many classical mean-reversion strategies. Rather than attempting to catch falling markets blindly, traders often wait for price to approach historically relevant levels while momentum indicators suggest that the move may be stretched.
When these elements align, the market may enter a phase where a potential stabilization or rebound attempt becomes possible, although outcomes always remain uncertain.
Order Flow Perspective
Beyond traditional technical analysis, many traders also study market structure through the lens of order flow. One concept often used in this context is the idea of UFO levels, where UFO refers to UnFilled Orders.
These zones can form when price moves rapidly through a region, leaving behind clusters of institutional orders that were never fully executed. Because these orders remain in the market, they can sometimes influence future price behavior when the market revisits those levels.
In the current setup, the technical support around 1.14240 aligns closely with a UFO support zone. This alignment creates a form of technical confluence, where two independent analytical approaches point toward the same price region.
Confluence does not eliminate uncertainty, but it can increase the significance of a level because it suggests that multiple groups of market participants may be watching the same area.
On the opposite side of the market, the chart also reveals multiple UFO resistance levels stacked above current price, with the lowest one beginning near 1.18200. Areas where multiple resistance zones cluster together can sometimes act as potential locations where rallies begin to lose momentum.
Defining the Trade Scenario
The classical principle behind this setup is simple: buy near support and consider exiting near resistance. This idea has been part of technical analysis for decades and remains widely studied across many markets.
In this scenario, traders observing the current structure might evaluate the following framework.
Potential Entry Zone
The primary area of interest lies near the support region around 1.14240.
When multiple signals converge in the same area, some traders consider this a potential location where price may attempt stabilization.
Potential Target Area
Looking above the current market, the first major cluster of resistance appears near 1.18200, where several UFO resistance levels are stacked on top of one another.
Clusters of resistance can sometimes act as areas where upward movements begin to slow as selling interest increases.
Because of this structure, traders analyzing this scenario might view the 1.18200 region as a potential area where a long trade could be closed if the market was to rebound.
Stop Placement and Risk Structure
Risk management is a critical component of any trading plan. In this example, a typical framework would involve placing a protective stop below the support level.
Rather than selecting a random stop distance, some traders structure their trades around a predefined reward-to-risk ratio. A common guideline used in many trading plans is a 3-to-1 reward-to-risk relationship.
In practical terms, this means the potential reward toward the resistance target would be approximately three times larger than the distance between the entry point and the protective stop. This type of structure allows traders to maintain consistency in how they manage risk across different market environments.
Contract Specifications
Understanding contract specifications is essential when trading futures, as these details determine the size and risk exposure of each position.
Euro FX Futures (6E)
Traded on CME, the standard Euro FX futures contract represents €125,000.
Key specifications include:
Minimum tick: 0.000050 per Euro increment = $6.25
Margin requirement: ~$2,700 per contract
Margin requirements vary depending on market volatility and broker policies, but traders should always verify the latest figures directly with CME or their brokerage platform before entering positions.
Micro EUR/USD Futures (M6E)
For traders seeking smaller position sizing, CME also offers Micro Euro FX futures.
Key specifications include:
Minimum tick: 0.0001 per euro = $1.25
Margin requirement: ~$270 per contract
Because the Micro contract is one-tenth the size of the standard contract, it allows traders to scale positions more precisely and adjust their exposure more gradually.
This flexibility can be particularly useful when implementing structured risk management strategies.
The Critical Role of Risk Management
No matter how compelling a setup may appear, uncertainty is always present in financial markets. Even when technical support aligns with momentum exhaustion and order-flow signals, outcomes are never guaranteed.
Because of this, experienced traders typically focus less on predicting market direction and more on structuring trades in a way that defines risk clearly from the start.
In the example discussed here, the framework relies on three key principles:
Entering the market near a well-defined support level
Identifying a logical resistance area as a potential exit target
Placing a protective stop below support
This structure allows the trade to be evaluated objectively before it even begins. If the market moves in the expected direction, the resistance zone may become an area where profits are realized. If price instead continues lower and breaks support, the predefined stop helps limit potential losses.
Another important consideration is position sizing. Traders often determine their position size based on the distance between the entry and the protective stop, ensuring that no single trade exposes too much capital.
By combining position sizing, predefined stops, and a consistent reward-to-risk framework, traders can maintain discipline even when markets behave unpredictably.
Data Consideration
When charting futures, the data provided could be delayed. Traders working with the ticker symbols discussed in this idea may prefer to use CME Group real-time data plan on TradingView: www.tradingview.com - This consideration is particularly important for shorter-term traders, whereas it may be less critical for those focused on longer-term trading strategies.
General Disclaimer
The trade ideas presented herein are solely for illustrative purposes forming a part of a case study intended to demonstrate key principles in risk management within the context of the specific market scenarios discussed. These ideas are not to be interpreted as investment recommendations or financial advice. They do not endorse or promote any specific trading strategies, financial products, or services. The information provided is based on data believed to be reliable; however, its accuracy or completeness cannot be guaranteed. Trading in financial markets involves risks, including the potential loss of principal. Each individual should conduct their own research and consult with professional financial advisors before making any investment decisions. The author or publisher of this content bears no responsibility for any actions taken based on the information provided or for any resultant financial or other losses.  Education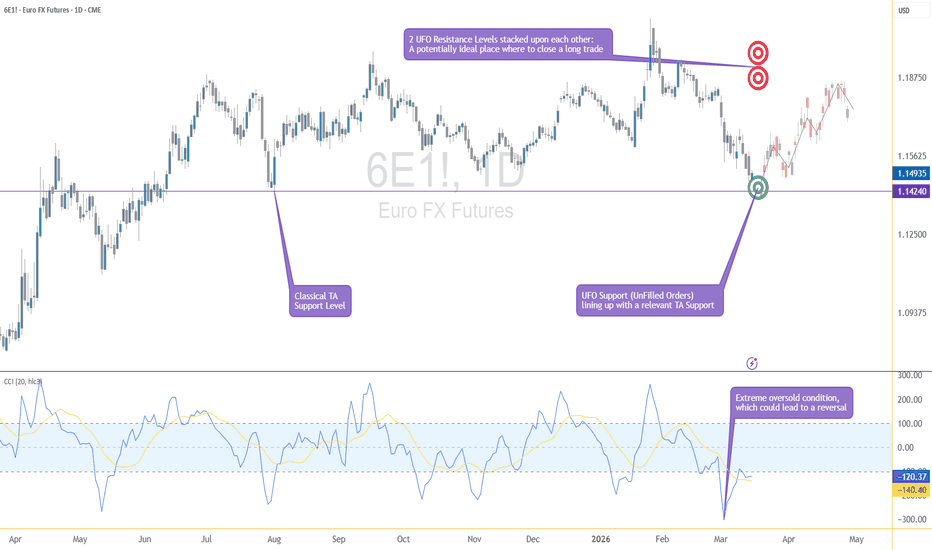
 Long
Long


 Education

 Long
Long
Leap Ahead with a Bearish Divergence on Gold FuturesThe Leap Trading Competition: A Chance to Trade Gold Futures
TradingView’s "The Leap" Trading Competition is an opportunity for traders to test their futures trading skills. Participants can trade select CME Group futures contracts, including Gold Futures (GC) and Micro Gold Futures (MGC).
Register and participate here: TradingView Competition Registration .
This article presents a structured short trade setup based on a bearish divergence identified using the Commodity Channel Index (CCI) and key pivot point levels for confirmation. The trade plan focuses on waiting for price to break below the pivot point at 2866.8 before executing the trade, with clear targets and risk management.
Identifying the Trade Setup
Bearish divergence occurs when price makes higher highs while an indicator, such as CCI, makes lower highs. This signals weakening momentum and a potential reversal. The Commodity Channel Index (CCI) measures price deviations from its average and helps traders identify overbought or oversold conditions.
Pivot points are calculated from previous price action and serve as key support and resistance levels. The pivot at 2866.8 is the reference level in this setup. A breakdown below this level may suggest further downside momentum, increasing the probability of a successful short trade.
The trade plan combines CCI divergence with pivot point confirmation. While divergence signals a potential shift, entry is only considered if price trades below 2866.8. This approach reduces false signals and improves trade accuracy. The first target is set at 2823.0, aligning with an intermediate support level (S1), while the final target is near S2 at 2776.2, just above a UFO support zone.
Trade Plan and Risk Management
The short trade is triggered only if price trades below 2866.8. The stop loss is placed above the entry at a level ensuring at least a 3:1 reward-to-risk ratio.
Profit targets are structured to lock in gains progressively:
The first exit is at 2823.0, where partial profits can be taken.
The final exit is near 2776.2, positioned just above a UFO support level.
Stop placement may vary based on the trader’s preferred risk-reward ratio. Position sizing should be adjusted according to account size and market volatility.
Contract Specifications and Margin Requirements
Gold Futures (GC) details:
Full contract specs: GC Contract Specifications – CME Group
Contract size: 100 troy ounces
Tick size: 0.10 per ounce ($10 per tick)
Margin requirements depend on broker conditions and market volatility. Currently around $12,500 per contract.
Micro Gold Futures (MGC) details:
Full contract specs: MGC Contract Specifications – CME Group
Contract size: 10 troy ounces (1/10th of GC)
Tick size: 0.10 per ounce ($1 per tick)
Lower margin requirements provide access to smaller traders. Currently around $1,250 per contract.
Leverage impacts both potential gains and losses. Traders should consider market conditions and margin requirements when adjusting position sizes.
Execution and Market Conditions
Before executing the trade, price must break below 2866.8. Additional confirmation can be sought through volume trends and price action signals.
If price does not break the pivot, the short setup is invalid. If price consolidates, traders should reassess momentum before committing to the trade.
Conclusion
Bearish CCI divergence signals potential market weakness, but confirmation from the pivot breakdown is key before executing a short trade. A structured approach with well-defined targets and risk management increases the probability of success.
For traders in The Leap Trading Competition, this setup highlights the importance of discipline, confirmation, and scaling out of trades to manage risk effectively.
When charting futures, the data provided could be delayed. Traders working with the ticker symbols discussed in this idea may prefer to use CME Group real-time data plan on TradingView: www.tradingview.com - This consideration is particularly important for shorter-term traders, whereas it may be less critical for those focused on longer-term trading strategies.
General Disclaimer:
The trade ideas presented herein are solely for illustrative purposes forming a part of a case study intended to demonstrate key principles in risk management within the context of the specific market scenarios discussed. These ideas are not to be interpreted as investment recommendations or financial advice. They do not endorse or promote any specific trading strategies, financial products, or services. The information provided is based on data believed to be reliable; however, its accuracy or completeness cannot be guaranteed. Trading in financial markets involves risks, including the potential loss of principal. Each individual should conduct their own research and consult with professional financial advisors before making any investment decisions. The author or publisher of this content bears no responsibility for any actions taken based on the information provided or for any resultant financial or other losses.  Education
Options Blueprint Series [Basic]: Corn Futures and PPI InsightsIntroduction to Corn Futures Market Sentiment
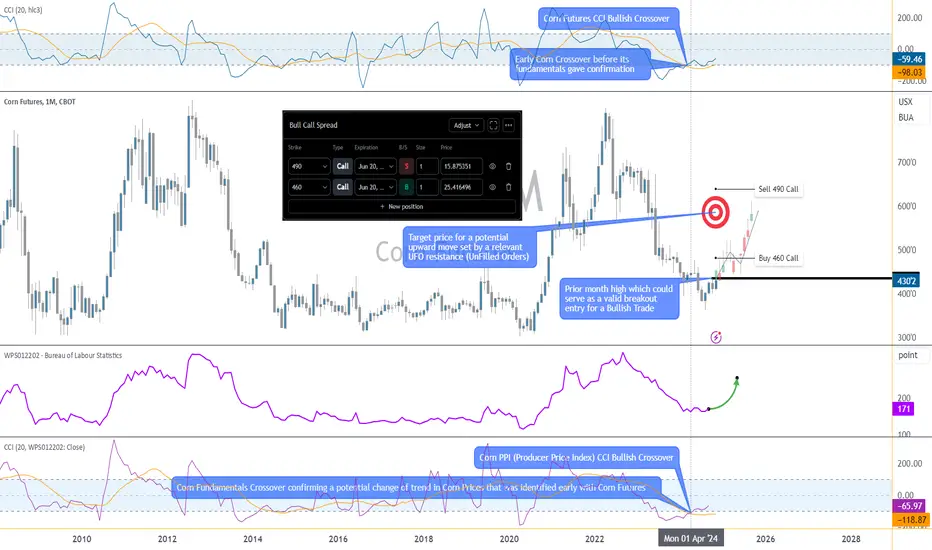
Corn Futures are capturing the interest of traders as technical indicators and economic fundamentals align in a potential bullish setup. Currently, the Corn Producer Price Index (PPI) shows a Commodity Channel Index (CCI) bullish crossover, indicating a possible uptrend in prices. Corn Futures have followed suit with an earlier CCI bullish crossover, adding strength to the view that Corn prices could see upward momentum in the coming months.
As Corn Futures reflect early signals of a shift in market sentiment, this article explores a straightforward yet effective Bull Call Spread strategy using June 2025 options. By leveraging these CCI signals and key resistance levels, traders could position themselves to benefit from a potential rise in Corn prices while maintaining a controlled risk profile.
Corn Futures Contract Specifications and Margin Requirements
Understanding the specifications of Corn Futures is essential for managing both position size and margin requirements effectively. Here’s a quick breakdown:
Price Tick Size: The minimum fluctuation is 0.0025 cents per bushel, equivalent to $12.50 per tick.
Margin Requirement: Approximately $1,000 per contract, although this can vary based on broker and market conditions.
Analysis of Key Indicators and Market Setup
Two primary indicators support the bullish case for Corn Futures: the CCI bullish crossover in both the Corn Futures and the Corn PPI. The CCI, a momentum-based indicator, identifies potential trend reversals by highlighting overbought and oversold conditions. The recent CCI bullish crossover in Corn Futures suggests early buying pressure, while the subsequent crossover in the Corn PPI confirms this trend on the economic front.
This alignment between technical and economic indicators provides a potentially unique opportunity for options traders to capture potential upward movement, particularly as Corn prices approach critical resistance levels in front of a potential breakout.
Identifying Key Resistance Levels for Corn Futures
Resistance levels play a crucial role in setting realistic targets and managing expectations. In the current Corn Futures landscape, the primary resistance level for the front contract is observed around 550. For our target contract, ZCN2025 (July 2025), this resistance translates to approximately 485 due to the effects of contango/backwardation.
These resistance levels serve as benchmarks for setting exit targets in a Bull Call Spread. If Corn prices rally towards this zone, it could provide a favorable exit opportunity while maintaining a controlled risk-to-reward structure.
The Bull Call Spread Strategy Setup
In this setup, we employ a Bull Call Spread using options with a June 20, 2025, expiration date. This strategy is ideal for capturing moderate upside movement while limiting downside risk through a capped loss. Here’s the specific setup:
Long Position: Buy the 460 Call for a premium of 25.41.
Short Position: Sell the 490 Call for a premium of 15.87.
By buying the 460 Call and simultaneously selling the 490 Call, we establish a Bull Call Spread that allows us to benefit from price increases up to the 490 strike level. This setup reduces the net cost of the trade while capping the profit potential at the 490 strike price, aligning with our outlook based on resistance levels.
Net Premium (Cost): 25.41−15.87=9.54.
Reward-to-Risk Analysis
A Bull Call Spread provides a straightforward way to define both maximum profit and loss at the outset. Here’s a closer look:
Maximum Profit: Achieved if Corn Futures price rises to or above the 490 strike level at expiration = (490−460)−9.54=20.46.
Maximum Loss: Limited to the net premium paid = 9.54.
Breakeven Point: 469.54, calculated by adding the net premium to the 460 strike.
This structure results in a reward-to-risk ratio of approximately 2.14:1.
Forward-Looking Trade Plan and Execution Strategy
This Bull Call Spread strategy is structured with specific entry and exit conditions in mind:
Entry Condition: Triggered once the ZC1! (continuous Corn Futures contract) surpasses the prior month’s high at 434'2. This confirmation aligns the technical breakout with the ongoing bullish trend indicated by the CCI and PPI crossovers.
Target Exit: Based on the resistance level, the target for this trade is 485 on the ZCN2025 contract. Reaching this level would allow for a strategic exit with a maximum profit potential.
Alternative Exit: If Corn Futures prices fail to sustain the breakout or if technical indicators weaken significantly, an early exit can be considered to limit losses or preserve gains.
By setting these clear parameters, the trade plan maintains discipline, helping traders avoid reactive decision-making and align with the predefined strategy.
Risk Management Essentials
Effective risk management is crucial, especially when trading options. Here are some best practices:
Stop-Loss Strategy: For options traders, a stop-loss can be set based on a percentage of the premium paid or by monitoring underlying futures price action.
Position Sizing: Limit the size of the position relative to the account balance to avoid overexposure. This is especially relevant for volatile markets like Corn.
Discipline and Emotional Control: Stick to the plan, avoid emotional reactions to market noise, and adhere to entry and exit conditions.
Risk management ensures that even if the trade does not perform as expected, losses are limited and capital is preserved for future opportunities.
When charting futures, the data provided could be delayed. Traders working with the ticker symbols discussed in this idea may prefer to use CME Group real-time data plan on TradingView: www.tradingview.com - This consideration is particularly important for shorter-term traders, whereas it may be less critical for those focused on longer-term trading strategies. Also, some of the calculations and analytics used in this article have been derived using the QuikStrike® tool available on the CME Group website.
General Disclaimer:
The trade ideas presented herein are solely for illustrative purposes forming a part of a case study intended to demonstrate key principles in risk management within the context of the specific market scenarios discussed. These ideas are not to be interpreted as investment recommendations or financial advice. They do not endorse or promote any specific trading strategies, financial products, or services. The information provided is based on data believed to be reliable; however, its accuracy or completeness cannot be guaranteed. Trading in financial markets involves risks, including the potential loss of principal. Each individual should conduct their own research and consult with professional financial advisors before making any investment decisions. The author or publisher of this content bears no responsibility for any actions taken based on the information provided or for any resultant financial or other losses.  Education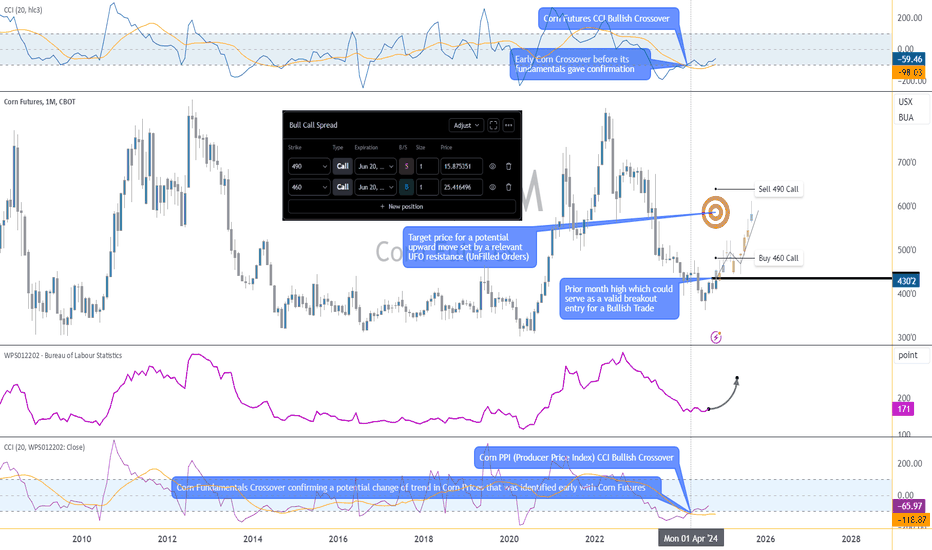
Decoding Money Flow within Markets to Anticipate Price DirectionI. Introduction
In the intricate world of financial markets, understanding the flow of capital between different assets is paramount for traders and investors aiming to anticipate price movements. Money doesn't move haphazardly; it often follows patterns and trends influenced by a myriad of factors, including economic indicators, geopolitical events, and inter-market relationships.
This article delves into the concept of money flow between markets, specifically analyzing how volume movements in one market can influence price directions in another. Our focus centers on two pivotal markets: the 10-Year T-Note Futures (ZN1!) and the Light Crude Oil Futures (CL1!). Additionally, we'll touch upon other significant markets such as ES1! (E-mini S&P 500 Futures), GC1! (Gold Futures), 6E1! (Euro FX Futures), BTC1! (Bitcoin Futures), and ZC1! (Corn Futures) to provide a comprehensive view.
By employing the Granger Causality test—a statistical method used to determine if one time series can predict another—we aim to unravel the nuanced relationships between these markets. Through this exploration, we aspire to equip readers with insights and methodologies that can enhance their trading strategies, particularly in anticipating price directions based on volume dynamics.
II. Understanding Granger Causality
Granger Causality is a powerful statistical tool used to determine whether one time series can predict another. While it doesn't establish a direct cause-and-effect relationship in the strictest sense, it helps identify if past values of one variable contain information that can predict future values of another. In the context of financial markets, this can be invaluable for traders seeking to understand how movements in one market might influence another.
Pros and Cons:
Predictive Power: It provides a systematic way to determine if one market’s past behavior can forecast another’s, helping traders anticipate potential market movements.
Quantitative Analysis: Offers a statistical basis for analyzing market relationships, reducing reliance on subjective judgment.
Lag Dependency: The test is dependent on the chosen lag length, which may not capture all relevant dynamics between the series.
Not True Causality: Granger Causality only suggests a predictive relationship, not a true cause-and-effect mechanism.
III. Understanding Money Flow via Granger Causality
The data used for this analysis consists of daily volume figures for each of the seven markets described above, spanning from January 1, 2018, to the present. While the below heatmap presents results for different lags, we will focus on a lag of 2 days as we aim to capture the short-term predictive relationships that exist between these markets.
Key Findings
The results of the Granger Causality test are presented in the form of a heatmap. This visual representation provides a clear, at-a-glance understanding of which markets have predictive power over others.
Each cell in the matrix represents the p-value of the Granger Causality test between a "Cause" market (row) and an "Effect" market (column). Lower p-values (darker cell) indicate a stronger statistical relationship, suggesting that the volume in the "Cause" market can predict movements in the "Effect" market.
Key Observations related to ZN1! (10-Year T-Note Futures):
The heatmap shows significant Granger-causal relationships between ZN1! volume and the volumes of several other markets, particularly CL1! (Light Crude Oil Futures), where the p-value is 0, indicating a very strong predictive relationship.
This suggests that an increase in volume in ZN1! can reliably predict subsequent volume changes in CL1!, which aligns with our goal of identifying capital flow from ZN1! to CL1! In this case.
IV. Trading Methodology
With the insights gained from the Granger Causality test, we can develop a trading methodology to anticipate price movements in CL1! based on volume patterns observed in ZN1!.
Further Volume Analysis with CCI and VWAP
1. Commodity Channel Index (CCI): CCI is a versatile technical indicator that when applied to volume, measures the volume deviation from its average over a specific period. In this methodology, we use the CCI to identify when ZN1! is experiencing excess volume.
Identifying Excess Volume:
The CCI value for ZN1! above +100 suggests there is an excess of buying volume.
Conversely, when CL1!’s CCI is below +100 while ZN1! is above +100, it implies that the volume from ZN1! has not yet transferred to CL1!, potentially signaling an upcoming volume influx into CL1!.
2. Volume Weighted Average Price (VWAP): The VWAP represents the average price a security has traded at throughout the day, based on both volume and price.
Predicting Price Direction:
If Today’s VWAP is Above Yesterday’s VWAP: This scenario indicates that the market's average trading price is increasing, suggesting bullish sentiment. In this case, if ZN1! shows excess volume (CCI above +100), we would expect CL1! to make a higher high tomorrow.
If Today’s VWAP is Below Yesterday’s VWAP: This scenario suggests bearish sentiment, with the average trading price declining.
Here, if ZN1! shows excess volume, we would expect CL1! to make a lower low tomorrow.
Application of the Methodology:
Step 1: Identify Excess Volume in ZN1!: Using the CCI, determine if ZN1! is above +100.
Step 2: Assess CL1! Volume: Check if CL1! is below +100 on the CCI.
Step 3: Use VWAP to Confirm Direction: Compare today’s VWAP to yesterday’s. If it’s higher, prepare for a higher high in CL1!; if it’s lower, prepare for a lower low.
This methodology combines statistical insights from the Granger Causality test with technical indicators to create a structured approach to trading.
V. Case Studies: Identifying Excess Volume and Anticipating Price Direction
Case Study 1: May 23, 2024
Scenario:
ZN1! exhibited a CCI value of +265.11
CL1!: CCI was at +12.84.
VWAP: Below the prior day’s VWAP.
Outcome:
A lower low was made.
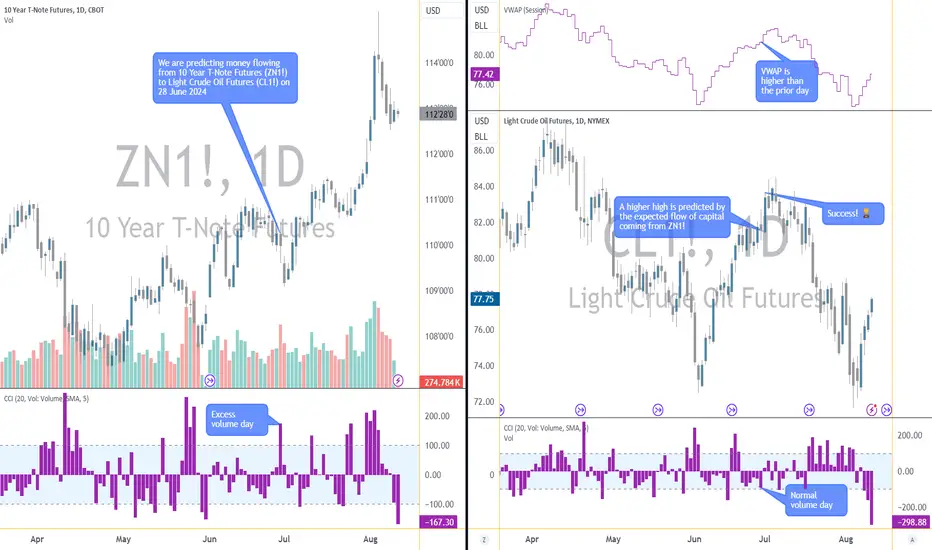
Case Study 2: June 28, 2024
Charts for this case study are at the top of the article.
Scenario:
ZN1! exhibited a CCI value of +175.12
CL1!: CCI was at -90.23.
VWAP: Above the prior day’s VWAP.
Outcome:
A higher high was made.
Case Study 3: July 11, 2024
Scenario:
ZN1! exhibited a CCI value of +133.39
CL1!: CCI was at +0.23.
VWAP: Above the prior day’s VWAP.
Outcome:
A higher high was made.
These case studies underscore the practical application of the trading methodology in real market scenarios.
VI. Conclusion
The exploration of money flow between markets provides valuable insights into how capital shifts can influence price movements across different asset classes.
The trading methodology developed around this relationship, utilizing the Commodity Channel Index (CCI) to measure excess volume and the Volume Weighted Average Price (VWAP) to confirm price direction, offers a systematic approach to capitalizing on these inter-market dynamics. Through the case studies, we demonstrated the practical application of this methodology, showing how traders can anticipate higher highs or lower lows in CL1! based on volume conditions observed in ZN1!.
Key Takeaways:
Granger Causality: This test is an effective tool for uncovering predictive relationships between markets, allowing traders to identify where capital might flow next.
CCI and VWAP: These indicators, when used together, provide a robust framework for interpreting volume data and predicting subsequent price movements.
Limitations and Considerations:
While Granger Causality can reveal important inter-market relationships, it is not without its limitations. The test's accuracy depends on the chosen lag lengths and the stationarity of the data. Additionally, the CCI and VWAP indicators, while powerful, are not infallible and should be used in conjunction with other analysis tools.
Traders should remain mindful of the broader market context, including economic events and geopolitical factors, which can influence market behavior in ways that statistical models may not fully capture. Additionally, effective risk management practices are crucial, as they help mitigate potential losses that may arise from unexpected market movements or the limitations of any predictive models.
When charting futures, the data provided could be delayed. Traders working with the ticker symbols discussed in this idea may prefer to use CME Group real-time data plan on TradingView: www.tradingview.com This consideration is particularly important for shorter-term traders, whereas it may be less critical for those focused on longer-term trading strategies.
General Disclaimer:
The trade ideas presented herein are solely for illustrative purposes forming a part of a case study intended to demonstrate key principles in risk management within the context of the specific market scenarios discussed. These ideas are not to be interpreted as investment recommendations or financial advice. They do not endorse or promote any specific trading strategies, financial products, or services. The information provided is based on data believed to be reliable; however, its accuracy or completeness cannot be guaranteed. Trading in financial markets involves risks, including the potential loss of principal. Each individual should conduct their own research and consult with professional financial advisors before making any investment decisions. The author or publisher of this content bears no responsibility for any actions taken based on the information provided or for any resultant financial or other losses.  Education
Finding a section to start tradingHello, traders.
If you "Follow", you can always get new information quickly.
Please also click "Boost".
Have a nice day today.
-------------------------------------
The BW indicator included in the TS - BW indicator is an indicator expressed by synthesizing the MACD, StochRSI, CCI, PVT, and superTrend indicators.
When the BW indicator
- records a high point, it is time to sell, and
- When it records a low point, it is time to buy.
The BW indicator in the price candle section is the same as the BW indicator included in the TS - BW indicator, but it is an indicator that is expressed in the price candle when a horizontal line is formed at the highest or lowest point.
If you look at the position of the BW indicator expressed in the price candle section, you can know when to proceed with a trade.
I think you can be confident about starting a trade by referring to the status of the MS-Signal (M-Signal on 1D, 1W, 1M charts) indicator that can confirm the trend.
If you add the HA-Low, HA-High indicators here, you can create a more detailed trading strategy.
Have a good time.
Thank you.
--------------------------------------------------
- Big picture
It is expected that a full-scale uptrend will start when it rises above 29K.
The section that is expected to be touched in the next bull market is 81K-95K.
#BTCUSD 12M
1st: 44234.54
2nd: 61383.23
3rd: 89126.41
101875.70-106275.10 (overshooting)
4th: 13401.28
151166.97-157451.83 (overshooting)
5th: 178910.15
These are points where resistance is likely to occur in the future.
We need to check if these points can be broken upward.
We need to check the movement when this section is touched because I think a new trend can be created in the overshooting section.
#BTCUSD 1M
If the major uptrend continues until 2025, it is expected to start forming a pull back pattern after rising to around 57014.33.
1st: 43833.05
2nd: 32992.55
-----------------
 Education
Navigating Interest Rates with Micro Yield Futures Pair TradingIntroduction to Yield Futures
In the complex world of financial markets, Treasury Yield Futures offer investors a pathway to be exposed to changes in U.S. treasury yields. Among these instruments, the Micro 10-Year and Micro 2-Year Yield Futures stand out due to their granularity and accessibility. These futures contracts reflect the market's expectations for the yields of U.S. Treasury securities with corresponding maturities.
Micro 10-Year Yield Futures allow traders to express views on the longer end of the yield curve, typically influenced by factors like economic growth expectations and inflation. Conversely, Micro 2-Year Yield Futures are more sensitive to changes in the federal funds rate, making them a ideal for short-term interest rate movements.
Why Pair Trading?
Pair trading is a market-neutral strategy that involves taking offsetting positions in two closely related securities. This approach aims to capitalize on the relative price movements between the two assets, focusing on their correlation and co-integration rather than their individual price paths. In the context of Micro Treasury Yield Futures, pair trading between the 10-Year and 2-Year contracts offers a strategic advantage by exploiting the yield curve dynamics.
By simultaneously going long on Micro 10-Year Yield Futures and short on Micro 2-Year Yield Futures (or vice versa), traders can hedge against general interest rate movements while potentially profiting from changes in the yield spread between these maturities.
Analyzing the Current Market Conditions
Understanding the current market conditions is pivotal for executing a successful pair trading strategy with Micro 10-Year and Micro 2-Year Yield Futures. Currently, the interest rate environment is influenced by a complex interplay of economic recovery signals, inflation expectations, and central bank policies.
Central Bank Policies: The Federal Reserve's stance on interest rates directly affects the yield of U.S. Treasury securities. For instance, a hawkish outlook, suggesting rate hikes, can cause short-term yields to increase rapidly. Long-term yields might also rise but could be tempered by long-term inflation control measures.
Strategic Approach to Pair Trading These Futures
Trade Execution and Monitoring
To effectively implement a pair trading strategy with Micro 10-Year and Micro 2-Year Yield Futures, traders must have a solid plan for identifying entry and exit points, managing the positions, and understanding the mechanics of yield spreads. Here’s a step-by-step approach:
1. Identifying the Trade Setup
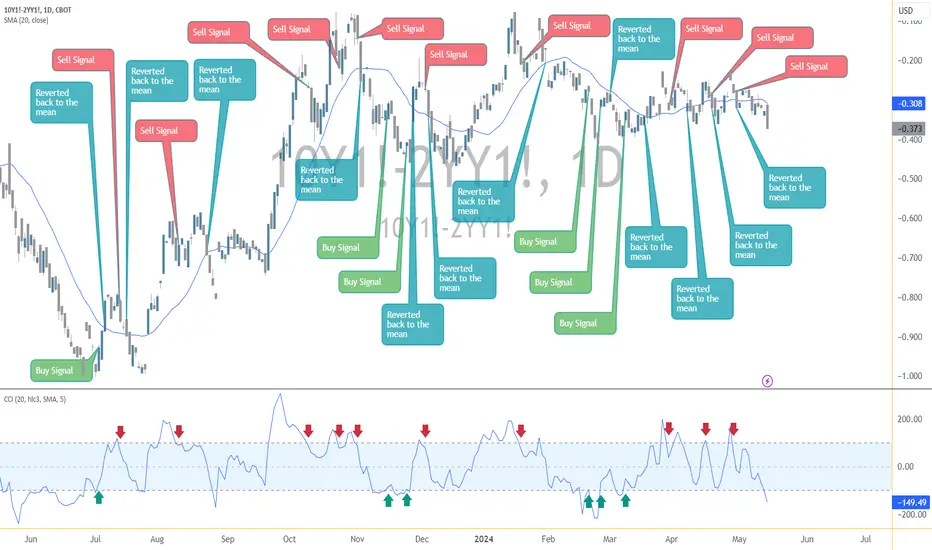
Mean Reversion Concept: In this strategy, we utilize the concept of mean reversion, which suggests that the yield spread will revert to its historical average over time. To quantify the mean, we employ a 20-period Simple Moving Average (SMA) of the spread between the Micro 10-Year and Micro 2-Year Yield Futures. This moving average serves as a benchmark to determine when the spread is significantly deviating from its typical range.
Signal Identification using the Commodity Channel Index (CCI): To further refine our entry and exit signals, the Commodity Channel Index (CCI) is employed. The CCI helps in identifying cyclical turns in the spread. This indicator is particularly useful for determining when the spread has reached a condition that is statistically overbought or oversold.
2. Trade Execution:
Going Long on One and Short on the Other: Depending on your analysis, you might go long on the Micro 10-Year Yield Futures if you anticipate the long-term rates will increase more relative to the short-term rates, or vice versa.
Position Sizing: Determine the size of each position based on the volatility of the yield spreads and your risk tolerance. It's crucial to balance the positions to ensure that the trade remains market-neutral.
Regular Review and adjustments: Regularly review the economic indicators and Fed announcements that could affect interest rates. Keep an eye on the spread for any signs that it might be moving back towards its mean or breaking out in a new trend.
Contract Specifications
To further refine our strategy, understanding the specific contract details of Micro 10-Year and Micro 2-Year Yield Futures is crucial:
Micro 10-Year Yield Futures (Symbol: 10Y1!) and Micro 2-Year Yield Futures (Symbol: 2YY1!):
Tick Value: Each tick (0.001) of movement is worth $1 per contract.
Trading Hours: Sunday to Friday, 6:00 p.m. to 5:00 p.m. (New York time) with a 60-minute break each day beginning at 5:00 p.m.
Initial Margin: Approximately $350 per contract, subject to change based on market volatility.
Pair Margin Efficiency
When trading Micro 10-Year and Micro 2-Year Yield Futures as a pair, traders can leverage margin efficiencies from reduced portfolio risk. These efficiencies lower the required capital and mitigate volatility impacts.
The two charts below illustrate the volatility contrast: the Daily ATR of the yield spread is 0.033, significantly lower than the 0.082 ATR of the Micro 10-Year alone, nearly three times higher. This lower spread volatility underlines a core advantage of pair trading—reduced market exposure and potentially smoother, more predictable returns.
Risk Management in Pair Trading Micro Yield Futures
Effective risk management is the cornerstone of any successful trading strategy, especially in pair trading where the goal is to mitigate market risks through balancing positions. Here are key risk management techniques that should be considered when pair trading Micro 10-Year and Micro 2-Year Yield Futures:
1. Setting Stop-Loss Orders:
Pre-determined Levels: Establish stop-loss levels at the outset of the trade based on historical volatility, maximum acceptable loss, and the distance from your entry point. This helps in limiting potential losses if the market moves unfavorably.
Trailing Stops: Consider using trailing stop-loss orders that move with the market price. This method locks in profits while providing protection against reversal trends.
2. Position Sizing and Leverage Control:
Balanced Exposure: Ensure that the sizes of the long and short positions are balanced to maintain a market-neutral stance. This helps in minimizing the impact of broad market movements on the pair trade.
Leverage Management: Be cautious with the use of leverage. Excessive leverage can amplify losses, especially in volatile market conditions. Always align leverage with your risk tolerance and market assessment.
3. Regular Monitoring and Adjustments:
Adaptation to Market Changes: Be flexible to adjust or close the positions based on significant changes in market conditions or when the initial trading assumptions no longer hold true.
4. Utilizing Risk Management Tools:
Risk Management Software: Set alerts on TradingView to help track the performance and risk level of your pair trades effectively.
Backtesting: Regularly backtest the strategy against historical data to ensure it remains effective under various market conditions. This can also help refine the entry and exit criteria to better handle market volatility.
Effective risk management not only preserves capital but also enhances the potential for profitability by maintaining disciplined trading practices. These strategies ensure that traders can sustain their operations and capitalize on opportunities without facing disproportionate risks.
Conclusion
Pair trading Micro 10-Year and Micro 2-Year Yield Futures offers traders a sophisticated strategy to exploit inefficiencies within the yield curve while mitigating exposure to broader market movements. This approach leverages the distinct characteristics of these two futures contracts, aiming to profit from the relative movements between long-term and short-term interest rates.
Key Takeaways:
Market Neutral Strategy: Pair trading is fundamentally a market-neutral strategy that focuses on the relative performance of two assets rather than their individual price movements. This can provide insulation against market volatility and reduce directional risk.
Importance of Strategy and Discipline: Successful pair trading requires a disciplined approach to strategy implementation, from trade setup and execution to ongoing management and exit. Adhering to a predefined strategy helps maintain focus and objectivity in trading decisions.
Dynamic Market Adaptation: The financial markets are continuously evolving, influenced by economic data, policy changes, and global events. A successful pair trader must remain adaptable, continuously analyzing market conditions and adjusting strategies as needed to align with the current economic landscape.
Comprehensive Risk Management: Effective risk management is crucial in pair trading, involving careful consideration of position sizing, stop-loss settings, and regular strategy reviews. This ensures sustainability and longevity in trading by protecting against undue losses.
By maintaining a disciplined approach and adapting to market changes, traders can harness the potential of Micro Treasury Yield Futures for strategic pair trading, balancing risk and reward effectively.
When charting futures, the data provided could be delayed. Traders working with the ticker symbols discussed in this idea may prefer to use CME Group real-time data plan on TradingView: www.tradingview.com This consideration is particularly important for shorter-term traders, whereas it may be less critical for those focused on longer-term trading strategies.
General Disclaimer:
The trade ideas presented herein are solely for illustrative purposes forming a part of a case study intended to demonstrate key principles in risk management within the context of the specific market scenarios discussed. These ideas are not to be interpreted as investment recommendations or financial advice. They do not endorse or promote any specific trading strategies, financial products, or services. The information provided is based on data believed to be reliable; however, its accuracy or completeness cannot be guaranteed. Trading in financial markets involves risks, including the potential loss of principal. Each individual should conduct their own research and consult with professional financial advisors before making any investment decisions. The author or publisher of this content bears no responsibility for any actions taken based on the information provided or for any resultant financial or other losses.  Education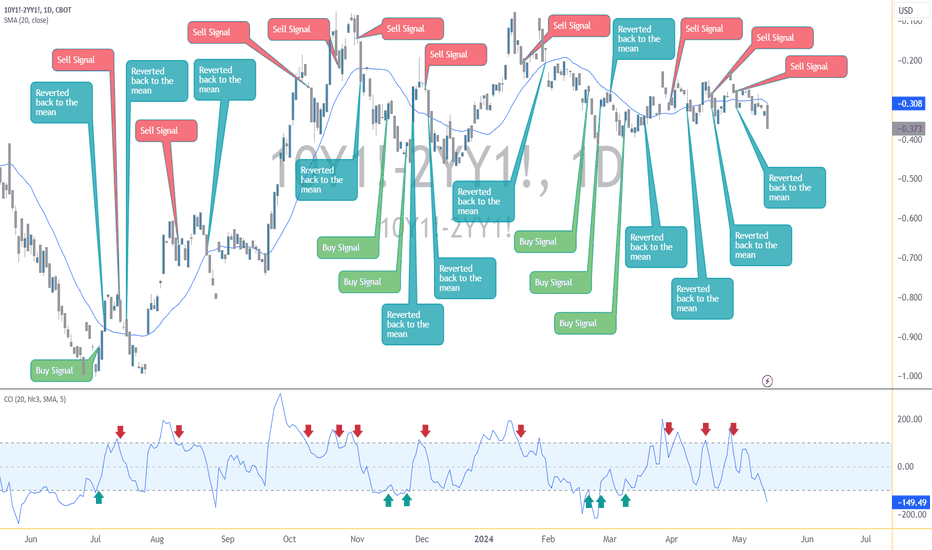
Introducing another way to display volume profile sectionsHello traders!
If you "Follow" us, you can always get new information quickly.
Please also click “Boost”.
Have a good day.
-------------------------------------
The indicators activated in the settings are those created by trading volume.
Therefore, this indicator represents the volume profile section.
The indicator that the arrow points to is the indicator I mentioned earlier.
By looking at this indicator together with volume candles, you can more clearly identify the volume profile section and support and resistance sections.
In addition, you can verify the start of trading by checking the movement of the BW indicator, which consists of five indicators, namely MACD, StochRSI, CCI, PVT, and superTrend indicators.
BW-MACD, BW-StochRSI, BW-CCI, BW-PVT, and BW-superTrend indicators are displayed separately to help you understand the indicators.
Once your trading timing has been selected, you need to create a trading strategy that suits your investment style.
What is important in creating a trading strategy that suits your investment style is the investment period and investment size.
Once the investment period and investment size have been decided, you must create a trading method and profit realization method using the information obtained from chart analysis.
Trading methods include buying, selling, and stop loss methods.
The purchase method should focus on how to lower the average purchase price by purchasing in installments.
At that time, when the price falls below the stop loss point and shows resistance, you need to think about how to proceed with selling.
When taking a stop loss, you must proceed according to the investment period you have set.
For example, if you decide to trade within one wave as a short-term trade and proceed with the trade, but the price falls below the stop loss point, you should be able to sell 100% and then watch the situation.
If the price rises after purchasing, you must proceed with selling according to the selling method.
The selling method must also be carried out according to the investment period.
However, the method of increasing the number of coins (tokens) corresponding to profit by selling the amount equal to the purchase amount can be continued into mid- to long-term trading even if the transaction was done through day trading or short-term trading.
The reason is that the average purchase price of coins (tokens) corresponding to profits is 0.
If you add other indicators to help you conduct split transactions based on price fluctuations, the chart will look like the one above.
If the chart is unfamiliar to your eyes,
It is recommended to view only the HA-Low, HA-High indicators and the M-Signal indicators of the 1D, 1W, and 1M charts.
Have a good time.
thank you
--------------------------------------------------
- The big picture
A full-fledged upward trend is expected to begin when the price rises above 29K.
This is the section expected to be touched in the next bull market, 81K-95K.
#BTCUSD 12M
1st: 44234.54
2nd: 61383.23
3rd: 89126.41
101875.70-106275.10 (when overshooting)
4th: 13401.28
151166.97-157451.83 (when overshooting)
5th: 178910.15
These are points that are likely to encounter resistance in the future.
We need to see if we can break through these points upward.
Since it is thought that a new trend can be created in the overshooting zone, you should check the movement when this zone is touched.
#BTCUSD 1M
If the general upward trend continues until 2025, it is expected to rise to around 57014.33 and then create a pull back pattern.
1st: 43833.05
2nd: 32992.55
-----------------
Education 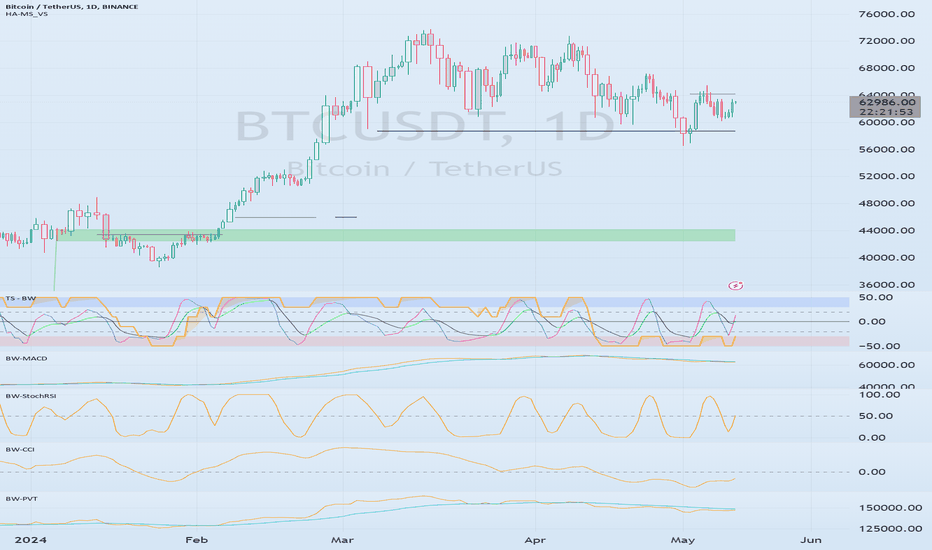
Key Interpretation Methods of CCI IndicatorsHello?
Traders, welcome.
If you "Follow", you can always get new information quickly.
Please also click "Boost".
Have a good day.
-------------------------------------
The CCI indicator, which is included in the 'Strength' indicator, now displays only the oversold or overbought zones.
Accordingly, it seems that there will be difficulties in understanding the indicators, so we took the time to give reinforcement explanations.
The CCI setting I use is 150.
Accordingly, it is utilized to see the flow of the mid-term and above.
The basic source value of CCI is (high + low + close) / 3.
Accordingly, we added the 150 SMA line and the CCI indicator as a secondary indicator.
If it rises a lot from the 150 SMA line, the CCI value rises above +100.
When it rises above +100, it is interpreted as entering the overbought zone.
Entering the overbought zone like this means that there is a possibility that it will exit the overbought zone in the near future.
However, while it is in the overbought zone, it also means that the force to rise is just as strong.
Accordingly, it is the basis for conducting transactions by identifying support and resistance points or sections.
Conversely, if the price drops a lot from the 150 SMA line, the CCI value will fall below -100.
Similarly at this time, when the CCI breaks out of the oversold zone, it enters the sideways zone, providing a basis for trading.
When the CCI is between -100 and +100, prices move sideways.
It is not easy to analyze with only the CCI indicator when it is in the sideways section with the CCI indicator.
Therefore, with the CCI indicator, it is recommended to find the basis for trading when entering and exiting the overbought section (CCI +100) and oversold section (CCI -100).
Since you can check the overbought and oversold sections of the Bollinger bands and CCI shown in this price chart, I think it is a good idea to use it together with the Bollinger bands.
It is quite difficult to create a trading strategy based solely on indicators like these.
Therefore, it is important to create a trading strategy by making sure to set support and resistance points on the price chart and see if the indicators are supported or resisted at those support and resistance points or intervals.
The setting value of Bollinger Bands used in this chart is 60.
-------------------------------------------------- -------------------------------------------
** All descriptions are for reference only and do not guarantee profit or loss in investment.
** Even if you know other people's know-how, it takes a considerable period of time to make it your own.
** This is a chart created with my know-how.
---------------------------------
Education 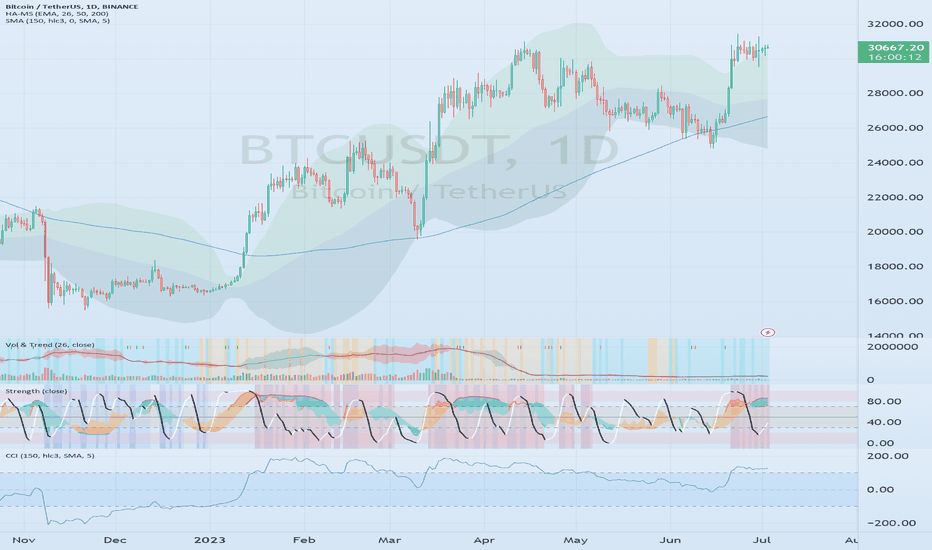
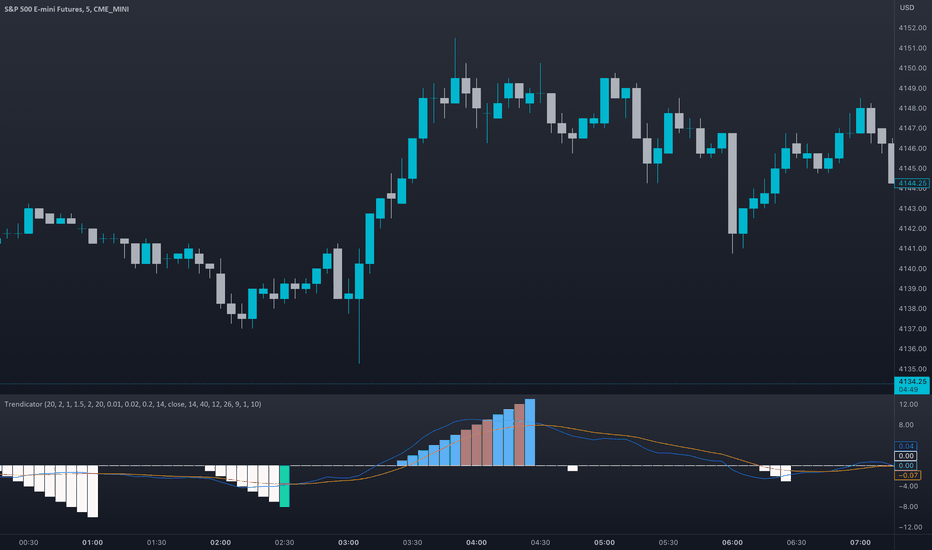
Introducing the Trendicator (by Stock Justice)In this comprehensive tutorial, we dive deep into the world of the Trendicator, a powerful and innovative trading tool made by @StockJustice that enables traders to identify trends, spot reversals, detect bullish and bearish divergences, and perform multi-timeframe analysis. We delve into the inner workings of this never-before-seen indicator, demystifying its complex algorithms and showing you how to harness its full potential. From understanding the unique features of the Trendicator such as its compression stages, divergences, and MACD crossovers, to learning how to pair it with a Displaced Aggregated Moving Average (DACD) for enhanced precision, we cover it all in a fun and engaging manner.
The tutorial is not just about explaining the Trendicator's functionalities, but it also provides practical tips and strategies for using it in real-world trading scenarios. We discuss how the Trendicator can help traders spot the onset of a trend, gauge its strength, and pinpoint potential reversal points. Additionally, we explain how traders can utilize the bullish and bearish divergences identified by the Trendicator to anticipate market turns and make informed trading decisions.
Lastly, we emphasize the importance of multi-timeframe analysis in trading and demonstrate how the Trendicator can facilitate this process. By interpreting the Trendicator's signals across different timeframes, traders can gain a more comprehensive view of the market and make more accurate predictions. This tutorial is a must-watch for any trader aspiring to level up their technical analysis skills and trade more confidently and effectively. So, get ready to embark on an exciting journey of learning and discovery with the Trendicator!  Education
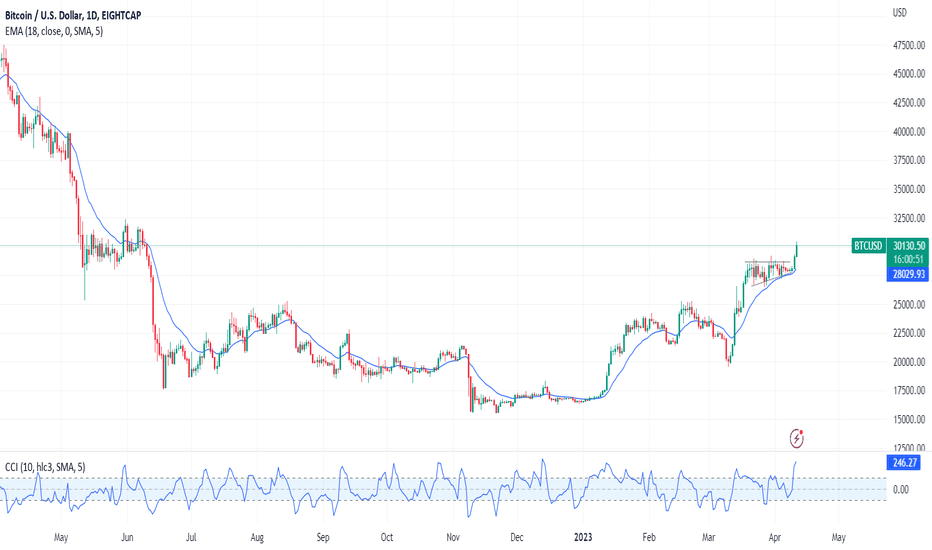
Bitcoin holds breakout and retakes 30KBitcoin is back above 30K in today's session extending yesterday's breakout.
Hard to look past Bitcoin today as buyers hit 30K, a price level not seen since June 2022. The move started yesterday as Bitcoin buyers broke above 28,600 resistance, and the move was held at the close, which is a great sign as it's the first set in confirming the move.
Today buyers jumped back into gear, breaking yesterday's high and moving back into the 30K Handel. In under two days, just over 7% of value has been added to its price.
The breakout looks to have confirmed an ascending triangle pattern, and these are quite common continuation patterns seen in up trends, so it's a good sign to see this as it could suggest that the current uptrend has further to run.
If we do see further upside, we will be looking at 31,800 as a possible level of resistance. If we do see a new reaction lower in the short term, we would like to see the breakout point become support which is a sign of buyer strength.
US CPI is due tomorrow, if we did see a surprise jump to the upside in US inflation, this could impact Bitcoin on the short term, but we hope that it would only be minor as Bitcoin has been running its own race so far this week ignoring yesterdays rally on the USD.
Good trading.
Long
How to interpret charts from indicators (trading strategy)Hello?
Traders, welcome.
If you "Follow", you can always get new information quickly.
Please also click "Boost".
Have a good day.
-------------------------------------
Please understand that the 'Vol & Trend' and 'Strength' sub-indicators are a synthesis of existing indicators, and cannot be disclosed because they have been judged to be unsuitable for publishing as public scripts.
----------------------------------------
It is not easy to see and interpret all the indicators displayed on the chart.
Therefore, it should be viewed and interpreted as the most critical interpretation method.
The first thing to look at is the position of the MS-Signal (M-Signal on the 1D chart), HA-Low, HA-High, M-Signal indicators on the 1W and 1M charts.
The most important of these is the location of the MS-Signal (M-Signal on the 1D chart) indicator and price.
The price is currently located below the MS-Signal indicator, indicating a downtrend.
To add one more thing to this, you can also check the relationship with the M-Signal indicator on the 1W and 1M charts.
Since the price is located below the M-Signal indicator on the 1W chart and 1M chart, it can be interpreted as a downtrend from a mid- to long-term perspective.
Therefore, you can see that the chart as a whole is starting to enter a downtrend.
In order to trade in this situation, you need to check the location of the HA-Low and HA-High indicators.
Currently, the HA-Low indicator is rising and is about to be created.
Therefore, if today's candlestick closes around now, we would expect the HA-Low indicator to form at 21552.44.
Therefore, it becomes important whether it can rise above 21552.44.
Since the M-Signal indicator on the 1W chart is passing around 21552.44, whether it can rise above 21552.44 has become an important question.
If the HA-Low indicator is created at 21552.44 and fails to rise above 21552.44, there is a possibility of renewing the previous low, so you need to think about countermeasures.
If support is received at the 21552.44 point, it is likely to touch the vicinity of the MS-signal (M-Signal on the 1D chart) indicator.
At this time, if you succeed in breaking through the MS-signal (M-Signal on the 1D chart) indicator, the possibility of rising to the vicinity of the HA-High indicator increases.
When the candle is formed today, the body of Heikin Ashi is showing a bullish sign.
Therefore, even if the price fails to rise, if the price remains above the Heikin Ashi body, it can be interpreted that there is a high probability of a rise around 21552.44.
At this time, you need to check whether it is supported or resisted at the point 21552.44.
As such, indicators on price charts represent trends and support and resistance roles, making it the most intuitive way to anticipate future movements.
To support this, 'Vol & Trend' and 'Strength' auxiliary indicators are utilized.
This auxiliary indicator strengthens the interpretation of the price chart indicators by providing additional evidence when the movements of the price chart indicators are judged ambiguous.
The 'Vol & Trend' sub-indicator is an indicator related to trading volume.
Therefore, you can check the buy strength and sell strength according to the movement of trading volume.
You can also check whether the volume is trending up or down.
The 'Strength' sub-indicator consists of the Stoch, StochRSI, RSI and CCI indicators.
The most important of these are the StochRSI indicator and the RSI indicator.
The RSI indicator is an indicator that is related to the HA-Low and HA-High indicators.
Therefore, it is not directly interpretable.
However, it is paired with the Stoch indicator and used as a basis for determining an upward trend or a downward trend.
It is currently looking to switch from a downtrend to an uptrend.
The StochRSI indicator is used to predict periods of volatility.
In addition, it is used as a basis for determining whether the trend will change to an uptrend or a downtrend in the future due to the change in the wave.
The current downtrend has turned to an uptrend, and it appears to be coming out of the oversold zone.
The CCI indicator is used as a basis for judging whether there is an upward trend or a downward trend.
However, it shows a trend that is more than short-term.
All of these indicators are scored as uptrend, stationary, and downtrend to make an overall judgment.
'Vol & Trend' indicator
Stationary : 1
Downtrend: 1
'Strength' indicator
Uptrend: 1
Matching: 2
Downtrend: 1
It is a situation where the basis for judgment of the sub-indicators is not needed, as all indicators that are near the current price chart are located below the price.
If it starts to show stationary or sideways movements near the price chart, then with the help of the indicators, you will be able to use it as a basis for judgment.
Someone said it's a chart with all the indicators, yes, that's right.
However, it is not always possible to see all indicators.
You only need to report it when necessary and use it as a basis for judgment.
We do not think of additional interpretation methods for each indicator other than the interpretation methods described above.
You should pay attention to this.
By combining support and resistance points here, you can create a trading strategy.
No matter how you analyze the chart, analysis ends its role with analysis.
To trade, you need to create a trading strategy based on chart analysis and correlation with support and resistance points so you can start trading.
However, when it comes to most chart analysis, there is a tendency to ignore trading strategies.
If you ignore your trading strategy, you will most likely not be able to find the right way to respond if the movement comes out in the opposite direction you thought.
Therefore, both chart analysis and trading strategy are important, but you need to do chart analysis to create a trading strategy.
If you forget about this and invest all your time and effort into chart analysis, you will end up with a higher chance of failing trades when you run out of time to craft your trading strategy right.
Therefore, chart analysis should be completed in the quickest way to give you plenty of time to create your trading strategy.
To do so, it is urgently necessary to make efforts to predict movements beyond the current one, rather than looking at the charts based on past movements and past patterns.
-----------------------------------------------------------------
** All descriptions are for reference only and do not guarantee profit or loss in investment.
** Even if you know other people's know-how, it takes a considerable period of time to make it your own.
** This is a chart created with my know-how.
---------------------------------
Long 
 Short
Short