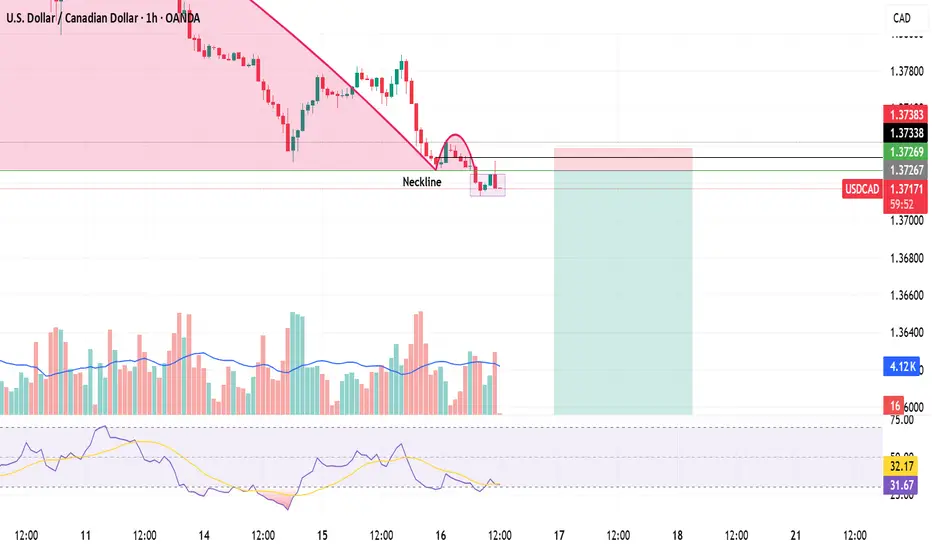
USD/CAD Short Trade IdeaA very clean inverse cup and handle have formed on USD/CAD on higher timeframe of 1H and 4H. The neckline is broken and entry can be taken at the current market price. A liquidity sweep already took place when the hourly candle broke the neckline upwards and closed back under the neckline. This idea is invalidated if price crosses half of the cup.
Entry: CMP
SL: 1.37340
TP: 1.35379
Risk: 0.4%
RR: 1:16
It may take longer to achieve, so you can limit your reward to 1:3 for day trading and 1:10 for swing trades.
Cup And Handle
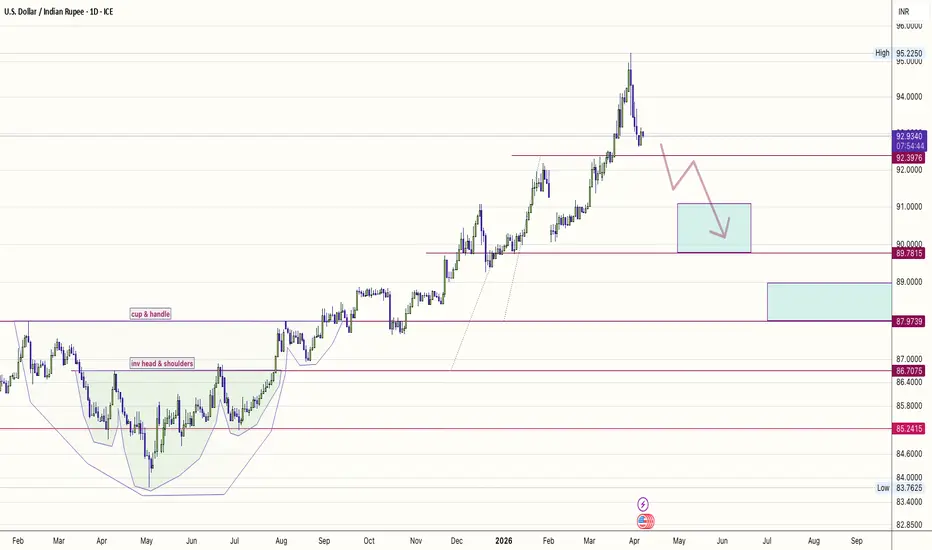
USDINR: The Blow-off Top? Reversal Targets suggest 90.00 ...can be met where it might stall out, before even further Indian rupee strength into the second half of the year.
The Vision
After an aggressive rally fueled by geopolitical tension and oil volatility, USDINR appears to have found a definitive ceiling at the 95.22 mark. The price action is now showing clear signs of exhaustion, breaking below the immediate support of 93.75 and heading toward a potential structural shift. With the RBI intensifying its intervention to curb speculation, the path of least resistance has finally shifted southward.
Technical Breakdown
The chart highlights a projected "descending stair-case" move:
The Rejection: Sharp sell-off from the all-time high (ATH) zone, forming what looks like a broad "Head and Shoulders" or a failed breakout.
Immediate Target (Support 1): ₹91.00 — A high-liquidity zone that previously acted as resistance.
Secondary Target (Support 2): ₹89.78 — The base of the current 2026 bull run.
Final Mean Reversion: ₹87.97 — The long-term value area.
Fundamental Headwinds
RBI Intervention: The central bank has capped net open positions at $100M, effectively squeezing out the dollar bulls.
Bond Yield Surge: Rising Indian yields are making the Rupee more attractive for carry trades, putting downward pressure on the USD/INR pair.
Policy Pivot: All eyes are on tomorrow's (April 8) RBI policy announcement. A hawkish stance could be the final nail for this USD rally.
Possible Trading Plan: a sell-on-rise opportunities near 93.20 - 93.40, with a stop-loss above the recent swing high of 94.50.
What’s your take?
Do you think the RBI can hold it below 93, or will the "Hormuz Deadline" tonight spark one last spike?
#USDINR
#Forex
#TechnicalAnalysis
#PriceAction
#TradingView
#Nifty
#StockMarketIndia
#RBI
#IndianEconomy
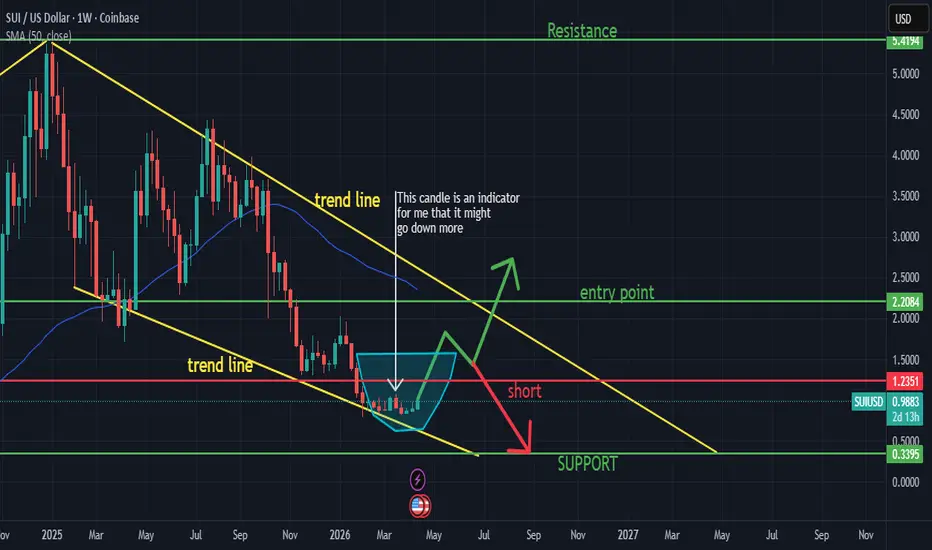
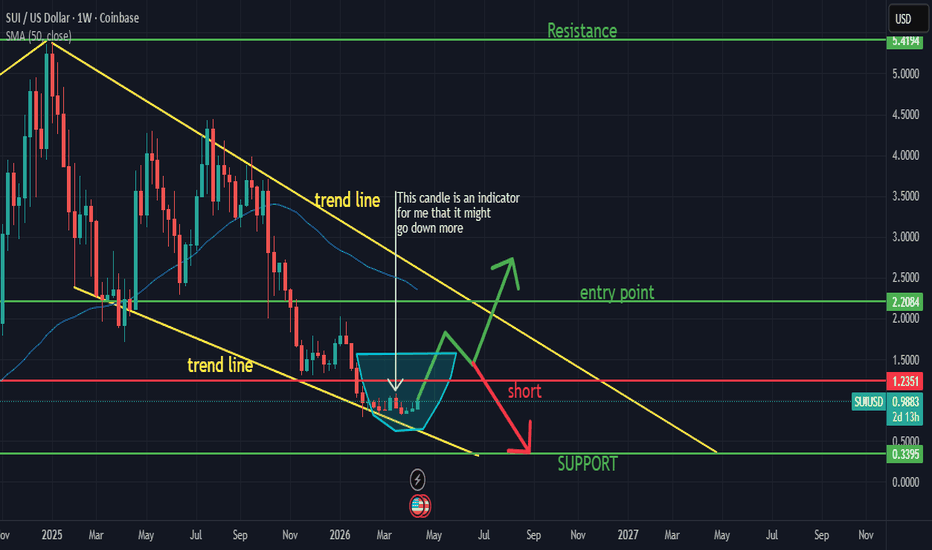
SUI USD PRICE PREDICTION (BEGINNER LEVEL)I am predicting a cup and handle will form over the next few weeks, as you know this is a risky business to get in you either do good or bad. But let's see.
Price will Tap $1.84 before going back down to set up the HANDLE and to close the cup
It will go down to $1.23 to complete the handle at that point it will spike up past $1.84
I price breaks out of the trend line $2.20 will be the entry point to ride the wave upwards obviously if your holding SUI you are in a great position to profit or buy more at these levels or lower.
Overall resistance is $5.50
Overall Support is $0.33
Overall Trend is Downward (Squidward)
we are dangerously close to that support line if we get there, I will definitely be buying more
There is a white arrow I left for a candle stick that doesn't look good to me it could be an indicator to that it will drop further rather than form a cup and handle.
ADANIPOWER - 22 months CUP & HANDLE══════════════════════════════
Since 2014, my markets approach is to spot
trading opportunities based solely on the
development of
CLASSICAL CHART PATTERNS
🤝Let’s learn and grow together 🤝
══════════════════════════════
Hello Traders ✌
After a careful consideration I came to the conclusion that:
- it is crucial to be quick in alerting you with all the opportunities I spot and often I don't post a good pattern because I don't have the opportunity to write down a proper didactical comment;
- since my parameters to identify a Classical Pattern and its scenario are very well defined, many of my comments were and would be redundant;
- the information that I think is important is very simple and can easily be understood just by looking at charts;
For these reasons and hoping to give you a better help, I decided to write comments only when something very specific or interesting shows up, otherwise all the information is shown on the chart.
Thank you all for your support
🔎🔎🔎 ALWAYS REMEMBER
"A pattern IS NOT a Pattern until the breakout is completed. Before that moment it is just a bunch of colorful candlesticks on a chart of your watchlist"
═════════════════════════════
⚠ DISCLAIMER ⚠
The content is The Art Of Charting's personal opinion and it is posted purely for educational purpose and therefore it must not be taken as a direct or indirect investing recommendations or advices. Any action taken upon these information is at your own risk.
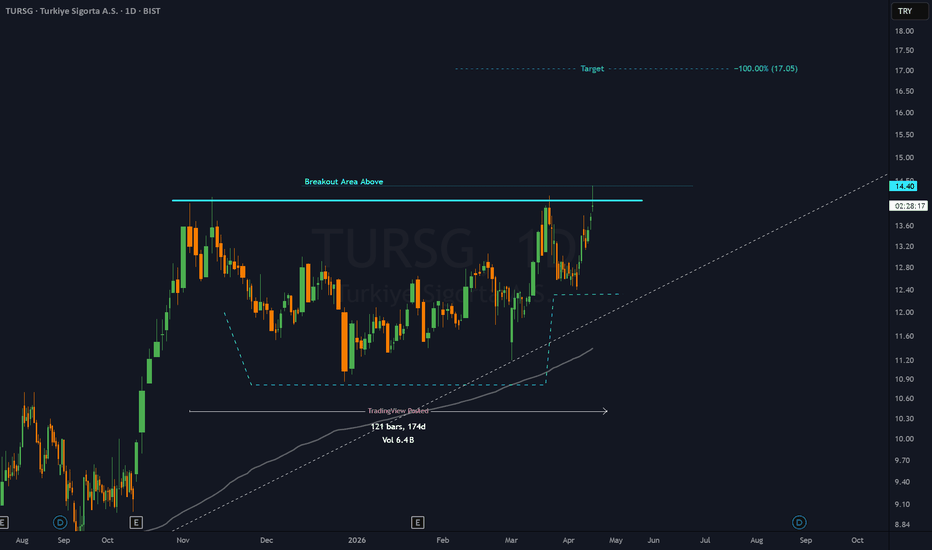
TURSG - 6 months CUP & HANDLE══════════════════════════════
Since 2014, my markets approach is to spot
trading opportunities based solely on the
development of
CLASSICAL CHART PATTERNS
🤝Let’s learn and grow together 🤝
══════════════════════════════
Hello Traders ✌
After a careful consideration I came to the conclusion that:
- it is crucial to be quick in alerting you with all the opportunities I spot and often I don't post a good pattern because I don't have the opportunity to write down a proper didactical comment;
- since my parameters to identify a Classical Pattern and its scenario are very well defined, many of my comments were and would be redundant;
- the information that I think is important is very simple and can easily be understood just by looking at charts;
For these reasons and hoping to give you a better help, I decided to write comments only when something very specific or interesting shows up, otherwise all the information is shown on the chart.
Thank you all for your support
🔎🔎🔎 ALWAYS REMEMBER
"A pattern IS NOT a Pattern until the breakout is completed. Before that moment it is just a bunch of colorful candlesticks on a chart of your watchlist"
═════════════════════════════
⚠ DISCLAIMER ⚠
The content is The Art Of Charting's personal opinion and it is posted purely for educational purpose and therefore it must not be taken as a direct or indirect investing recommendations or advices. Any action taken upon these information is at your own risk.
AUDCHF Cup & Handle Breakout Setup | Bullish ContinuationAUDCHF Cup & Handle Breakout Setup | Bullish Continuation + RSI Confirmation 🚀
Idea:
AUDCHF on the daily timeframe is forming a classic Cup & Handle continuation pattern, signaling potential upside continuation after a period of consolidation.
Price has completed a rounded “cup” structure, showing gradual accumulation. The recent pullback forms the “handle,” which is shallow and controlled — a strong sign of bullish intent rather than distribution.
At the same time, RSI is trending upward, holding above mid-levels and printing higher lows, indicating strengthening momentum and underlying buying pressure.
A breakout above the neckline resistance (~0.5570–0.5600 zone) would confirm the pattern and likely trigger expansion.
What’s happening:
Market transitioned from correction → accumulation → continuation setup
Sellers are losing control (weak pullbacks)
Buyers stepping in earlier on each dip
Structure favors breakout, not rejection
Trade Plan:
Entry: Break & daily close above resistance
Stop Loss: Below handle low
Target: Measured move toward 0.5730+ (projected from cup depth)
Bias: Bullish continuation
Key Levels:
Resistance: 0.5570 – 0.5600
Support: 0.5480 – 0.5500
Dollar Index (DXY): Test of Key Support
Dollar Index is currently approaching a key daily horizontal support.
A cup & handle formation on a 4H time frame suggests a highly
probably bullish movement.
I think that the market may bounce to 98.36 level.
❤️Please, support my work with like, thank you!❤️
I am part of Trade Nation's Influencer program and receive a monthly fee for using their TradingView charts in my analysis.
$CLS just hit new all-time highs. This AI infrastructure stock Celestica just hit new 52-week highs at $392. AI data centre infrastructure play with 44% revenue growth and a 91.7% checklist score.
Here's the full analysis 👇
---
1/ COMPANY SNAPSHOT
Celestica (NYSE: CLS) — Toronto-based tech company providing data centre infrastructure, hardware platform solutions, and advanced manufacturing for hyperscalers like Google and Meta.
Market Cap: ~$44.6B
Sector: Technology / Electronic Components
Next Earnings: April 27, 2026
---
2/ THE EARNINGS STORY IS INSANE
Q4 2025 results:
• Revenue: $3.65B (+44% YoY)
• GAAP EPS: $2.31 (+79% YoY)
• Adj EPS: $1.89 — beat guidance high end by 4.4%
• Earnings surprise: +11.2%
Beat-and-raise for 4 consecutive quarters.
---
3/ ANNUAL EPS TRAJECTORY
2022: $1.46
2023: $2.03 (+39%)
2024: $3.61 (+78%)
2025: $7.16 (+98%)
2026E: $8.75 guided (+45%)
Three straight years of ACCELERATING annual EPS growth. 3-year CAGR of ~70%. This is rare.
---
4/ REVENUE IS ACCELERATING TOO
2023: $7.96B (+10%)
2024: $9.65B (+21%)
2025: $12.39B (+28%)
2026E: $17.0B (+37% guided)
Revenue growth is speeding up, not slowing down. CCS segment (data centre) grew 64% in Q4 alone. HPS (switches/compute) grew 72%.
---
5/ MARGINS & BALANCE SHEET
• Adj operating margin: 7.5% (2025), guided 7.8% (2026) — expanding every year
• ROE: ~40.5% — exceptional
• Debt/Equity: ~41% — conservative
• Free cash flow: $458M in 2025
• $1B capex planned for 2026, fully funded by operations
Only weakness: Pre-tax margin at ~7.9% (EMS industry structural — not a red flag here).
---
6/ WHAT'S DRIVING THE GROWTH
✅ Preferred manufacturing partner for Google TPU systems
✅ 3 hyperscaler wins for 1.6T switching platforms
✅ AMD Helios AI rack-scale platform collaboration
✅ HPS revenue at $1.4B/quarter and growing 72% YoY
✅ $1B capacity expansion across Texas, Thailand, Mexico, Japan
This is a structural AI infrastructure play, not a one-quarter wonder.
---
7/ TECHNICAL PICTURE
• Price: $387.74 — just 1.1% off 52-week high
• 50-day MA: ~$293 (price well above)
• Moving averages stacked bullish: Price > 50 > 150 > 200 SMA
• 200 SMA trending up from ~$100 in mid-2024
• Breakout on April 14 with 3M volume (1.4x average)
Perfect Stage 2 uptrend. 5/5 on the moving average leadership test.
---
8/ INSTITUTIONAL OWNERSHIP
• 67.3% institutional ownership
• Top holders: Fidelity (6.45%), Vanguard (4.19%), JPMorgan (3.49%), Arrowstreet (2.74%), Franklin (1.98%)
• ~810 institutional holders
• Growth-focused funds like Whale Rock Capital and Viking Global are on the cap table
Quality sponsorship. Slight decline in shares held mid-2025, but recent volume suggests re-accumulation.
---
9/ THE CHECKLIST — 91.7% PASS RATE
22 Pass / 2 Fail / 1 N/A out of 25 criteria
Passes: EPS growth, acceleration, estimate revisions, earnings surprise, annual growth, sales growth, ROE, debt, technicals, moving averages, volume, market cap
Fails: Pre-tax margin (structural for EMS), slight fund ownership dip
---
10/ FINAL SCORECARD
Fundamental Checklist: Strong
Current Earnings: Strong
Annual Earnings: Strong
Sales/Margins/ROE/Debt: Strong
Technical Performance: Strong
Supply & Demand: Mixed
Moving Average Leadership: Strong
Qualitative Thesis: Strong
Institutional Sponsorship: Mixed
7 Strong / 2 Mixed / 0 Weak
OVERALL: ★ Elite Growth Candidate ★
---
11/ BULL CASE
• Purest AI data center infrastructure play in the market
• Revenue acceleration from +10% to +37% guided
• Multi-year hyperscaler program wins give 2027+ visibility
• Forward PE ~31x on 45%+ EPS growth — not expensive for the growth
• $1B capex funded entirely by cash flow = financial strength
---
12/ BEAR CASE
• 3 customers = 63% of revenue — extreme concentration
• Stock is +398% off 52-week low — extended
• Pre-tax margins structurally lower than software peers
• AI capex cycle could pause if hyperscalers pull back
• Insider selling (mostly comp-related but still notable)
---
13/ WHAT TO WATCH
📅 Q1 2026 Earnings: April 27 — THE catalyst. Guidance: $3.85-4.15B rev, $1.95-2.15 adj EPS
📊 Estimate revisions: Will analysts move above $8.75 for 2026?
🏦 May 13F filings: Did institutions buy the breakout?
📈 Breakout level: $392 (new highs) / Support: $310 and 50-day MA at ~$293
📐 Margin watch: Any guidance above 8.0% adj operating margin = structural shift
---
14/ BOTTOM LINE
Celestica has transformed from a traditional contract manufacturer into a high-growth AI infrastructure company. 91.7% checklist score. Accelerating revenue and earnings. Multi-year hyperscaler visibility. Breaking to new highs on volume.
It's an Elite Growth Candidate. The April 27 earnings report is the next make-or-break moment.
---
⚠️ Not financial advice. All data from public filings and third-party sources. Some institutional data may be delayed. Do your own due diligence.
NYSE:CLS #Celestica #AI #GrowthStocks #DataCenter #Earnings
Nebius: Potential BreakoutNebius consolidated for months, but some traders may think the datacenter stock is breaking out.
The first pattern on today’s chart is the long basing pattern between November and late March. (It could also be viewed as a cup and handle following the rally between March and October.)
Second, prices remained above the rising 200-day simple moving average. That could reflect a bullish long-term trend.
Next, $130.82 was the previous record weekly closing high on October 31. NBIS closed above that level on Friday, which could be consistent with a long-term breakout.
Finally, the 21-day rate of change (ROC) has started to rise but is below earlier readings. The average directional index (ADX) is also well below previous levels. Both of those signals may suggest prices have room to accelerate within the context of a new uptrend.
TradeStation has, for decades, advanced the trading industry, providing access to stocks, options and futures. If you're born to trade, we could be for you. Learn more here about TradingView’s Broker of the Year!
Past performance, whether actual or indicated by historical tests of strategies, is no guarantee of future performance or success. There is a possibility that you may sustain a loss equal to or greater than your entire investment regardless of which asset class you trade (equities, options or futures); therefore, you should not invest or risk money that you cannot afford to lose. Online trading is not suitable for all investors. View the document titled Characteristics and Risks of Standardized Options at www.TradeStation.com . Before trading any asset class, customers must read the relevant risk disclosure statements on www.TradeStation.com . System access and trade placement and execution may be delayed or fail due to market volatility and volume, quote delays, system and software errors, Internet traffic, outages and other factors.
Securities and futures trading is offered to self-directed customers by TradeStation Securities, Inc., a broker-dealer registered with the Securities and Exchange Commission and a futures commission merchant licensed with the Commodity Futures Trading Commission). TradeStation Securities is a member of the Financial Industry Regulatory Authority, the National Futures Association, and a number of exchanges.
TradeStation Securities, Inc. and TradeStation Technologies, Inc. are each wholly owned subsidiaries of TradeStation Group, Inc., both operating, and providing products and services, under the TradeStation brand and trademark. When applying for, or purchasing, accounts, subscriptions, products and services, it is important that you know which company you will be dealing with. Visit www.TradeStation.com for further important information explaining what this means.
Anthem Biosciences Ltd – Cup & Handle BreakoutChart Analysis
Anthem Biosciences is forming a classic Cup & Handle pattern, indicating a potential trend reversal → bullish continuation.
Rounded bottom (Cup) shows accumulation phase
Smaller pullback (Handle) shows weak profit booking
Price is now breaking out of a strong demand zone (₹680–₹710)
This structure signals bullish momentum building up.
Key Levels
Demand Zone: ₹680 – ₹710
Breakout Level: ₹720 (closing basis)
Current Price: ~₹720
Target: ₹750 – ₹770
Stop Loss: ₹670
Trade Setup
Strategy: Breakout + Continuation
✅ Entry: Above ₹720
🎯 Target: ₹750 / ₹770
🛑 SL: ₹670
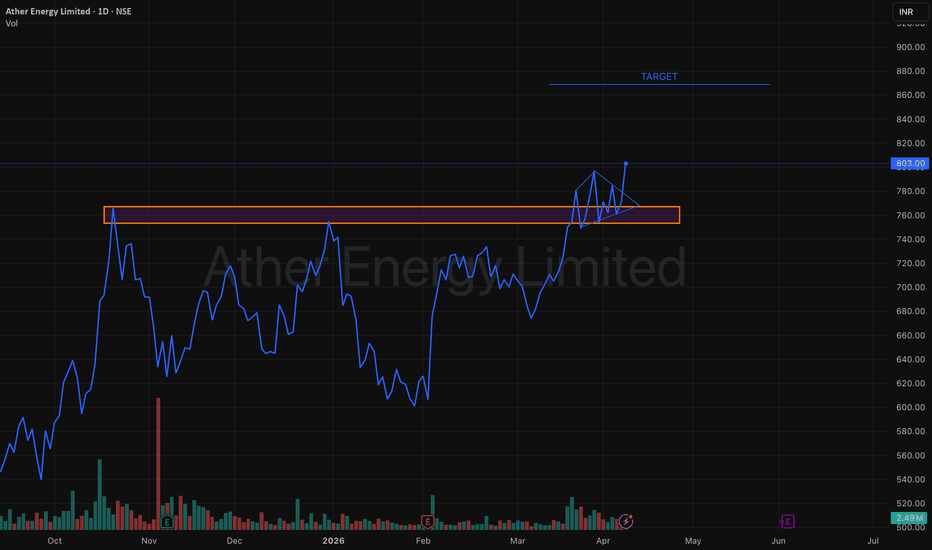
Ather Energy Ltd – Breakout from Strong Resistance Zone Chart Analysis
Ather Energy has been consolidating near a major resistance zone (₹750–₹770) which has acted as a supply area multiple times in the past.
Now, price is showing:
Ascending triangle formation (higher lows)
Constant testing of resistance
Signs of accumulation + bullish pressure
This indicates buyers are gaining strength.
Key Levels
Resistance Zone: ₹750 – ₹770
Breakout Level: ₹780 (closing basis)
Current Price: ~₹800
Target: ₹860 – ₹880
Stop Loss: ₹740 (below structure)
Trade Setup
Strategy: Breakout + Retest (Aggressive traders can enter on breakout)
✅ Entry: Above ₹780 (or on retest of ₹760–₹770 zone)
🎯 Target: ₹860+
🛑 SL: ₹740
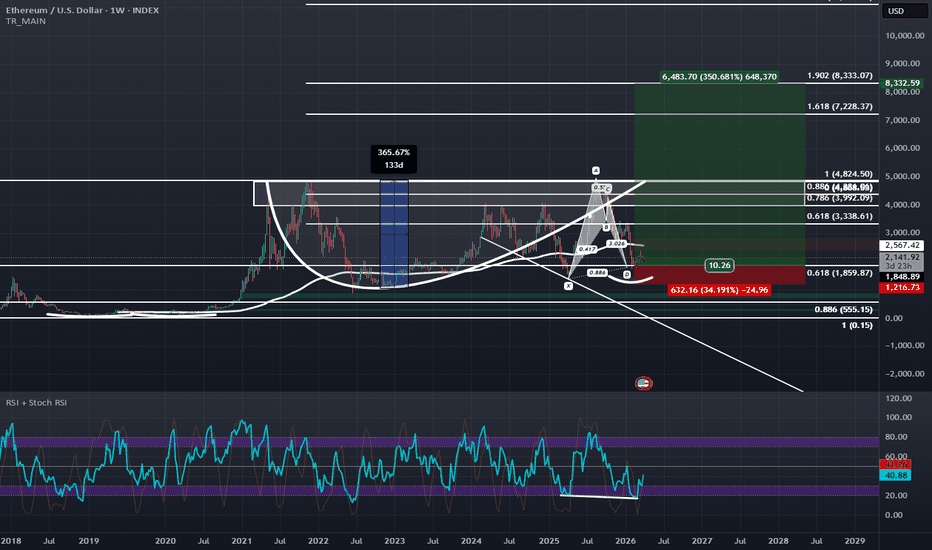
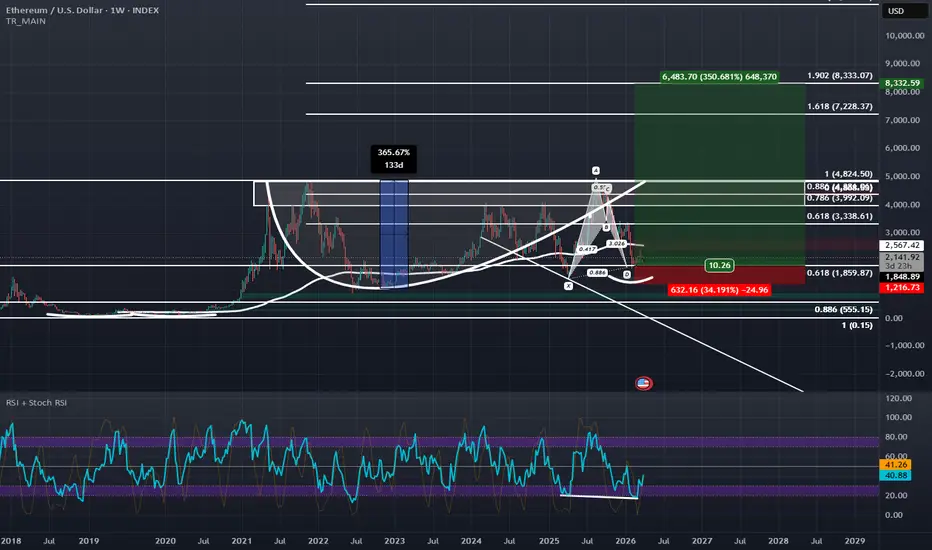
The Bullish Setup on ETH Has More Potential Than Once ThoughtFollowing up on this initial Bullish idea on the 4 Hour:
and this Bullish idea on the daily:
It would seem that ETH also has a big bullish setup on the weekly as seen in the current chart. We are at the all-time 0.618 Retrace and at this retrace we are making a local 0.886 and completing a Bullish Bat visible on the Weekly with Hidden Bullish Divergence on the RSI. If ETH really starts to bounce here at this heavy level of confluence it would be confirming a Partial-Decline of a Right-angled and Descending Broadening Formation, (a pattern of which that seems to be serving a secondary purpose of being the potential handle of a bigger Cup with Handle Pattern). If this starts to trade back towards 5000, chances of a Breakout are increased due to the partial decline, and the measured move of the Cup with handle and the Right-angled and Descending Broadening Formation both would take ETH to the 1.618-1.902 Fibonacci extension zones between $7,000, and $8,500.
It's also worth noting that ETHBTC on higher timeframes has also completed a Bullish Bat pattern and if you inflation adjust ETH's current price using the older metrics of the M1 Money supply before the rule change in 2020, ETH's price right now would actually be around $770 in terms of 2018 dollar value which is pretty cheap. So I'd say now would be as good of chance as any for ETH to stage a bottoming rally and this rally would likely be in line with the bottoming fractal we see on BTC:
and the topping pattern we see on USDT Dominance:
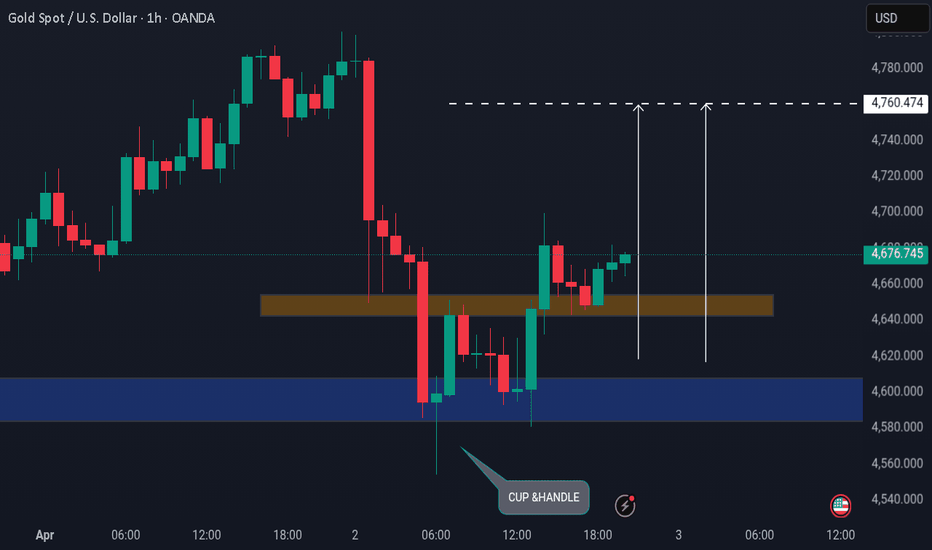
GOLD (XAU/USD): Strong Bullish Momentum Ahead?!!Following a test of key intraday structure on #GOLD, Price action suggests a confirmed liqu sweep .
After a brief false breakout of the shown zone , the market formed a cup and handle pattern and subsequently broke above the neckline, supported by a bullish imbalance on 1H time frame.
Based on the above structure and momentum, I expect the bullish continuation to persist, with a potential upside target around 4762 level.
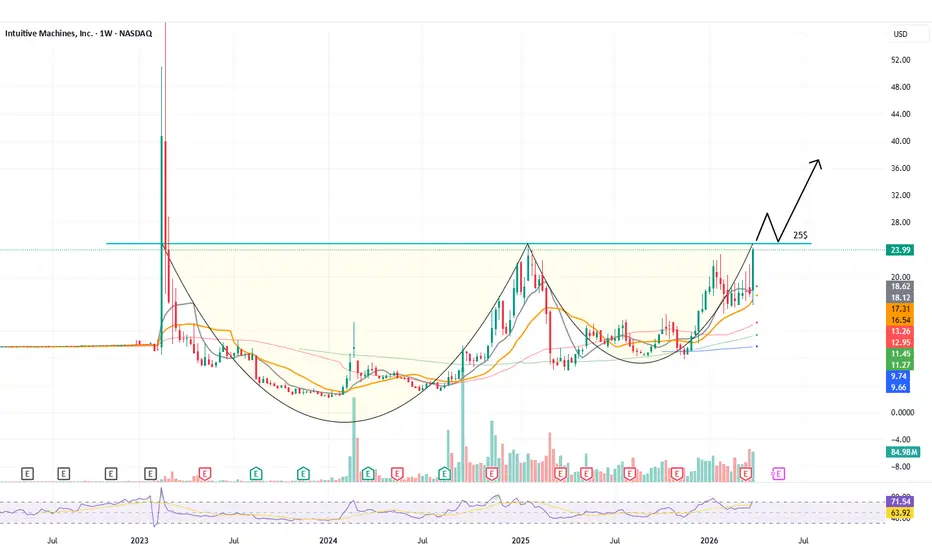
Devastating Cup & Handle?The price closed the week up 36% due to the hype surrounding the Artemis 2 mission, moving closer to completing a Cup & Handle pattern.
A close above $25 with rising volume would signal the start of an upward move.
For additional safety, wait for a subsequent retest of the $25 level before considering a long entry.
Be aware of the extreme volatility of these stocks.
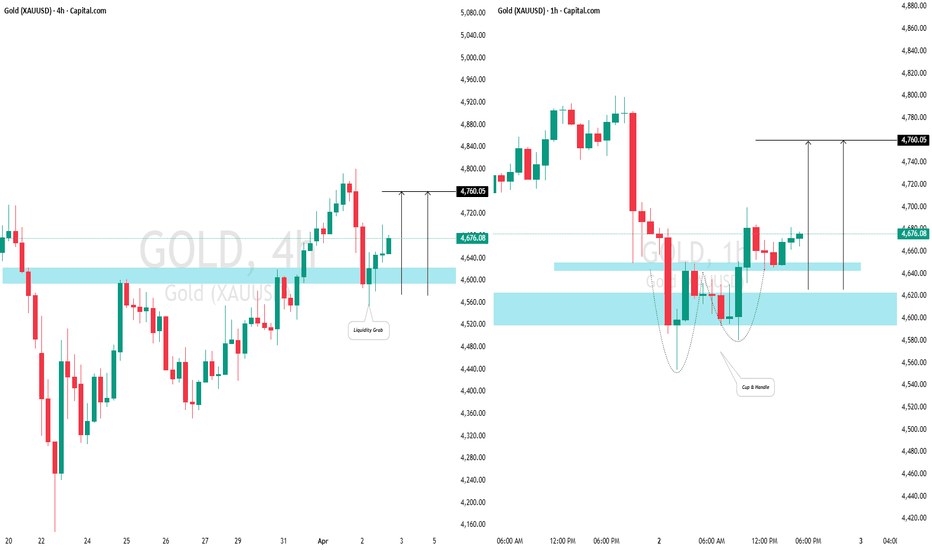
GOLD (XAU/USD): Strong Bullish Move Ahead?!After a test of a critical intraday structure on #GOLD, it looks like we have a valid liquidity grab.
Subsequent to a false violation of the highlighted area, the price formed a cup and handle pattern and violated its neckline with a bullish imbalance on an hourly chart.
I anticipate that the market will sustain its bullish momentum, potentially reaching at least the 4760 level.
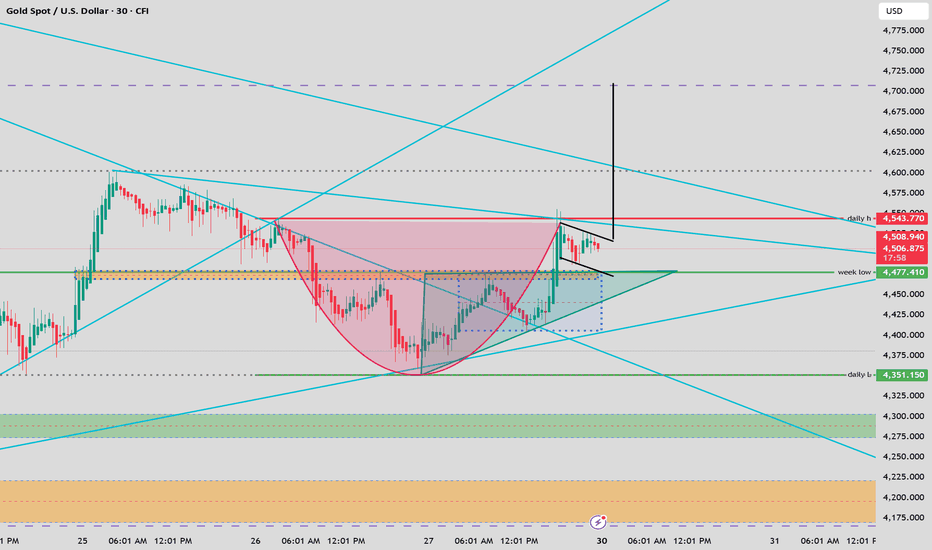
Next Big Move? Cup & Handle Scenarios to WatchOnce the cup‑and‑handle pattern completes on the 30‑minute chart and the price closes above the trendline, a Long position could be considered, with a potential target around $4,700.
Second Scenario, if the candle closes below the trendline 4450$, this may signal a Short opportunity, aiming toward $4,300.
Risk‑Management Tips
Never risk more than you can afford to lose.
Use stop‑loss orders to protect your capital in case the market reverses.
Avoid over‑leveraging; high leverage increases both risk and reward.
Only enter trades that fit your strategy—don’t chase price movements.
Stay disciplined and stick to your plan, even if emotions kick in.
This is not financial advice.
Trading involves significant risk, so act carefully and manage your exposure wisely.
Happy Trading! 📈✨
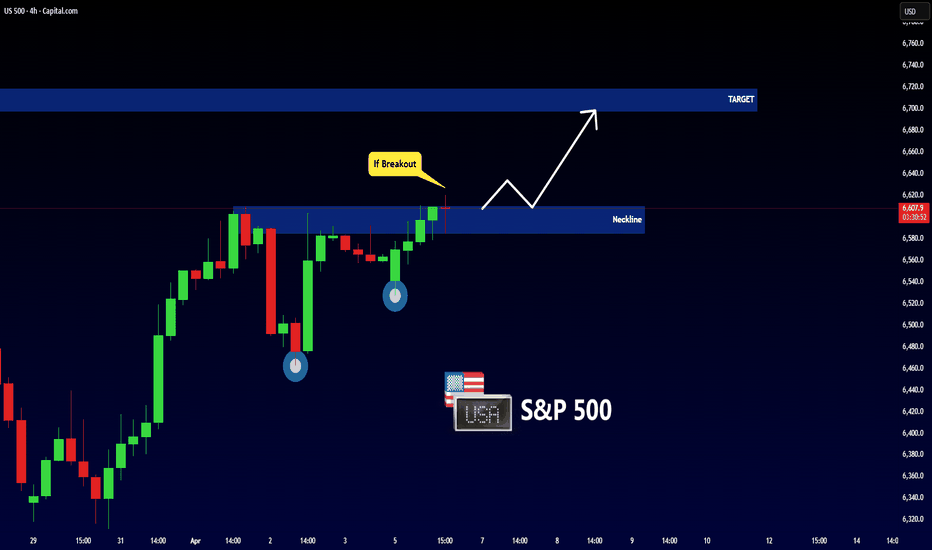
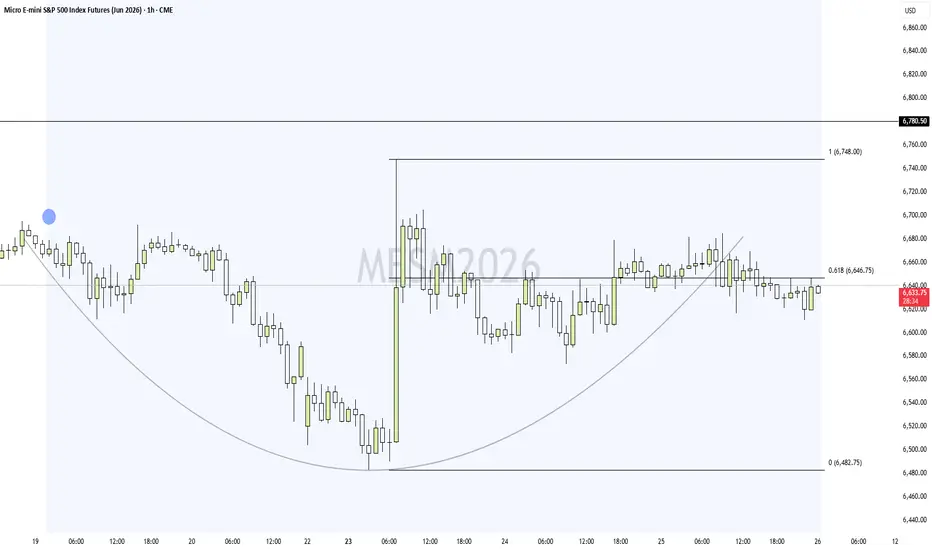
MES, New Moon Low? .618?I always like longing the new moon lows, especially if bulls can offer support at this .618
But I always like a good short too.
6646/6657ish is the range to trade away from intra day.
Longer term, I like taking the risk to go long if 6482 remains in tact, targeting a new local high into the full moon
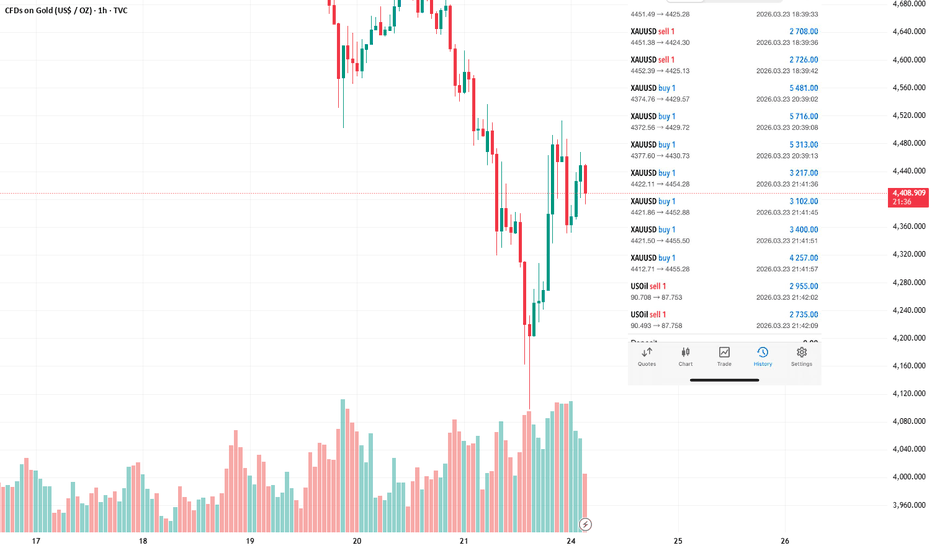
Buyers, take action!Buyers, take action! My buy order has begun execution.
The order is expected to close before the New York market closes. If the price doesn't reach 4460, then the order will need to wait until the Asian market opens to close.
When you see a good trading opportunity, remember to act. Don't miss out on a good buying opportunity by waiting.
Prediction Markets Tighten Rules As Insider Trading Ban BeginsPrediction markets just entered a critical phase. Platforms now face rising scrutiny from regulators and lawmakers. At the same time, user trust depends on fairness and transparency. This balance creates pressure on every major platform.
The recent prediction markets crackdown shows how fast the landscape changes. Kalshi and Polymarket introduced strict rules on the same day. Meanwhile, lawmakers pushed a bill that could shut these platforms down. This timing reflects urgency across the industry.
Traders now question how these platforms will operate moving forward. Both companies aim to protect their ecosystems. They also want to avoid legal battles that could disrupt growth. This shift marks a major turning point for crypto betting platforms.
Why The Prediction Markets Crackdown Arrived Suddenly
Regulators have watched prediction markets for months. They worry about market manipulation and unfair advantages. Lawmakers believe insiders could exploit sensitive information.
The new prediction markets crackdown responds directly to these concerns. Congress introduced a bill targeting these platforms. This move forced companies to act quickly.
Kalshi and Polymarket chose to tighten insider trading rules immediately. They aim to show regulators that they can self-regulate. This strategy could help them survive future legal challenges.
Kalshi Introduces Strict Controls To Prevent Conflicts Of Interest
Kalshi took a strong stance with its new policies. The platform now bans politicians from betting on their own campaigns. It also blocks athletes from betting on their own sports. These insider trading rules aim to remove direct conflicts of interest. Kalshi understands that trust drives user participation. Without trust, prediction markets cannot function effectively.
The platform also introduced whistleblower tools. These tools allow users to report suspicious trades. This step encourages community involvement in maintaining fairness. Kalshi’s approach shows how platforms adapt during a prediction markets crackdown. It focuses on transparency and accountability. This strategy may help build long-term credibility.
Polymarket Expands Its Rules To Cover Illegal Information Use
Polymarket followed a similar path but added broader restrictions. It now bans trades based on stolen information. It also blocks trades using illegal tips. The platform targets individuals who can influence outcomes directly. This includes insiders with access to confidential data. These insider trading rules reduce the risk of manipulation.
Polymarket wants to protect its reputation among crypto betting platforms. It understands that regulatory pressure will continue to rise. By acting early, it positions itself as a responsible player. This move also signals a shift in how platforms operate. They now prioritize compliance alongside innovation.
How Insider Trading Rules Could Reshape Market Participation
The new insider trading rules will change how users engage with these platforms. Traders must rely on public information instead of privileged access. This shift levels the playing field. However, stricter rules could reduce short-term trading activity. Some users may leave due to reduced advantages. Yet, long-term trust may attract more participants.
The prediction markets crackdown could improve overall market quality. Fair systems encourage broader adoption. This outcome benefits both platforms and users. Crypto betting platforms now face a new reality. They must balance innovation with strict compliance. Those who succeed will likely dominate the market.
Final Thoughts On Prediction markets
Prediction markets now face intense scrutiny from both regulators and users. Platforms respond with stronger insider trading rules and better monitoring tools. This shift signals a maturing industry.
The prediction markets crackdown highlights the importance of trust. Without fairness, these markets cannot survive. Kalshi and Polymarket understand this reality and act accordingly.
The coming months will reveal how effective these changes are. If platforms maintain transparency, they could secure long-term growth. If not, regulatory pressure may increase further.