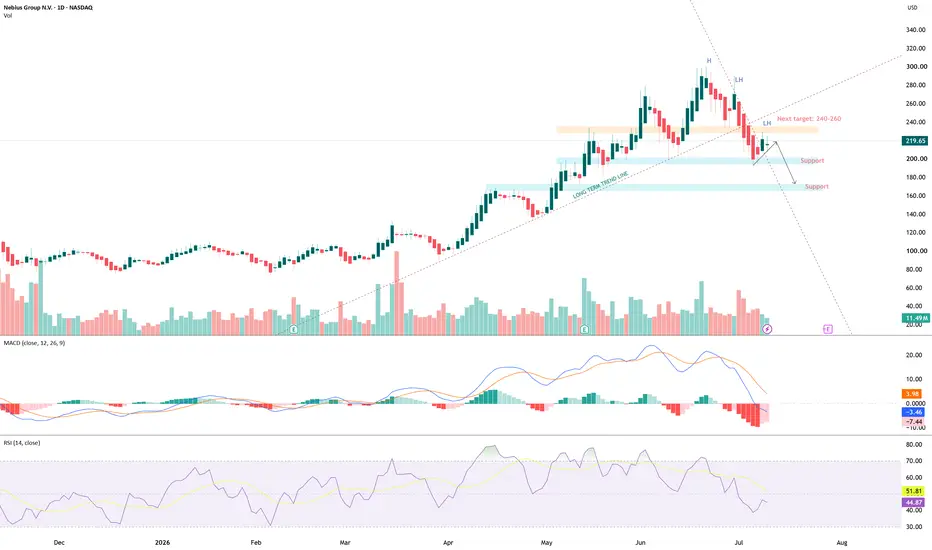
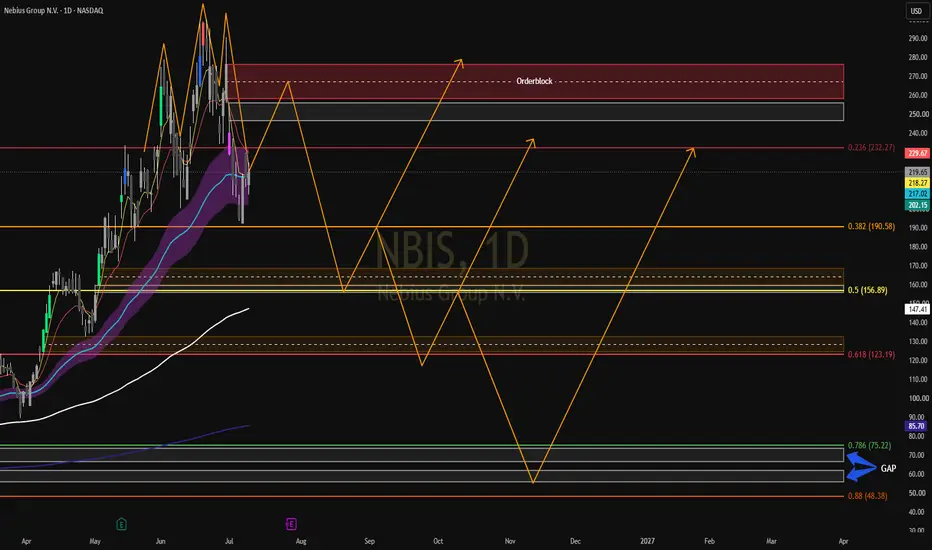
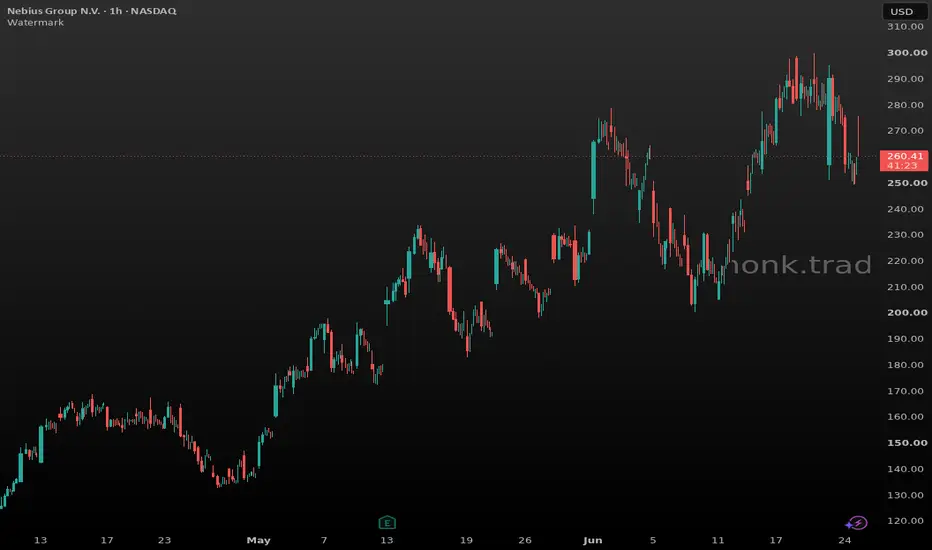
NBIS holders : quick updateIt’s been a strong year, but after months of steady pumping, the chart finally needs to breathe. We’re printing a clean LH, and that’s usually a sign to tighten up risk. Watch for any bear‑flag structure that could drag us back to support.
Next week is a toss‑up. Volume will decide the direction. H
Compare with Nebius Group N.V.
Key facts today
Nebius Group (NBIS): Freedom Capital raised 2026–27 revenue and adjusted EBITDA forecasts, citing planned 310 MW AI data‑center add in Lappeenranta and $40B+ contracted revenue from top customers. 1
3.39 USD
82.50 M USD
529.80 M USD
202.06 M
Next report date
—
Report period
—
EPS estimate
—
Revenue estimate
—
Profile
Sector
Industry
CEO
Arkady Volozh
Website
Headquarters
Amsterdam
Founded
2004
IPO date
May 24, 2011
ISIN
NL0009805522
FIGI
BBG001NVJ6W4
Identifiers
ISIN NL0009805522
Nebius Group NV is a technology company that provides infrastructure and services to AI builders worldwide. It offers Nebius AI, an AI-centric cloud platform provides full-stack infrastructure, including large-scale GPU clusters, cloud services, and developer tools. The company also operates through specialized brands: Toloka AI, which partners in data for generative AI development; TripleTen, an edtech platform focused on re-skilling individuals for tech careers; and Avride, which develops autonomous driving technology. Nebius Group was founded by Elena Kolmanovskaya, Ilya Segalovich, Mikhail Fadeev, and Arkady Volozh in 1989 and is headquartered in Amsterdam, the Netherlands.
NEBIUS should be in your portfolio in 2026NASDAQ:NBIS (Nebius) - a major player in the AI ecosystem, is approaching attractive technical buy levels.
From a fundamental perspective, we believe AI infrastructure will outperform AI leaders in 2026, following the strong gains seen in chipmakers throughout 2025. Historically, the more tangibl
Nebius Group📊 Nebius Group N.V. (NBIS)
ISIN: NL0009805522
****What the Company Does****
☁️ Provides AI cloud infrastructure and computing services
🖥️ Develops GPU-powered platforms for AI workloads
****Future Potential****
🤖 Growing demand for AI infrastructure and cloud services
📈 Expansion of GPU capacity
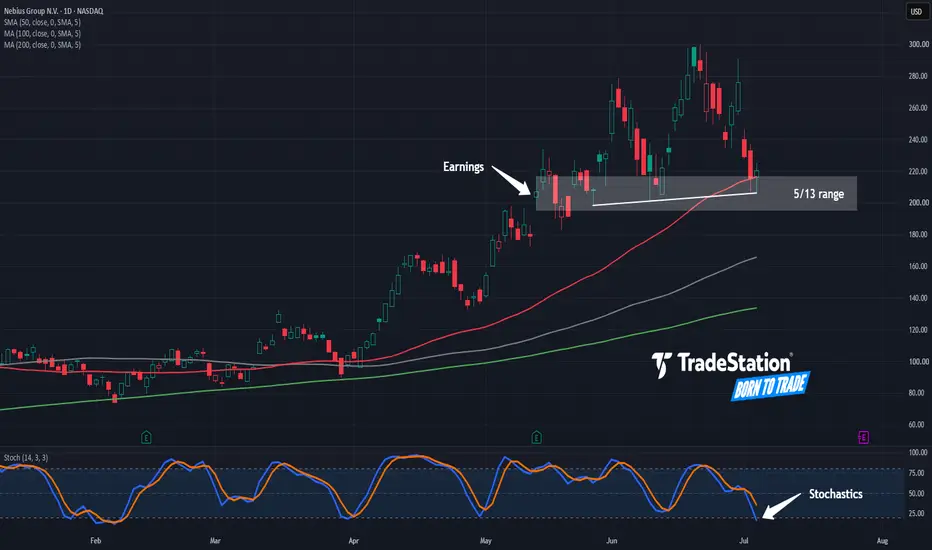
Nebius Pulls BackNebius hit a record high in mid-June, and now it’s pulled back.
The first pattern on today’s chart is the rally on May 13, propelled by strong quarterly results. The AI infrastructure stock fluctuated around $205 that session and has stayed mostly above that price area since. It’s now trying to st
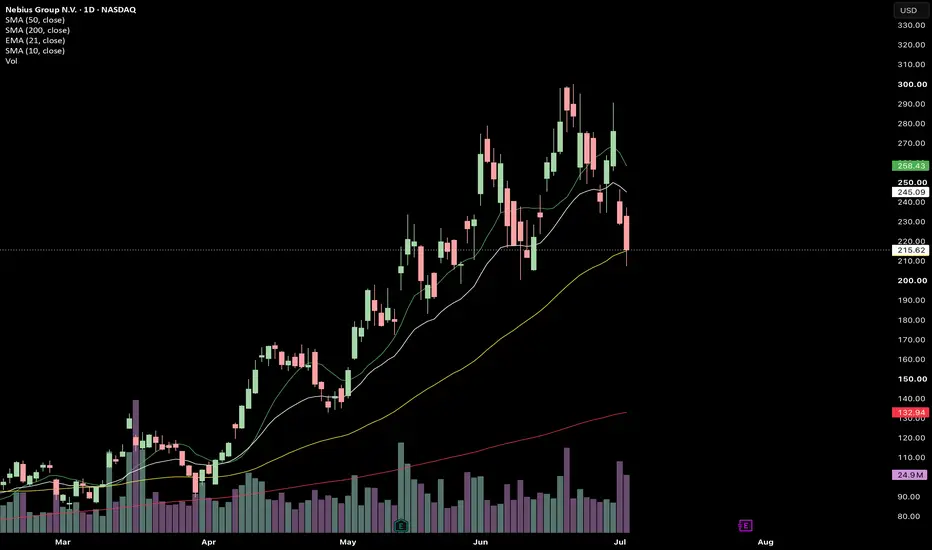
$NBIS 50MA Test to Gap Fill above $250.NASDAQ:NBIS First test of 50 Day-MovingAverage after April 2026, expecting a bounce here to at least gap fill to $250-260 where the 0.618 golden pocket is, if Monday sees a bounces at these equal lows, this can confirm a hidden-bullish divergence (continuation) for a bullish move. Stop loss would b
NBIS Long — $NBIS pulling back to the June 1 breakout shelf at $NBIS has been in a powerful uptrend on the 4-hour chart since late January, printing a clean series of higher highs and higher lows — from ~$80 to nearly $300. The most recent structural event is a sharp two-day pullback from the ~$300 peak down to the current ~$265 area, which lands directly on the
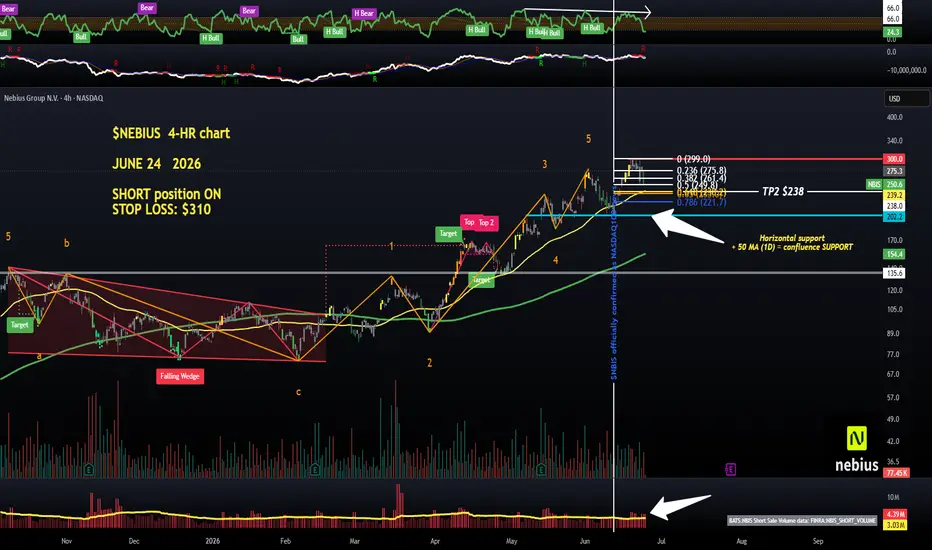
$NBIS (Nebius) short doing WELL, TP2 at $250, next TP at $239NASDAQ:NBIS (Nebius) & VANTAGE:NVIDIA : both weak as hell...
NASDAQ:NBIS short is already sitting on a solid profit. You could even take a small TP2 here, but lower targets still look likely. Distribution has clearly been underway for some time now, and larger players are joining the short side
$NBIS - SHORT from the very TOP doing well - the DAILY chart updTP1 hit on the Nebius short from 5 days ago.
NASDAQ:NBIS - Daily Chart
I know most people thought I was crazy when I posted a short on the strongest bull of the spring, literally a few days before they officially joined the Nasdaq100. It was supposed to pump. Funds had to buy. Only up. Bullish s
See all ideas
Summarizing what the indicators are suggesting.
Neutral
SellBuy
Strong sellStrong buy
Strong sellSellNeutralBuyStrong buy
Neutral
SellBuy
Strong sellStrong buy
Strong sellSellNeutralBuyStrong buy
Neutral
SellBuy
Strong sellStrong buy
Strong sellSellNeutralBuyStrong buy
An aggregate view of professional's ratings.
Neutral
SellBuy
Strong sellStrong buy
Strong sellSellNeutralBuyStrong buy
Neutral
SellBuy
Strong sellStrong buy
Strong sellSellNeutralBuyStrong buy
Neutral
SellBuy
Strong sellStrong buy
Strong sellSellNeutralBuyStrong buy
Displays a symbol's price movements over previous years to identify recurring trends.
— YTM
Maturity dateMar 15, 2033
Coupon2.63% (Fixed)
— YTM
Maturity dateSep 15, 2030
Coupon1.00% (Fixed)
— YTM
Maturity dateSep 15, 2032
Coupon2.75% (Fixed)
— YTM
Maturity dateMar 15, 2031
Coupon1.25% (Fixed)
See all NBIS bonds
Weight0.18%
Market value837.04 M
Weight0.15%
Market value272.42 M
Weight0.18%
Market value177.59 M
Weight0.17%
Market value130.34 M
Weight1.84%
Market value83.74 M
Weight0.24%
Market value78.22 M
Weight0.22%
Market value61.45 M
Weight0.04%
Market value60.05 M
Weight0.04%
Market value60.05 M
Weight0.04%
Market value60.05 M
Weight0.04%
Market value60.05 M
Explore more ETFs
Frequently asked questions
The current price of NBIS is 182.62 USD — it has increased by 4.33% in the past 24 hours. Watch Nebius Group N.V. stock price performance more closely on the chart.
Depending on the exchange, the stock ticker may vary. For instance, on NASDAQ exchange Nebius Group N.V. stocks are traded under the ticker NBIS.
NBIS stock has fallen by −12.83% compared to the previous week, the month change is a −37.83% fall, over the last year Nebius Group N.V. has showed a 234.16% increase.
We've gathered analysts' opinions on Nebius Group N.V. future price: according to them, NBIS price has a max estimate of 380.00 USD and a min estimate of 144.00 USD. Watch NBIS chart and read a more detailed Nebius Group N.V. stock forecast: see what analysts think of Nebius Group N.V. and suggest that you do with its stocks.
NBIS reached its all-time high on Jun 22, 2026 with the price of 299.86 USD, and its all-time low was 9.94 USD and was reached on Aug 24, 2015. View more price dynamics on NBIS chart.
See other stocks reaching their highest and lowest prices.
NBIS stock is 9.29% volatile and has beta coefficient of 2.96. Track Nebius Group N.V. stock price on the chart and check out the list of the most volatile stocks — is Nebius Group N.V. there?
Today Nebius Group N.V. has the market capitalization of 43.23 B, it has decreased by −15.58% over the last week.
Yes, you can track Nebius Group N.V. financials in yearly and quarterly reports right on TradingView.
Nebius Group N.V. is going to release the next earnings report on Jul 29, 2026. Keep track of upcoming events with our Earnings Calendar.
NBIS earnings for the last quarter are −0.32 USD per share, whereas the estimation was −0.77 USD resulting in a 57.72% surprise. The estimated earnings for the next quarter are −0.56 USD per share. See more details about Nebius Group N.V. earnings.
Nebius Group N.V. revenue for the last quarter amounts to 399.00 M USD, despite the estimated figure of 375.13 M USD. In the next quarter, revenue is expected to reach 580.29 M USD.
NBIS net income for the last quarter is 621.20 M USD, while the quarter before that showed −249.60 M USD of net income which accounts for 0.00% change. Track more Nebius Group N.V. financial stats to get the full picture.
No, NBIS doesn't pay any dividends to its shareholders. But don't worry, we've prepared a list of high-dividend stocks for you.
As of Jul 21, 2026, the company has 1.54 K employees. See our rating of the largest employees — is Nebius Group N.V. on this list?
EBITDA measures a company's operating performance, its growth signifies an improvement in the efficiency of a company. Nebius Group N.V. EBITDA is 5.80 M USD, and current EBITDA margin is −27.03%. See more stats in Nebius Group N.V. financial statements.
Like other stocks, NBIS shares are traded on stock exchanges, e.g. Nasdaq, Nyse, Euronext, and the easiest way to buy them is through an online stock broker. To do this, you need to open an account and follow a broker's procedures, then start trading. You can trade Nebius Group N.V. stock right from TradingView charts — choose your broker and connect to your account.
Investing in stocks requires a comprehensive research: you should carefully study all the available data, e.g. company's financials, related news, and its technical analysis. So Nebius Group N.V. technincal analysis shows the neutral today, and its 1 week rating is neutral. Since market conditions are prone to changes, it's worth looking a bit further into the future — according to the 1 month rating Nebius Group N.V. stock shows the buy signal. See more of Nebius Group N.V. technicals for a more comprehensive analysis.
If you're still not sure, try looking for inspiration in our curated watchlists.