Gold Holds Above the Broadening Wedge: Is the Correction Ending?Gold ( OANDA:XAUUSD ) has declined over the past 4–5 days, but the move has developed with high volatility and relatively weak bearish momentum.
As long as gold remains above the trendlines of the Descending Broadening Wedge Pattern, the broader bullish scenario remains valid.
Can gold complete its correction here and begin another impulsive move toward $4,400?
Technical Analysis
Gold is currently trading above the Descending Broadening Wedge Pattern and near the Heavy Support Zone.
From an
Descending Broadening Wedge
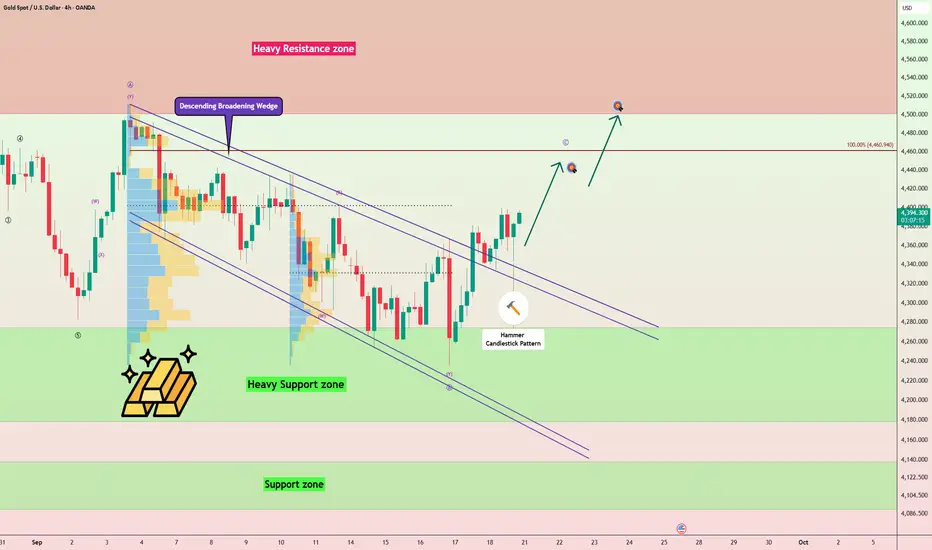
Gold Breaks the Broadening Wedge — Is $4,500 Next?Gold ( OANDA:XAUUSD ) has successfully broken above the upper trendline of the Descending Broadening Wedge Pattern and is currently trading above the pattern.
This breakout could signal the beginning of another bullish move during the final trading hours of the week and potentially into next week.
Can gold confirm the breakout above $4,400 and extend its rally toward $4,487?
Technical Analysis
The breakout above the Descending Broadening Wedge suggests that bearish pressure may be weakening
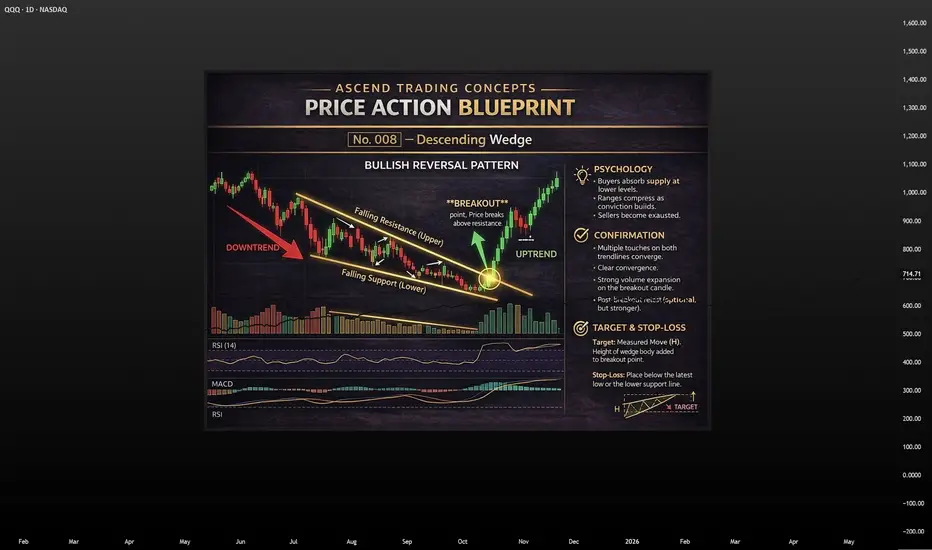
Price Action Education Series: Descending Wedge PatternA descending wedge is a bullish pattern that often forms while price is still drifting lower, which is why many traders misread it at first.
At a glance, the chart looks bearish. Price is falling, momentum looks weak, and the market seems heavy. But in a true descending wedge, both trendlines slope downward and converge, meaning the range is tightening as price falls.
That tightening matters.
👉 Sellers are still pushing price lower
👉 Each push lower is becoming less effective
👉 The downtrend
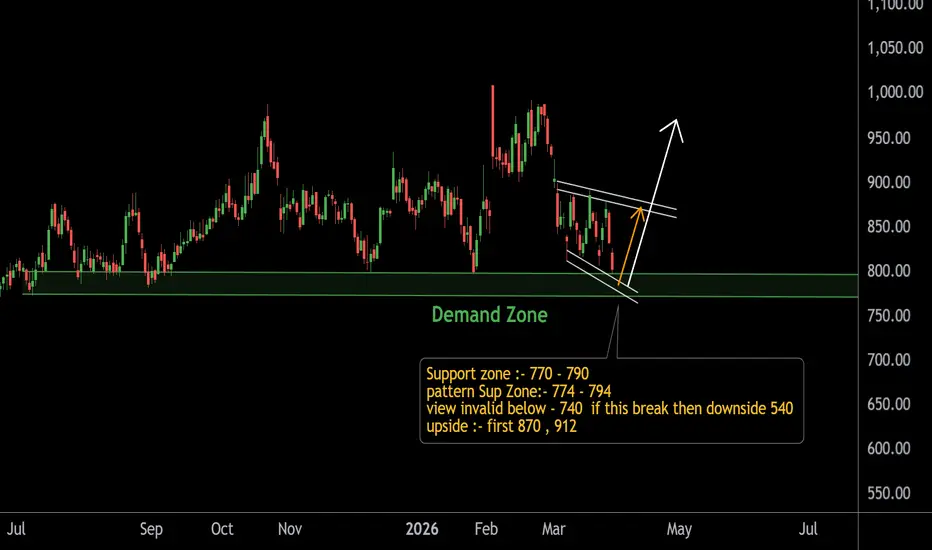
NAM_INDIA Key Demand Zone – Make or Break Levels AheadThis is the higher time frame view showing a strong demand zone around 770 – 790, where price has reacted multiple times in the past.
Key Observations:
• Price is currently trading near a falling channel pattern
• Testing an important demand/support zone
• Compression near support hints at a possible volatility expansion ahead
Important Levels:
• Support Zone: 770 – 790
• Pattern Support: 774 – 794
• Invalidation Level: Below 740 (strong bearish continuation possible)
Upside Potential:
•
Gold Roadmap (1H): Breakout Scenario in PlayToday, I want to share a long setup for Gold( OANDA:XAUUSD ) on the 1-hour timeframe—so stay with me!
Gold is currently moving near a resistance zone($4,991-$4,878).
From a classical technical perspective, it appears that gold has formed a descending broadening wedge pattern. If we break above the upper lines of this pattern, we can anticipate bullish momentum in the coming hours.
From an Elliott Wave perspective, it seems gold can continue its upward corrective wave, likely a ZigZag Correcti
LINK Market Cap - Descending Wedge at $9.25B | Bullish Breakout Executive Summary
Chainlink (LINK) market cap trading at $9.25B within a descending wedge on the 1D timeframe. Price holding key support while forming bullish structure. Strong accumulation signals with $50M in exchange outflows from Binance. Expecting bullish breakout past the highs as selling pressure fades and smart money accumulates.
BIAS: BULLISH - Breakout Structure Forming
Current Market Context
LINK broke 21-day MA - altcoins looking for "upward run" in next 2-3 months
$50M
Sun TV: Critical Levels Setting Up the Next MoveThis is the 1-hour timeframe chart of Sun TV.
The stock is forming a Descending Broadening Wedge pattern with a support zone near ₹515–525 and resistance around ₹565–575.
The trend is currently negative, but if the price breaks above the resistance zone, the stock may move toward the
pattern target near ₹620.
Thank you.
S&P 500 at Make-or-Break Level – Bulls’ Last Chance!As I expected in the previous idea , the S&P 500 index ( SP:SPX ) has reached its target.
Given that the S&P 500 index has a strong correlation with other financial markets, especially Bitcoin ( BINANCE:BTCUSDT )—sometimes even tracking them candle-by-candle—it's a good idea to pay extra attention to the S&P 500 index these days.
Currently, the S&P 500 index is moving in a Heavy Support zone($6,775_$6,689) , although it entered this zone with a lot of downside momentum.
From a classic
JUBLFOOD Strength at Support Indicates a Potential Rally AheadJUBLFOOD — Multi-Timeframe Technical Analysis
Monthly Timeframe:
JUBLFOOD is showing strong support on the EMA, with the first key support area positioned near the 580 level. This zone has historically acted as a major demand area, suggesting potential accumulation.
Weekly Timeframe:
The stock is currently trading near the 570–590 support zone, where the Supertrend indicator is also providing confirmation of support. Sustaining above this zone could trigger a potential reversal or upward momen
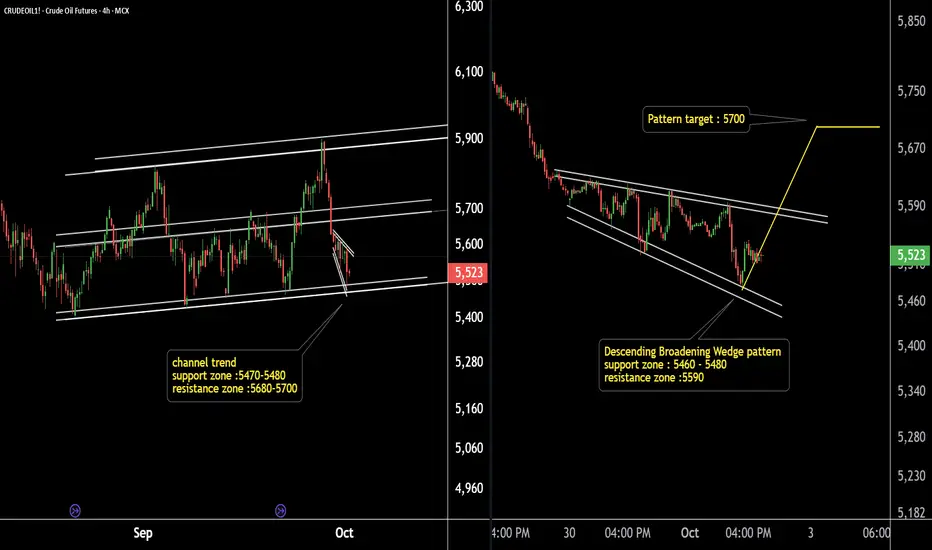
Crude Oil Ready to Explode ? Watch This Key Support Pattern!Crude Oil (4H & 15Min Chart) Analysis:
Crude Oil is moving within a well-defined parallel channel on the 4-hour timeframe, with a strong support zone at 5480–5490.
On the 15-minute chart, a descending broadening wedge is forming, with the pattern support zone also near 5480–5490 and pattern resistance around 5600.
Potential breakout target: 5700.
If the support zone holds, we may see higher prices in Crude Oil.
Summary: Key support at 5480–5490 is critical. Watch for a breakout above 5600 f
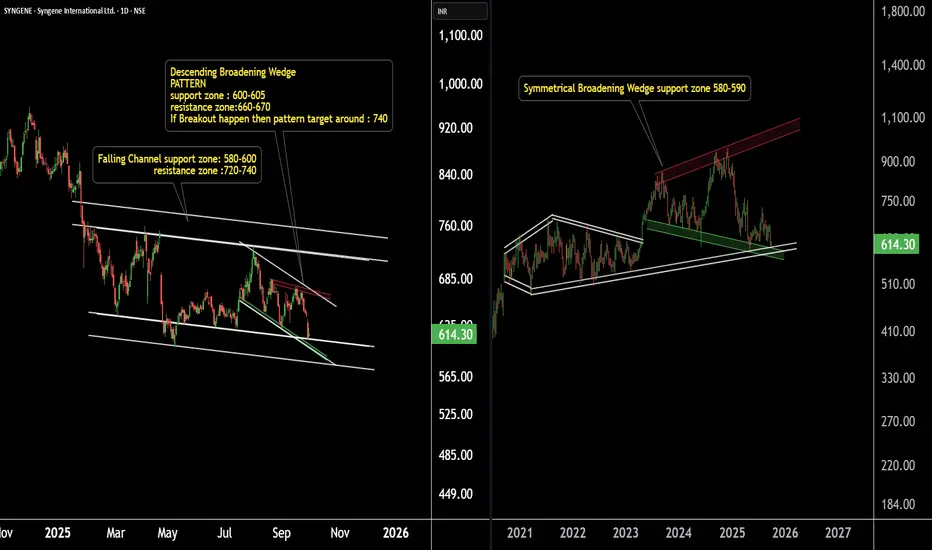
Big Move Loading in Syngene International.Pattern on Support.Syngene International – Daily & Weekly Chart Analysis
Syngene International is exhibiting a confluence of patterns across multiple timeframes, all aligning near a strong support zone.
On the weekly chart, the stock is forming a broadening wedge pattern, with a key support zone around ₹580–590.
On the daily chart, Syngene is trading within a well-defined falling channel, with support again placed near ₹580–590.
Additionally, the price structure is also shaping into a descending broadening wed
Gold Roadmap=>Short termGold ( OANDA:XAUUSD ) currently appears to have broken through the Resistance zone($3,350-$3,325) .
The Resistance zone($3,350-$3,325) was broken with the help of the Descending Broadening Wedge Pattern , the upper line of this classic pattern having served as an important resistance line for us in previous ideas .
In terms of Elliott wave theory , Gold has completed the Double Three Correction(WXY) within the Descending Broadening Wedge Pattern . It is currently completing th
AXIS BANK at Best Support !!Here are two charts of Axis Bank — one in the 4-hour timeframe and the other in the 1-hour timeframe.
4-Hour Timeframe Chart:
In this chart, Axis Bank is moving within a parallel channel, with the support zone lying in the 1150–1160 range.
1-Hour Timeframe Chart:
Axis Bank is forming a descending broadening wedge pattern, with support near the 1150–1155 zone.
If this level is sustain ,then we may see higher prices in Axis Bank.
Thank You !!
SJVN 's Key level for Swing .This is the 4 hour chart of SJVN.
SJVN is forming a broadening pattern with support near at 90 range.
SJVN is forming a descending broadening pattern within a larger ascending broadening structure with support at near 91 range.
If this level is sustain then ,we may see higher prices in SJVN.
Descending broadening wedge after peak BTC/USD 4hCurrently BTC/USD is in a descending broadening wedge after a peak.
This means high chance of upward breakout. Price increase from breakout point is usually the difference from pattern top to pattern bottom, which would mean a price of $123000.
Not financial advice. There is a chance of this not playing out, even though the chance is small.
Failed Wedge, New Setup. Is SUI About to Break Out?In my previous post about BYBIT:SUIUSDT , I mentioned a potential falling wedge pattern. However, the breakout above the 4.0040 resistance turned out to be a false breakout, and the price eventually dropped to the invalidation level at 3.5868. This made the setup invalid.
But despite the failed wedge breakout, BYBIT:SUIUSDT remains in a bullish trend overall. During the current consolidation, the price appears to be forming a new bullish pattern — a Descending Broadening Wedge (DBW).
Th
Ethereum ... Don't miss this train!The Ethereum season has arrived, and in the coming days, we'll be focusing on Ethereum and the tokens built on its network.
The chart shows a descending broadening wedge pattern, which has been broken on the daily timeframe.
Don’t wait for a retest or any major corrections—this train won’t wait for you.
The target for this pattern is $6,600.
Best regards Ceciliones🎯
Crucial Level to Watch on BTC.DWe can see that CRYPTOCAP:BTC.D is still in a bullish trend and is currently testing a crucial level, which will determine whether it continues to make a higher high or starts weakening towards its previous low.
The influence of CRYPTOCAP:BTC.D on the crypto market is simple: if CRYPTOCAP:BTC.D moves higher, it means more money is flowing into Bitcoin. For example, if CRYPTOCAP:BTC.D is at 64%, it means 64% of the total crypto market capitalization is in Bitcoin, and the remaining 36% i
Will This Descending Wedge Push HYPE to 22.5?If we take a closer look at the price structure, the orange and blue arrows show that BITGET:HYPEUSDT is in an overall uptrend. Meanwhile, the white arrow represents a minor pullback—just a ripple within the bigger trend.
When we connect the orange to the white, and then the white to the blue arrow, we can spot a descending broadening wedge formation. Given the current bullish structure, this pattern is more likely acting as a continuation rather than a reversal.
After the pattern is complet
XAUUSD Weekly Analysis – Bearish Correction ExpectedGold (XAUUSD) has recently broken above a rising wedge resistance on the weekly timeframe but is now showing early signs of potential exhaustion. Price action is currently hovering around the $3,024 level after a strong bullish rally. However, historical patterns and structure suggest a possible bearish correction ahead.
📊 Key Technical Observations:
Rising Wedge Pattern: Price has been following an ascending channel with a sharp parabolic curve. The structure hints at overextension, making
Bitcoin Roadmap: Breaking the Broadening Wedge – A Buy Signal?After the tariffs that Donald Trump approved for the European Union and China , Bitcoin ( BINANCE:BTCUSDT ) received a shock with each approval. Otherwise, Bitcoin should have returned to the upward trend, at least in the short term.
Bitcoin seems to have failed to break 200_SMA(Daily) , and most of the time the invalid break is accompanied by the opposite movement of that break with high momentum. Also, Bitcoin seems to have broken the Resistance zone($83,530_$82,250) and is pu
BTC/USDT ! HOUR DESCENDING BROADENING WEDGE LONG TARGET 105KIn this idea I have a clean descending broadening wedge that is about to take off to 105k. Target is clearly marked and should hit that no problem. If you agree throw me a like and follow me for more setups that keep you in the money. Much love - ND
BTCUSD | 95K Target 1:1 Move | BullishThis will be the first big trade at the start of the exponential cycle we're about to witness for the 5th time in BTC history.
Considering the descending broadening wedge pattern, a 1:1 move into the pattern gives a price target of roughly $95k.
It can also been seen as a flag pattern which also reads a $95k impulse target as seen below:
If you want to look at more longer-term targets and analysis of CRYPTOCAP:BTC , I've attached 3 of the charts I've made which will satisfy that long te