XAUUSD: Bullish Trend Still Holds Above 4,280
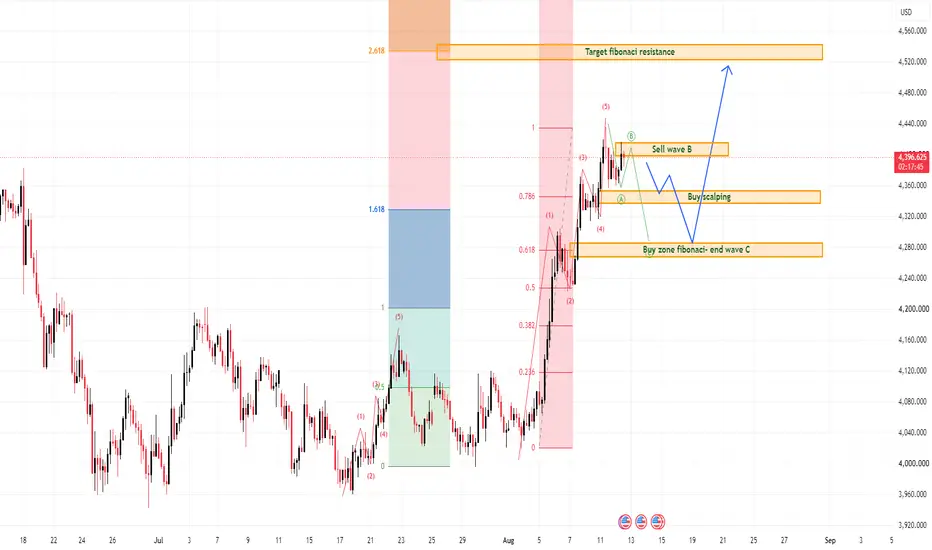
Gold is still holding a strong bullish structure after the sharp recovery from the lower accumulation base. From Kelly’s view, the current chart suggests that XAUUSD may be moving through a short-term ABC correction before continuing higher towards the Fibonacci resistance target.
The key idea is simple: gold remains bullish overall, but price may need a healthy pullback before the next upside wave becomes cleaner.
⟡ Market structure
The chart shows gold made a strong impulsive move from th
Elliott Wave
Elliott Wave Extensions – Motive WavesAn extension occurs when one of the motive waves becomes unusually large and develops a significantly more complex internal structure than the other waves of the same degree. In an Impulse, an extension can occur in Wave 1, Wave 3, or Wave 5.
It is important to distinguish an extension from internal waves. Internal waves are simply the lower-degree subdivisions that exist within an Elliott Wave, whereas an extension is a wave that becomes disproportionately large and contains additional interna
Microsoft Stock: Is the Long-Term Uptrend Near Its Final Stage?Microsoft Stock: Is the Long-Term Uptrend Near Its Final Stage?
Microsoft remains inside the long-term rising channel that has guided the stock since around 2010. As long as this structure holds, my broader view remains bullish and I still expect room for price to move higher.
The more important question is what stage of that rise Microsoft is in now. My current Elliott Wave count suggests that the long-term advance is already well developed and may be approaching its final section.
The
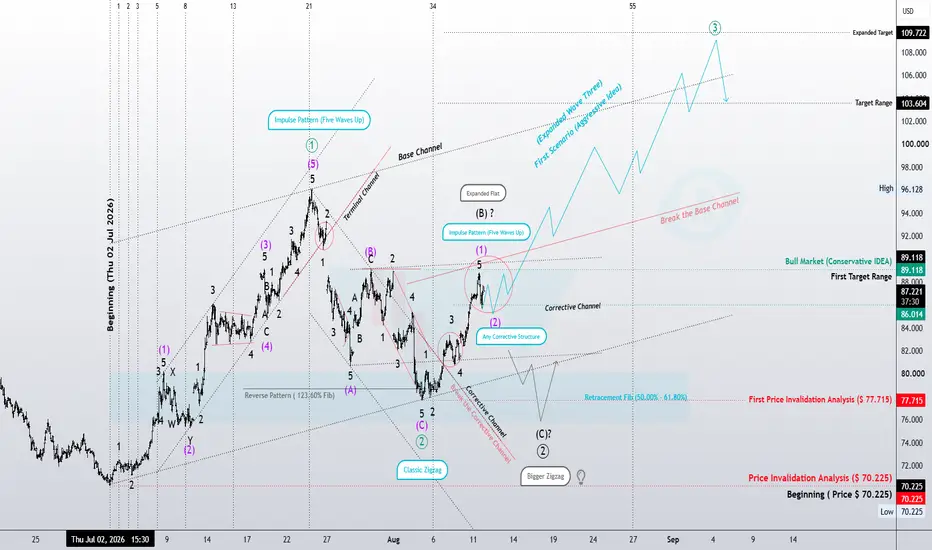
Wave III?Crude Oil: Wave III?
From an Elliott Wave perspective, the move from the 70.225 low to approximately 96.128 appears to have developed as a complete five-wave Impulse, which can be considered Wave (1) of a higher degree.
The market then entered a corrective phase that appears to have completed around the 77–80 area, with the structure remaining consistent with a Classic Zigzag. From this point, the primary focus shifts toward the developing bullish structure.
The recent advance from the correc
Ready For A Rally For Crude Oil?Crude oil may be preparing for a much larger impulsive advance. After completing the previous corrective structure near the $72–73 region, the current price action suggests that a new bullish Wave 3 may be developing, with a potential long-term target around $126.44.
The current 4-hour structure presents an interesting setup.
The previous decline into the $72–73 area completed the corrective structure we were tracking. Since then, crude oil has established a series of higher highs and higher lo
RBOB Gasoline | Is Wave III About to Begin?Under the aggressive scenario, we consider Waves (I) and (II) to represent the largest degree in the current count. Following a major correction in the previous cycle, the market entered a new bullish phase. From our perspective, the price action at the beginning of 2026 can be interpreted as a sharp and fast Classic Impulse, potentially forming Wave I of this new degree.
At present, Wave II has reached the vicinity of Wave 4 of the initial impulse. This is an important structural area and coul
Gold at $4,355: Breakout or Pullback?
Gold remains structurally bullish on H1, but price is now trading directly beneath a major external high at 4,370.607.
That makes the current area interesting — but not necessarily attractive for chasing longs.
📊 H1 Structure
The bullish structure remains intact:
Higher highs + higher lows
Price holding above the rising support trendline
Previous bullish displacement remains valid
Price is approaching external buy-side liquidity
Current location = premium
The key level is 4,370.607.
A cle
Hyperliquid Pullback Could Set Up the Next RallyHyperliquid (HYPEUSD) remains one of the best-performing assets in the crypto market, continuing to show relative strength despite the recent slowdown. While the price action has lost some momentum in the short term, the broader bullish structure remains constructive.
The current price action may be completing wave “c” of an abc correction within a higher-degree wave 4. If this interpretation is correct, the ongoing weakness could represent the final stage of the corrective phase before the nex
Amazon Stock Analysis: AMZN Elliott Wave OutlookAmazon Stock Analysis: Long-Term Structure, Elliott Wave and Key Price Zones
Amazon stock has just made a new higher high, while the larger AMZN technical structure remains inside a rising channel that has guided price for almost two decades.
In this analysis, I will start with the monthly chart, then move down to the weekly and daily timeframes. The goal is to understand where Amazon may be inside its larger Elliott Wave structure, where the current advance could extend, and which price area
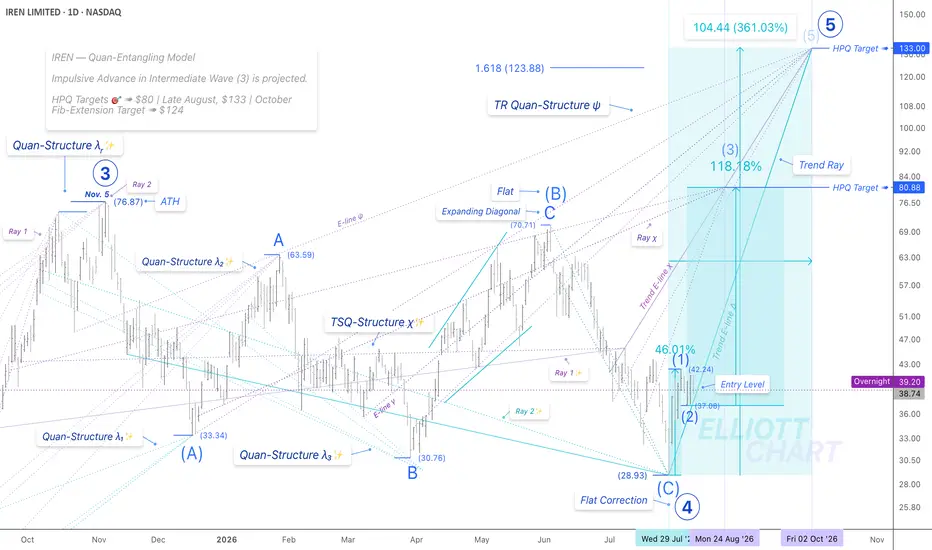
IREN | DailyNASDAQ:IREN — Quan-Entangling Model
Quan-Analysis | Projecting Impulsive Advance in Int Wave (3) 📈
There is no change in my analysis. Trend-Support E-line Δ, which was anchored through the HPQ Target ➤ $133, remains untouched.
With the structural preset quite well established for an approximately 118.18 %📈 impulsive advance in Intermediate Wave (3), the current price zone may still be respected as a potential entry region at the origin of the illustrated Trend Ray.
The CR Ray χ continues to
KEEL | WeeklyNASDAQ:KEEL — Quan-Entangling Model
Quan-Analysis | Projecting the Impulsive Advance of Minor Wave 5 📈
With the week opening precisely at Trend E-line τ of the illustrated Trend Ray, no structural refinements have been required at this stage.
The T rend- S upport Q uan-Structure Δ now functions as the structural confluence support zone, while the Triple Trend E-line Δχγ also remains untouched. From this foundation, an impulsive advance of approximately 185% 📈 continues to be projected.
Crude Oil: Is a Larger Wave III Beginning?From an Elliott Wave perspective, the current structure suggests that Waves I and II of the current degree may be complete, placing the market at a critical stage.
Wave I developed as a five-wave Impulse, followed by Wave II unfolding as a corrective structure. Therefore, under the aggressive scenario, the current structure may be preparing to enter Wave III, which, if confirmed, would be expected to develop with greater strength and momentum than the initial wave.
The initial advance from the
DXY | The Diagonal Test DXY | The Diagonal Test 🌀
In this update, our focus remains on the Aggressive Scenario—a higher-degree interpretation in which the recent structure may represent either Wave (C) or Wave (III).
A closer examination of the 4-hour chart suggests that the current structure could initially be interpreted as a Double Zigzag. However, the ongoing price development also raises the possibility that the market is building a Leading Diagonal.
At this stage, the more compelling structural interpretation
Elliott wave analysis for NAS100.I wanted to focus on the corrective structures that have occurred after the October 2022 bottom.
Liberation Day gave us a zigzag, truncated C wave and sharp reversal to the upside.
5 months of price action from October 2025-March 2026 gave us a regular flat, ending diagonal C wave, and sharp reversal upward.
June-July 2026 could be interpreted as another regular flat, but I am suspicious of two flats in a row. With the law of alternation, two flats would need to be interpreted as a 1/2, 1/2 r
Episode 02 — The Man Who Saw the Patterns🎬 Mr. Nobody’s Chronicle
Season I — The History of Elliott Wave Principle
Episode 02 — The Man Who Saw the Patterns
“Every great discovery begins with a question.”
In the previous episode, we spoke of the waves that existed long before Elliott.
Waves that moved through the markets every day—yet to most people, they were nothing more than fluctuations in price.
But one man decided to look closer.
Not simply at price...
but at behavior.
His name was Ralph Nelson Elliott.
A man whose name w
DEducation
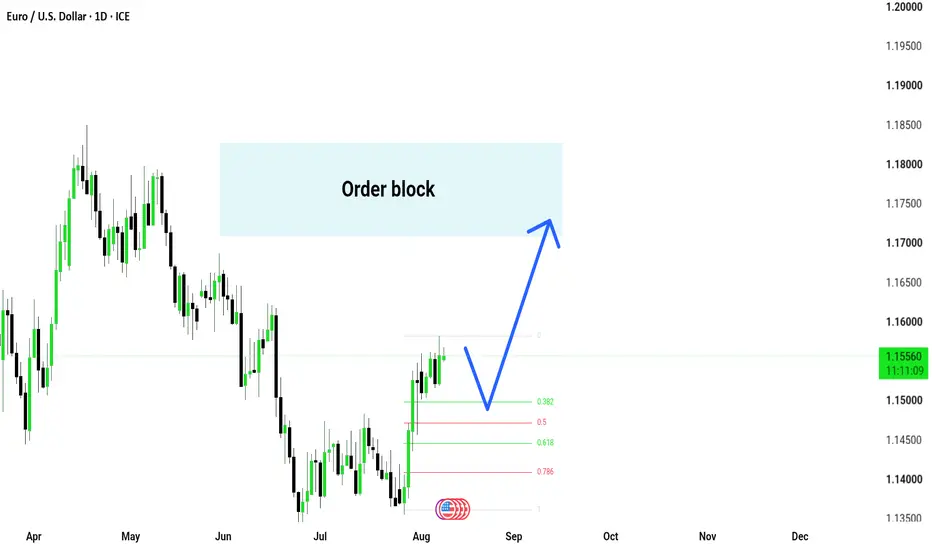
EUR/USD 1D — Bullish setupWaiting for confirmation before entry.
Price is holding above the 0.382–0.5 Fibonacci retracement zone. I’m watching for a pullback into this area, followed by bullish continuation toward the 1.1700–1.1800 Order Block.
Key zone: 1.1490–1.1500
Target: 1.1700–1.1800
Bias: Bullish 📈
Walmart: Short-Term Weakness Within a Larger Bullish StructureWalmart appears to have completed a larger 5-wave bullish structure, with Wave (5) reaching around $135 before the trend shifted into a corrective phase. The decline from that high has developed in a more overlapping manner, which fits better with an ABC correction rather than a fresh bearish impulse. Wave (A) appears to have ended near $113, followed by a recovery that is currently forming Wave (B). This bounce has so far remained below the previous major high, keeping the corrective structure
XAUUSD: Bullish Trend Continues After BreakoutGold is showing a strong bullish continuation after breaking away from the previous downtrend structure. From Kelly’s view, the chart suggests that XAUUSD has already formed a clean 5-wave recovery pattern on the H4 timeframe, and the market may continue higher if the next correction stays controlled.
The key idea is simple: gold is bullish, but after a strong rally, a short-term ABC pullback may create a cleaner continuation setup.
⟡ Market structure
The chart shows gold broke above the down
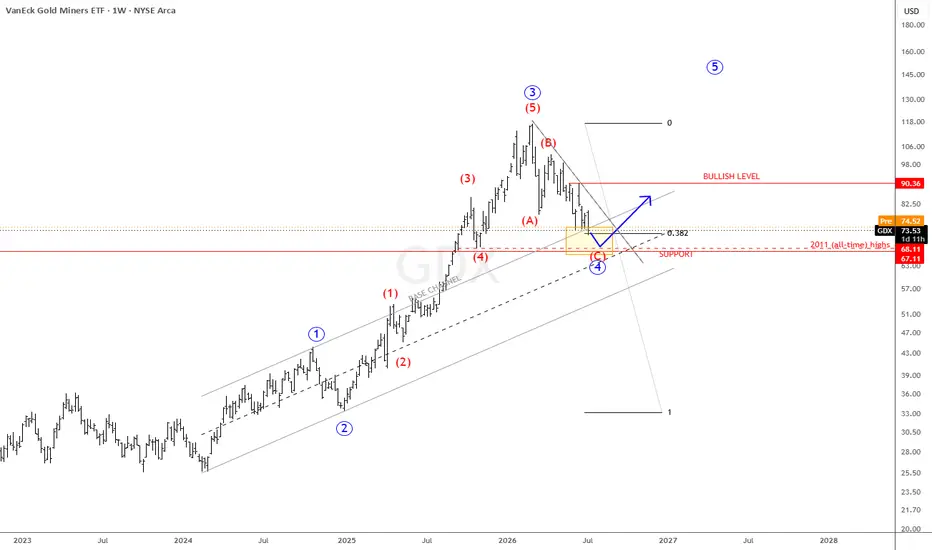
Gold Miners (GDX) Approaching Key Support ZoneGold and gold miners are now approaching important support zones that could define the next major market move. The weekly chart of the VanEck Gold Miners ETF (GDX) highlights a critical area where the ongoing wave 4 correction could potentially find support before the next impulsive advance begins.
GDX is approaching an attractive support zone formed by the 2021 all-time highs, the 38.2% Fibonacci retracement level, and the upper line of the base channel, which all converge around the 70–68 reg
Crypto Market Breaks Higher as Risk-On Sentiment ReturnsGood morning, traders!
Global stocks are trading near record highs, with Asian markets following Wall Street higher after soft U.S. jobs data eased expectations of a Fed interest-rate hike. The renewed risk-on sentiment is also supporting the crypto market, which remains in recovery mode.
The Crypto TOTAL market cap chart is now decisively breaking above its channel resistance line within an intraday five-wave bullish cycle. This is an encouraging technical development and suggests that a larg