IREN | DailyNASDAQ:IREN — Quan-Entangling Model
Quan-Analysis | Preset for the Projected Impulsive Extension Int (3) 📈
I've just refined the E-lines ➤ α, β, and λ of Ray 1 within Quan-Structure Δ, converting them to solid lines to better visualize the strength of the current support zone.
Respecting the T r
Compare with IREN Limited
Key facts today
IREN secured multiyear AI cloud contracts worth $2.8B and raised its year-end AI cloud annual run-rate revenue target to over $4.0B (up from $3.7B). 1
0.51 USD
56.31 M USD
321.12 M USD
308.08 M
Next report date
—
Report period
—
EPS estimate
—
Revenue estimate
—
Profile
Sector
Industry
Website
Headquarters
Sydney
Founded
2018
IPO date
Nov 17, 2021
ISIN
AU0000185993
FIGI
BBG010J28KQ2
Identifiers
ISIN AU0000185993
IREN Ltd. is a vertically integrated data center business powering the future of Bitcoin, AI and beyond with renewable energy. It is strategically located in renewable-rich, fiber-connected regions across the US and Canada. IREN’s large-scale, grid-connected facilities are purpose-built for the next generation of power-dense computing applications. The company was founded by Daniel Roberts and William Roberts on November 6, 2018, and is headquartered in Sydney, Australia.
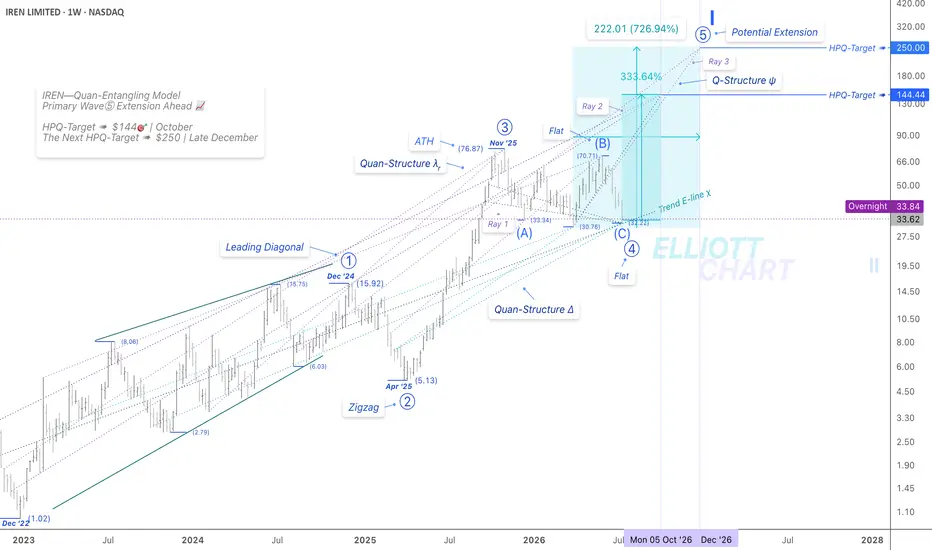
IREN | WeeklyNASDAQ:IREN — Quan-Entangling Model
Quan-Analysis | Projecting Primary Wave ⓹ Extension 📈
As illustrated on the weekly chart below, through the interaction between the support and resistance Rays of both Quan-Structures ➤ Δ and λᵣ, the Primary-degree correction in Wave ⓸ may have further developed
IREN Holders : Quick UpdatePrice has returned to a major support zone that previously held in Dec 2025 and Apr 2026. Both times we tapped this level, the chart saw strong follow‑through - roughly 80–100% upside within the following month.
That doesn’t guarantee the same outcome now, but the risk/reward is elevated at this ar
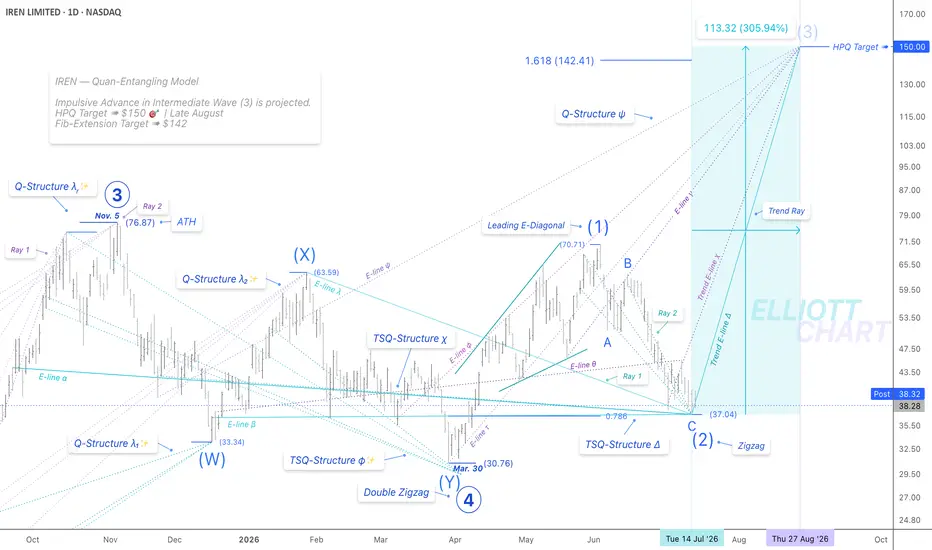
IREN | DailyNASDAQ:IREN — Quan-Entangling Model
Preset for the Projected Impulsive Extension 📈
Quan Analysis
Price is now established at $38, precisely on Trend E-line α (green solid line), interacting beneath the resistance E-line θ within the Transition-Support Quan-Structure χ, while aligning with refin
IREN Limited: Recent Developments and 6-Month OutlookOver the past several months, IREN Ltd. has continued its strategic transformation from being primarily a Bitcoin mining company into a broader AI infrastructure and digital infrastructure provider. While Bitcoin mining remains a major contributor to revenue and cash generation, management has incre
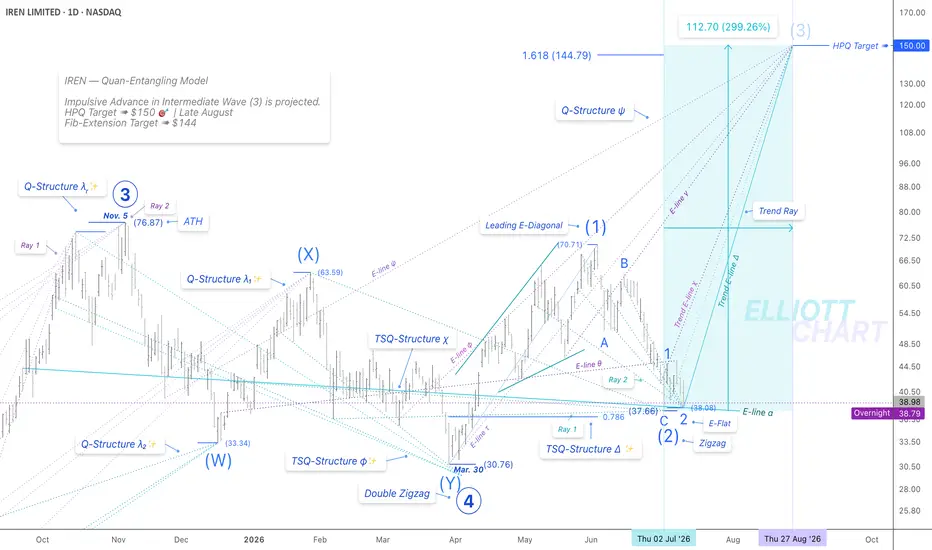
IREN | DailyNASDAQ:IREN — Quan-Entangling Model
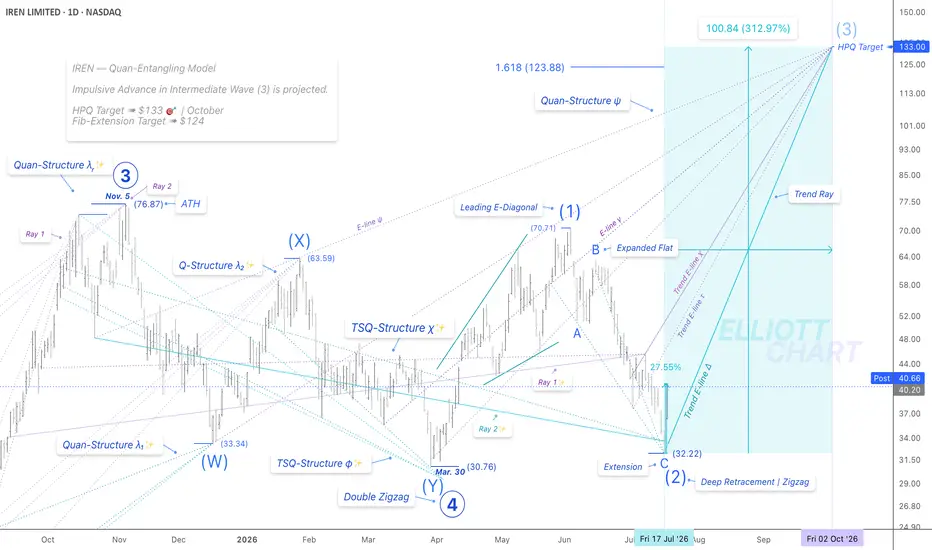
Quan-Analysis | Projecting an Impulsive Extension in Intermediate Wave (3) 📈
IREN rallied 27.55%, launching precisely from $ 32.22 ✨➤ identified as the extreme low of the Intermediate Wave (2) retracement, as projected.
Respecting the Entangled X Model of Qu
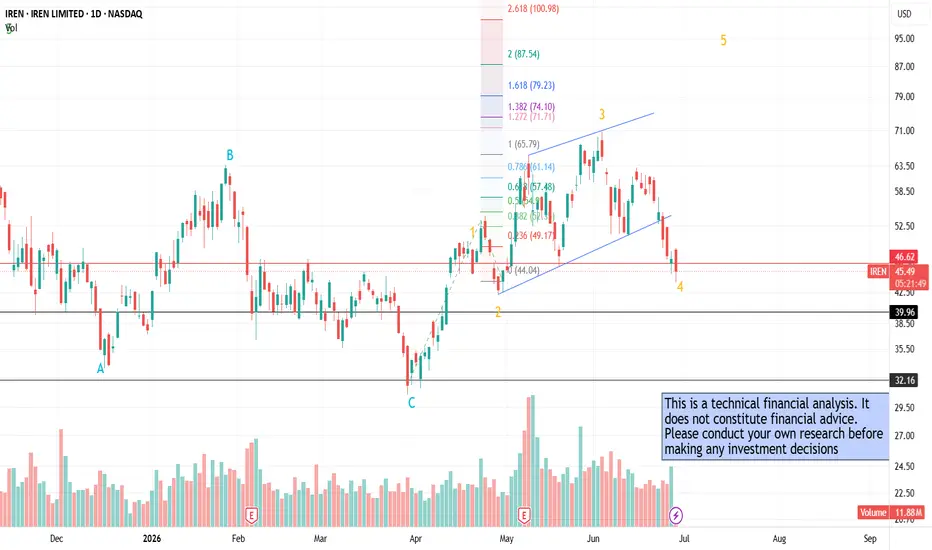
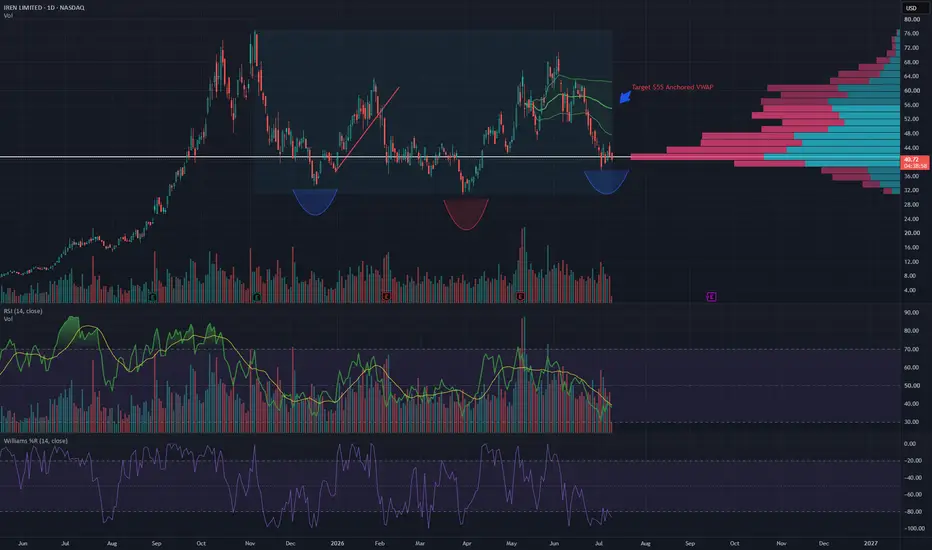
$IREN Inverted Head and ShoulderNASDAQ:IREN has an inverted head and shoulder pattern on the daily and has strong support at the volume shelf around the $40 area. RSI and William %R are starting to turn up showing bottoming in the stock. The Anchored VWAP from the large volume candles in May 2026 put a target price of $55 as seen
IREN | DailyNASDAQ:IREN — Quan-Entangling Model
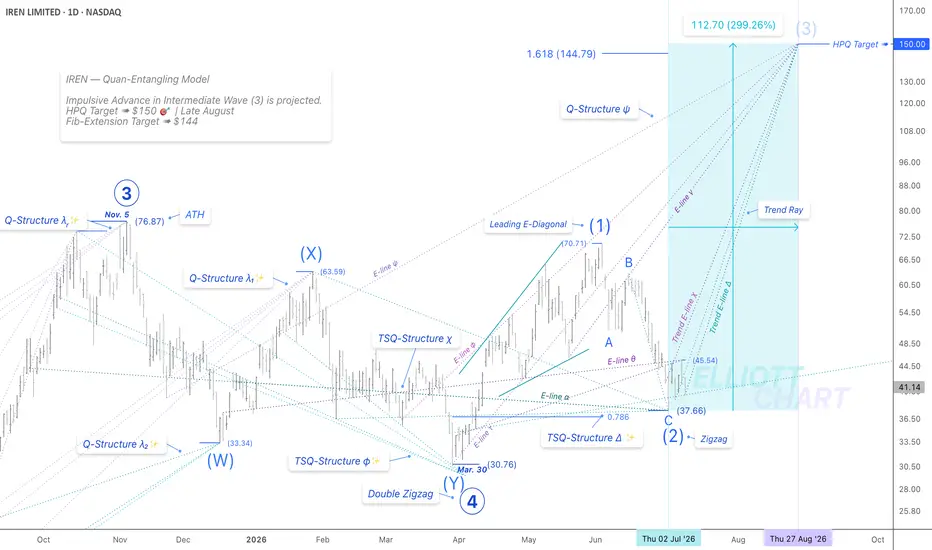
Quan-Analysis | Preset for the Projected Impulsive Extension 📈
From my analytical standpoint, IREN has shaped the origin of the Trend Ray this week by defining Trend E-lines ➤ Δ and χ, establishing the trend root through the interaction between Trend E-lines
IREN: Bulls vs Bears at a Critical Support ZoneIREN previously broke out of a falling wedge and rallied strongly to 71, falling just short of its all-time high near 77.
Unable to break into new highs, the stock formed a classic Head & Shoulders reversal pattern, triggering a breakdown with a measured downside target near 30.
However, the story
IREN | DailyNASDAQ:IREN — Quan-Entangling Model
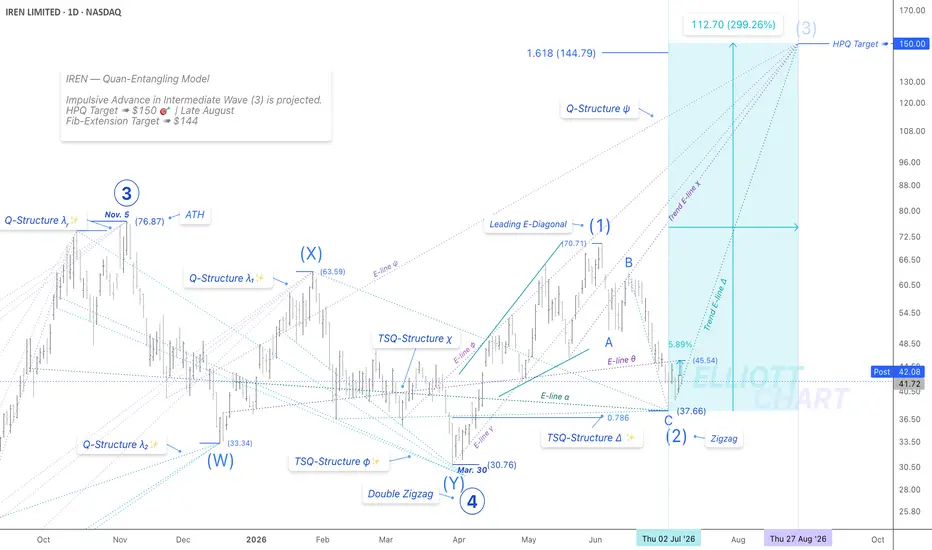
Stabilizing the Projected Uptrend | Impulsive Extension 📈
IREN rose +5.9% intraday, closing precisely on the Trend E-line Δ ✨—further defining the projected path of the impulsive Intermediate Wave (3) extension.
Quan-Analysis
The TS Quan-Structure Δ contin
See all ideas
Summarizing what the indicators are suggesting.
Neutral
SellBuy
Strong sellStrong buy
Strong sellSellNeutralBuyStrong buy
Neutral
SellBuy
Strong sellStrong buy
Strong sellSellNeutralBuyStrong buy
Neutral
SellBuy
Strong sellStrong buy
Strong sellSellNeutralBuyStrong buy
An aggregate view of professional's ratings.
Neutral
SellBuy
Strong sellStrong buy
Strong sellSellNeutralBuyStrong buy
Neutral
SellBuy
Strong sellStrong buy
Strong sellSellNeutralBuyStrong buy
Neutral
SellBuy
Strong sellStrong buy
Strong sellSellNeutralBuyStrong buy
Displays a symbol's price movements over previous years to identify recurring trends.
— YTM
Maturity dateJun 15, 2030
Coupon3.25% (Fixed)
— YTM
Maturity dateDec 15, 2029
Coupon3.50% (Fixed)
— YTM
Maturity dateJul 1, 2031
Coupon0% (Zero)
— YTM
Maturity dateDec 1, 2033
Coupon1.00% (Fixed)
See all IREN bonds
Weight0.09%
Market value52.63 M
Weight0.36%
Market value50.51 M
Weight0.36%
Market value50.51 M
Weight0.36%
Market value50.51 M
Weight0.38%
Market value32.66 M
Weight0.38%
Market value32.66 M
Weight8.07%
Market value31.42 M
Weight5.93%
Market value31.14 M
Weight1.18%
Market value29.32 M
Weight0.03%
Market value25.58 M
Weight2.55%
Market value24.92 M
Explore more ETFs
Frequently asked questions
The current price of IREN is 40.20 USD — it has increased by 17.92% in the past 24 hours. Watch IREN Limited stock price performance more closely on the chart.
Depending on the exchange, the stock ticker may vary. For instance, on NASDAQ exchange IREN Limited stocks are traded under the ticker IREN.
IREN stock has fallen by −1.72% compared to the previous week, the month change is a −35.30% fall, over the last year IREN Limited has showed a 117.65% increase.
We've gathered analysts' opinions on IREN Limited future price: according to them, IREN price has a max estimate of 126.00 USD and a min estimate of 46.00 USD. Watch IREN chart and read a more detailed IREN Limited stock forecast: see what analysts think of IREN Limited and suggest that you do with its stocks.
IREN reached its all-time high on Nov 5, 2025 with the price of 76.87 USD, and its all-time low was 1.02 USD and was reached on Dec 28, 2022. View more price dynamics on IREN chart.
See other stocks reaching their highest and lowest prices.
IREN stock is 20.59% volatile and has beta coefficient of 3.35. Track IREN Limited stock price on the chart and check out the list of the most volatile stocks — is IREN Limited there?
Today IREN Limited has the market capitalization of 12.43 B, it has decreased by −13.75% over the last week.
Yes, you can track IREN Limited financials in yearly and quarterly reports right on TradingView.
IREN Limited is going to release the next earnings report on Sep 16, 2026. Keep track of upcoming events with our Earnings Calendar.
IREN earnings for the last quarter are −0.74 USD per share, whereas the estimation was −0.22 USD resulting in a −238.79% surprise. The estimated earnings for the next quarter are −0.35 USD per share. See more details about IREN Limited earnings.
IREN Limited revenue for the last quarter amounts to 144.80 M USD, despite the estimated figure of 219.69 M USD. In the next quarter, revenue is expected to reach 152.55 M USD.
IREN net income for the last quarter is −172.21 M USD, while the quarter before that showed −102.02 M USD of net income which accounts for 0.00% change. Track more IREN Limited financial stats to get the full picture.
No, IREN doesn't pay any dividends to its shareholders. But don't worry, we've prepared a list of high-dividend stocks for you.
As of Jul 21, 2026, the company has 457 employees. See our rating of the largest employees — is IREN Limited on this list?
EBITDA measures a company's operating performance, its growth signifies an improvement in the efficiency of a company. IREN Limited EBITDA is 93.87 M USD, and current EBITDA margin is 41.15%. See more stats in IREN Limited financial statements.
Like other stocks, IREN shares are traded on stock exchanges, e.g. Nasdaq, Nyse, Euronext, and the easiest way to buy them is through an online stock broker. To do this, you need to open an account and follow a broker's procedures, then start trading. You can trade IREN Limited stock right from TradingView charts — choose your broker and connect to your account.
Investing in stocks requires a comprehensive research: you should carefully study all the available data, e.g. company's financials, related news, and its technical analysis. So IREN Limited technincal analysis shows the sell today, and its 1 week rating is neutral. Since market conditions are prone to changes, it's worth looking a bit further into the future — according to the 1 month rating IREN Limited stock shows the buy signal. See more of IREN Limited technicals for a more comprehensive analysis.
If you're still not sure, try looking for inspiration in our curated watchlists.