BRIAN XAUUSD – WEEKLY VOLUME PROFILE MAP: GOLD STILL UNDER SELLEBRIAN XAUUSD – WEEKLY VOLUME PROFILE MAP: GOLD STILL UNDER SELLER VALUE
Gold closed the week with a very important message:
The recovery attempts are still weak, and the higher-timeframe structure is still controlled by sellers.
Throughout the week, gold stayed trapped below the main recovery zones. Buyers tried to defend the lower value area around 4,110 - 4,180, but every recovery attempt failed to create strong acceptance above the short-term value range. This tells me the market is not in
Fibonacci Extension
NVDA: Bulls Test ResistanceNVIDIA is approaching its May highs after several months of consolidation. On the daily chart, the latest displayed price is $233.95, as of October 2, 2026.
The recent structure looks constructive. Since the September low, price has formed higher lows and reclaimed $227.76, giving buyers the short-term advantage.
The key resistance is $237.77, aligned with the 0.618 level of the Fibonacci drawing shown on the chart. A daily close above this level, followed by a successful hold or retest, would
NVDA | Weekly Structure | $236 Could Unlock the Final Wave 5Thesis:
NVDA is now testing one of the most important confluence areas on the weekly chart.
The zone between roughly $228 and $236 brings together several major technical levels, and a clean break above it would put the Bull Case firmly back in play.
Context
This is the same area I have been watching for several weeks.
NVDA has continued to push higher and is now trading directly below its all-time high, with the larger Wave 5 structure still intact.
What I see
- Previous all-time high
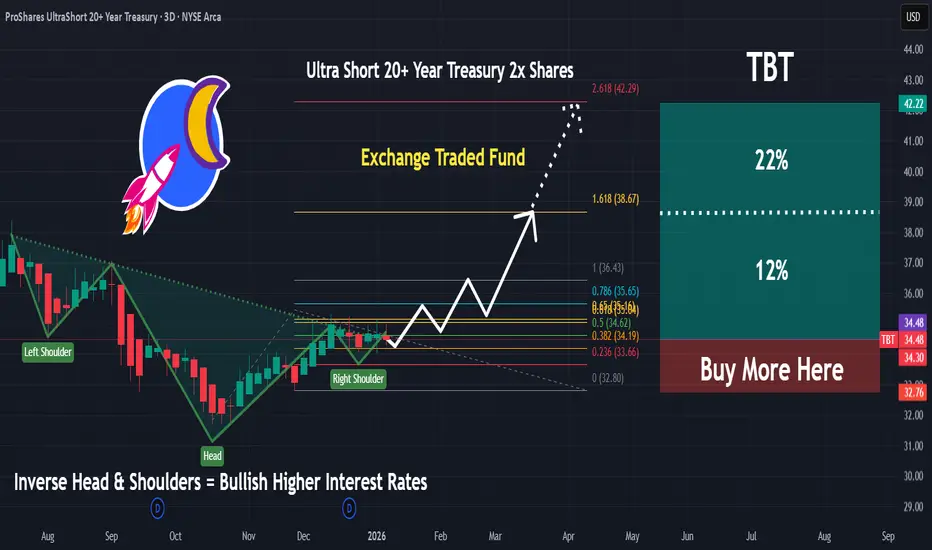
TBT | Expect Interests Rates To Surge | LONGProShares UltraShort 20+ Year Treasury seeks daily investment results, before fees and expenses, that correspond to two times the inverse (-2x) of the daily performance of the ICE U.S. Treasury 20+ Year Bond Index. The fund invests in financial instruments that ProShare Advisors believes, in combination, should produce daily returns consistent with the fund's investment objective. The index includes publicly-issued U.S. Treasury securities with minimum term to maturity greater than or equal to t
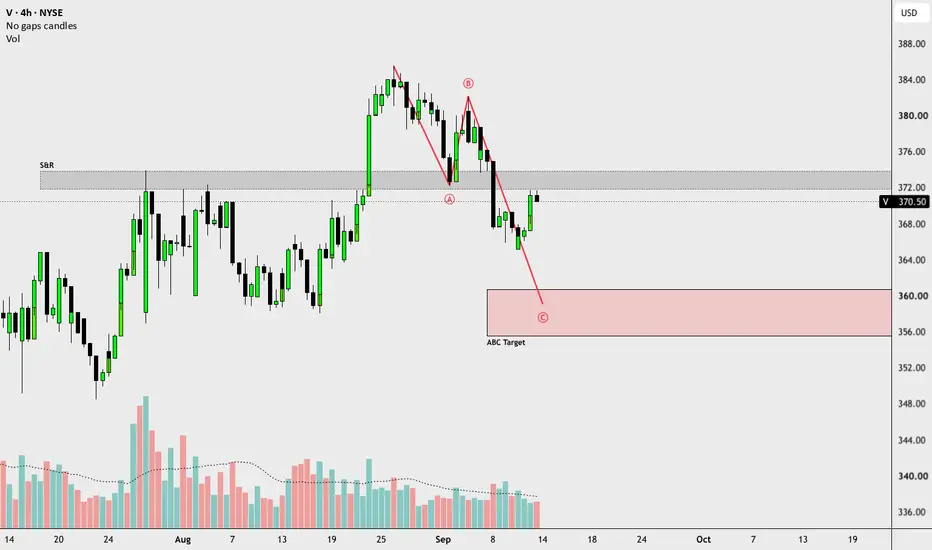
V: S&R Breakdown Clears the Path to Target CVisa Inc. ( NYSE:V ) has shifted into a clear corrective structure on the 4-hour timeframe following a rejection from the $385.00 highs. The impulsive breakdown below the key $372.00 – $374.50 support and resistance zone has decisively flipped previous structural support into immediate overhead supply, driving bearish momentum.
This breakdown confirmed the activation of an impulsive sequence, marked by the initial reaction low at Point A ($371.50) followed by a corrective lower high into Point
CaixaBank at AlltimeHigh Breakout level | CSE Option Decision OSCaixaBank is at AlltimeHigh Breakout level.
This stock made a huge leap within 1.5 ~ 2 years time.
Now, from this level, the thesis can breakout the alltime high and reach the new levels.
The Tactical Failure lies at € 10.50 and the Tactical Repair lies at € 10.70.
Macro support at 8.80
Soft Thesis Invalidation at 7.50
Hard Thesis invalidation 6.30
Find all about our unique model on CSE Option Decision OS.
Dell: on its way to $624?I’ve drawn a Fibonacci extension that points to a technical target around $624.25 , corresponding to the 0.382 Fibonacci extension level .
The bullish momentum remains intact, but the key question now is: should we keep riding the trend, or start locking in some profits?
As price approaches this target, I’ll be watching closely for the market’s reaction and any signs of weakening momentum.
At this stage, it’s important not to get too greedy: trees don’t grow to the sky.
⚠️ Disclaimer:
GOLD (XAUUSD) 4H: Bearish Market Structure & Key TargetsOn the 4-Hour timeframe, Gold (XAUUSD) has shown a clear market structure reversal following a rejection from the major higher-timeframe resistance supply zone around $4,700–$4,730.
After forming lower highs and lower lows, price action confirms strong bearish momentum breaking down toward major demand order blocks below.
Key Technical Highlights:
Major Resistance (Supply Zone): Heavy sell imbalance detected at $4,700–$4,730 (Order Block 97% Sell / 3% Buy).
Lower High Order Block: Secondar
GOLD: Wave (iv) Complete —Setting Up the Final Leg to $4,718–800Good afternoon traders,
Trust you are good.
Please find below my outlook of the Gold (XAUUSD) market.
Gold appears to be in a 5-wave bullish impulse from around 3,942.1 to 4,697.105, and it appears to be in wave 4 of the 5wave impulse. Therefore, the overall direction of Gold is bullish.
Structure: Wave (i)-(ii)-(iii)-(iv) is complete and valid — no rule violations. Wave (iv) low = 4,282.625. Currently basing/chopping (4,282–4,442) ahead of wave (v).
My Primary count : Wave (iv) is done — n
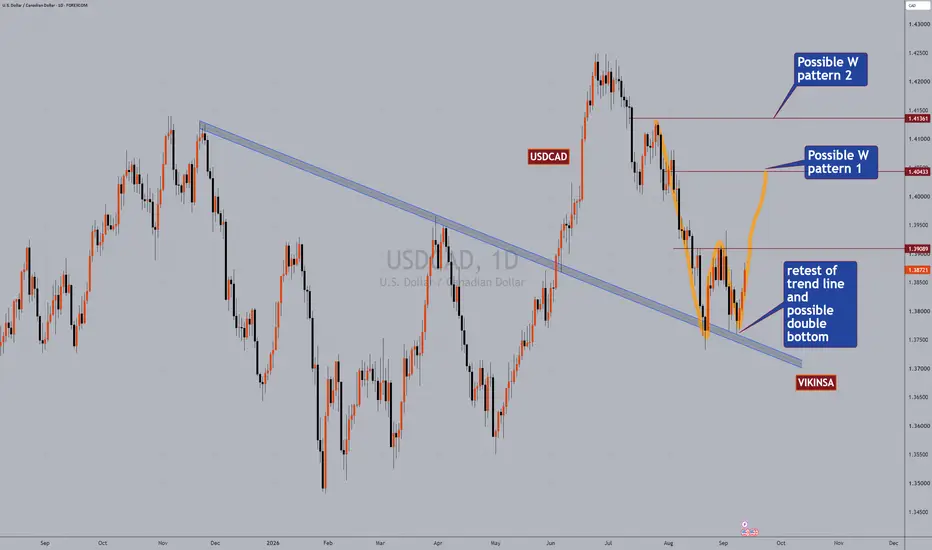
USDCAD Possible W pattern Formation and Double BottomUSDCAD Possible W pattern Formation and Double Bottom:
1. USDCAD has been bullish most of 2025/2026 and recently it has taken correction. (Weekly time frame) This was posted about in our last analysis
2. The correction has come back to retest a major trend line that was left over
3. Market created a double bottom on this trend line
4. If the market breaks and confirms above the mid point it can go bullish to form W pattern
5. Watch USOIL (WTI/Crude) with it.
MSFT: Elliott Wave roadmap and the 518 breakout testMSFT's next meaningful test is the 513.73–517.78 USD resistance band. A daily close above 517.78, followed by a successful retest, would strengthen the continuation case. Until that happens, the recovery remains an opportunity to watch rather than a confirmed new Cycle III.
This daily-chart analysis is dated 9 September 2026. The latest completed session, 8 September, closed at 493.95 USD; RSI(21) was 58.57. Prices and pivots use the displayed TradingView MSFT chart. Pre-market fluctuations are
NVDA: Elliott Wave roadmap — the $240 confirmation testNVIDIA is approaching a decision area, not an automatic buy signal. With the September 8 daily close at $225.73, the first question is whether price can establish acceptance above $236–240. The higher projections on this chart only become useful if that resistance is cleared and the breakout holds.
This daily roadmap begins on October 13, 2022 and uses regular-session data through September 8, 2026, checked before publication on September 9. Prices are in USD on the displayed TradingView feed,
TAO — Multi-Year Falling Wedge | Targets to $2kBittensor (TAO) is approaching a major decision point after spending years compressing inside a large descending/falling wedge structure.
On the high timeframe, TAO has continued to print lower highs while repeatedly defending the broader support region, causing price to contract toward the apex of the structure. This type of compression can become significant when price eventually resolves through the upper descending trendline.
The important point here is that the bullish thesis is condition
How Fibonacci ACTUALLY Works (And How Smart Money Uses It)A lot of traders draw Fibonacci retracements backwards, get confused by too many lines, or trade them blindly.
Fibonacci levels aren't magical lines where price magically bounces. In institution-driven markets, Fibonacci levels represent mathematical zones where Smart Money seeks liquidity and discount pricing.
Here is the exact breakdown of how to pair Fibonacci with SMC to locate high-probability trade entries:
📌 1. Finding Point A & Point B (The Swing Points)
Point A (The Anchor): Drawn f
XAUUSD: Bearish Matryoshka Sequence & BC ShortGold initiated a macro bearish sequence from the cycle peak down into Red (A), retracing to establish Red (B) before resuming downward order flow. Within the subsequent impulse, price formed an internal sub-cycle (Pink sequence) that cleanly fulfilled its micro ABC target around 4,400–4,600. The completion of this sub-sequence unlocked its Whole Correction Level (WCL), which converged directly with the macro Red BC correction zone to print a major confluence rejection at Black Point (B).
Follow
NFLX | Weekly Structure | Waiting for the Wave 2 PullbackThesis:
NASDAQ:NFLX is beginning to show what could be an important trend change after a long correction.
Price has already bounced from around $64 to $83.50 since the middle of July. That is a strong first move and, in my view, enough to potentially complete Wave 1 even though I was initially looking for a move toward the 200 Day MA around $88.
After such a move, a Wave 2 pullback would be completely normal and is now what I would prefer to see before building a position.
Current Structu
APP | Weekly Structure | ABC Correction Holding the 0.618 FibThesis:
NASDAQ:APP has completed what I see as an almost textbook ABC correction, retracing directly into the 0.618 Fib at $291.
Price has now held this area for four consecutive weeks while the 200 WMA continues to rise toward the same level. The stock has also recently been moving independently from the broader US market, which makes the current structure particularly interesting to me.
Technical Setup:
- ABC correction completed into the 0.618 Fib at $291
- $291 has now held as support
NVO | Weekly Structure | $48 Could Unlock the Bull CaseThesis:
NVO has spent more than a month compressing inside my $44-$48 accumulation zone, around several important long-term technical levels. I believe this consolidation is becoming increasingly constructive. If $48 can break and then flip to support, I would consider the Bull Case active and expect the next impulsive move higher to begin.
Context
- Weekly timeframe
- This is an update to my long-term NVO cycle analysis published earlier this year
- Price has been oscillating around the $44
MSFT – CSE Identified 513 And 558 Already In May 2026 | CSE CapiMicrosoft is becoming a strong proof case for the CSE Capital — Option Decision OS, also known as the Continuation Swing Engine.
In May 2026, our CSE model had already mapped the key upside path for MSFT. At that time, the analysis highlighted the major continuation zones around 513 and 558 as the next important target areas. That was not a random price guess. It came from the system’s hybrid Fibonacci structure, macro trend alignment and predefined decision layers.
Today, that earlier roadmap
BTC | Weekly Structure | $83K Is the Wave 3 TriggerThesis:
BTC appears to be in the final stage of a larger Wave 2 correction after finding support around the 200-week MA. The structure is improving, but the key confirmation is still ahead. I want to see the $81,000-83,000 area and the 50-week MA reclaimed and flipped to support before treating Wave 3 as confirmed.
Context
- Weekly timeframe
- BTC completed a five-wave advance before entering a clear ABC correction
- Wave C pushed price back toward the 200-week MA before buyers stepped in
-
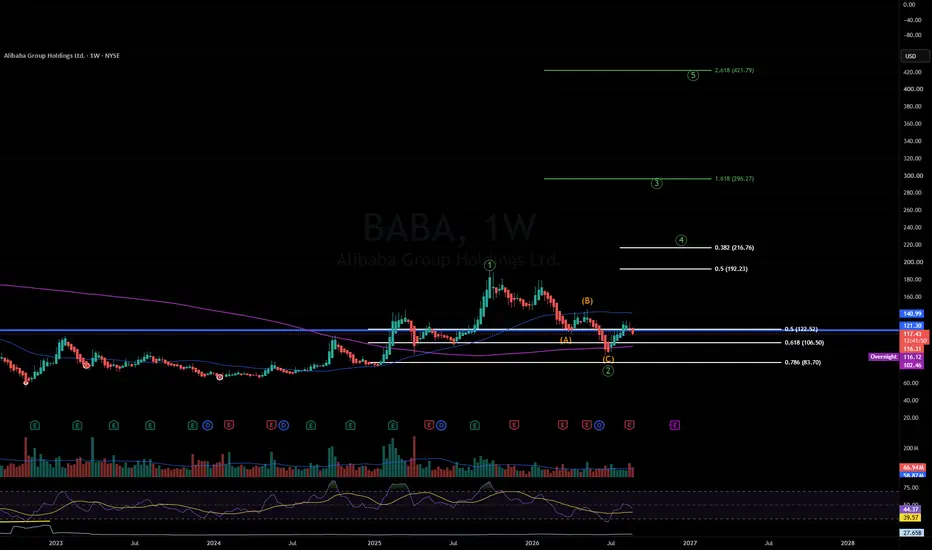
BABA | Weekly Structure | Wave 2 Add Zone DevelopingThesis:
BABA has delivered a clean five-wave move higher followed by a three-wave ABC correction. This is exactly the type of Wave 2 structure where I am most comfortable adding to a long-term position.
Context
- Weekly timeframe
- Five-wave impulsive move completed around $180
- Three-wave ABC pullback followed
- Price briefly moved back below the 200-week MA during the correction
- Our current average is approximately $111
- We added at $94 in June when price was trading below the 200-week
EQNR | The Lemonade (Energy) Stand Funding the Future | LONGImagine owning a wildly successful lemonade stand. But you notice a trend: in a few years, everyone is going to want fruit smoothies.
What do you do? You keep selling lemonade to everyone who wants it today, but you use that cash to quietly build the biggest smoothie factory in town. By the time the neighborhood switches, you’re already the boss.
That is exactly what Equinor (EQNR) is doing right now.
The Fundamental Setup:
Equinor is currently a massive supplier of traditional oil and gas to
XAUUSD — 4,550 Holds, 4,945 Opens?
Gold is now trading inside a strong bullish recovery channel after breaking away from the old bearish structure.
The market has already shifted from accumulation into expansion, and price is now holding around 4,600.
The trend is clearly bullish.
But after a strong move, the best plan is still not to chase the candle.
The simple read
Gold is currently moving above the buy trendline area.
As long as price holds above the 4,535 - 4,550 support zone, buyers still have control.
The next imp
XAUUSD — 4,500 Is the Gate to 4,650?
Gold is showing a strong bullish structure after breaking above the previous resistance zone.
The market pushed sharply from the lower support area and is now trading around 4,480 - 4,500, right under the short-term breakout line.
This is where the chart becomes very interesting.
The trend is bullish.
But after a strong move, I still do not want to chase the candle.
I want to see if buyers can defend the new structure.
The simple read
4,500 is the first important gate today.
If gold br