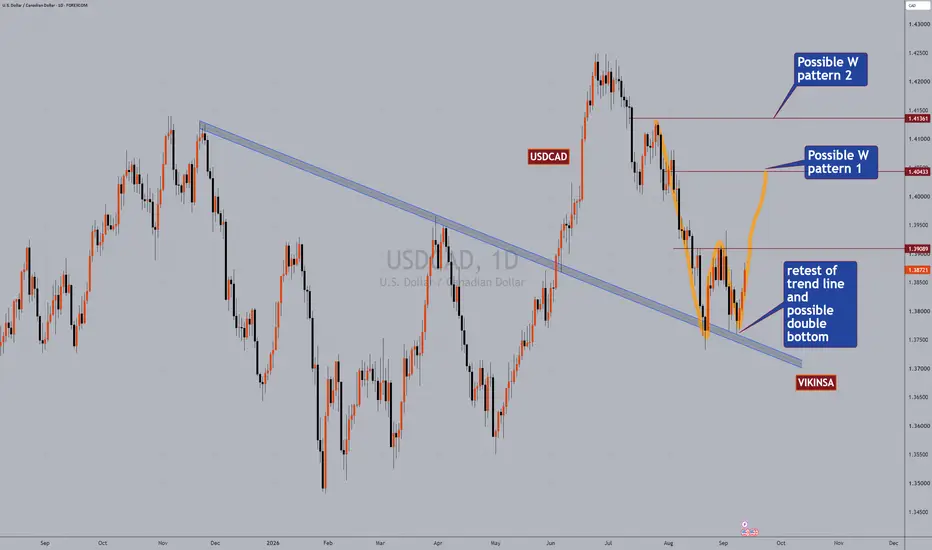
USDCAD Possible W pattern Formation and Double BottomUSDCAD Possible W pattern Formation and Double Bottom:
1. USDCAD has been bullish most of 2025/2026 and recently it has taken correction. (Weekly time frame) This was posted about in our last analysis
2. The correction has come back to retest a major trend line that was left over
3. Market created a double bottom on this trend line
4. If the market breaks and confirms above the mid point it can go bullish to form W pattern
5. Watch USOIL (WTI/Crude) with it.
Fibonacci Extension
MSFT: Elliott Wave roadmap and the 518 breakout testMSFT's next meaningful test is the 513.73–517.78 USD resistance band. A daily close above 517.78, followed by a successful retest, would strengthen the continuation case. Until that happens, the recovery remains an opportunity to watch rather than a confirmed new Cycle III.
This daily-chart analysis is dated 9 September 2026. The latest completed session, 8 September, closed at 493.95 USD; RSI(21) was 58.57. Prices and pivots use the displayed TradingView MSFT chart. Pre-market fluctuations are
NVDA: Elliott Wave roadmap — the $240 confirmation testNVIDIA is approaching a decision area, not an automatic buy signal. With the September 8 daily close at $225.73, the first question is whether price can establish acceptance above $236–240. The higher projections on this chart only become useful if that resistance is cleared and the breakout holds.
This daily roadmap begins on October 13, 2022 and uses regular-session data through September 8, 2026, checked before publication on September 9. Prices are in USD on the displayed TradingView feed,
TAO — Multi-Year Falling Wedge | Targets to $2kBittensor (TAO) is approaching a major decision point after spending years compressing inside a large descending/falling wedge structure.
On the high timeframe, TAO has continued to print lower highs while repeatedly defending the broader support region, causing price to contract toward the apex of the structure. This type of compression can become significant when price eventually resolves through the upper descending trendline.
The important point here is that the bullish thesis is condition
How Fibonacci ACTUALLY Works (And How Smart Money Uses It)A lot of traders draw Fibonacci retracements backwards, get confused by too many lines, or trade them blindly.
Fibonacci levels aren't magical lines where price magically bounces. In institution-driven markets, Fibonacci levels represent mathematical zones where Smart Money seeks liquidity and discount pricing.
Here is the exact breakdown of how to pair Fibonacci with SMC to locate high-probability trade entries:
📌 1. Finding Point A & Point B (The Swing Points)
Point A (The Anchor): Drawn f
XAUUSD: Bearish Matryoshka Sequence & BC ShortGold initiated a macro bearish sequence from the cycle peak down into Red (A), retracing to establish Red (B) before resuming downward order flow. Within the subsequent impulse, price formed an internal sub-cycle (Pink sequence) that cleanly fulfilled its micro ABC target around 4,400–4,600. The completion of this sub-sequence unlocked its Whole Correction Level (WCL), which converged directly with the macro Red BC correction zone to print a major confluence rejection at Black Point (B).
Follow
NFLX | Weekly Structure | Waiting for the Wave 2 PullbackThesis:
NASDAQ:NFLX is beginning to show what could be an important trend change after a long correction.
Price has already bounced from around $64 to $83.50 since the middle of July. That is a strong first move and, in my view, enough to potentially complete Wave 1 even though I was initially looking for a move toward the 200 Day MA around $88.
After such a move, a Wave 2 pullback would be completely normal and is now what I would prefer to see before building a position.
Current Structu
APP | Weekly Structure | ABC Correction Holding the 0.618 FibThesis:
NASDAQ:APP has completed what I see as an almost textbook ABC correction, retracing directly into the 0.618 Fib at $291.
Price has now held this area for four consecutive weeks while the 200 WMA continues to rise toward the same level. The stock has also recently been moving independently from the broader US market, which makes the current structure particularly interesting to me.
Technical Setup:
- ABC correction completed into the 0.618 Fib at $291
- $291 has now held as support
NVO | Weekly Structure | $48 Could Unlock the Bull CaseThesis:
NVO has spent more than a month compressing inside my $44-$48 accumulation zone, around several important long-term technical levels. I believe this consolidation is becoming increasingly constructive. If $48 can break and then flip to support, I would consider the Bull Case active and expect the next impulsive move higher to begin.
Context
- Weekly timeframe
- This is an update to my long-term NVO cycle analysis published earlier this year
- Price has been oscillating around the $44
MSFT – CSE Identified 513 And 558 Already In May 2026 | CSE CapiMicrosoft is becoming a strong proof case for the CSE Capital — Option Decision OS, also known as the Continuation Swing Engine.
In May 2026, our CSE model had already mapped the key upside path for MSFT. At that time, the analysis highlighted the major continuation zones around 513 and 558 as the next important target areas. That was not a random price guess. It came from the system’s hybrid Fibonacci structure, macro trend alignment and predefined decision layers.
Today, that earlier roadmap
BTC | Weekly Structure | $83K Is the Wave 3 TriggerThesis:
BTC appears to be in the final stage of a larger Wave 2 correction after finding support around the 200-week MA. The structure is improving, but the key confirmation is still ahead. I want to see the $81,000-83,000 area and the 50-week MA reclaimed and flipped to support before treating Wave 3 as confirmed.
Context
- Weekly timeframe
- BTC completed a five-wave advance before entering a clear ABC correction
- Wave C pushed price back toward the 200-week MA before buyers stepped in
-
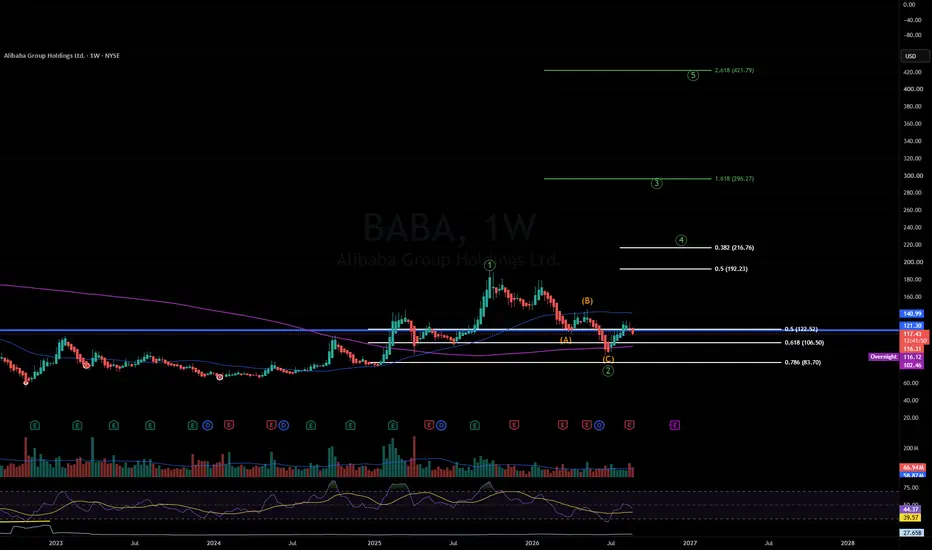
BABA | Weekly Structure | Wave 2 Add Zone DevelopingThesis:
BABA has delivered a clean five-wave move higher followed by a three-wave ABC correction. This is exactly the type of Wave 2 structure where I am most comfortable adding to a long-term position.
Context
- Weekly timeframe
- Five-wave impulsive move completed around $180
- Three-wave ABC pullback followed
- Price briefly moved back below the 200-week MA during the correction
- Our current average is approximately $111
- We added at $94 in June when price was trading below the 200-week
EQNR | The Lemonade (Energy) Stand Funding the Future | LONGImagine owning a wildly successful lemonade stand. But you notice a trend: in a few years, everyone is going to want fruit smoothies.
What do you do? You keep selling lemonade to everyone who wants it today, but you use that cash to quietly build the biggest smoothie factory in town. By the time the neighborhood switches, you’re already the boss.
That is exactly what Equinor (EQNR) is doing right now.
The Fundamental Setup:
Equinor is currently a massive supplier of traditional oil and gas to
XAUUSD — 4,550 Holds, 4,945 Opens?
Gold is now trading inside a strong bullish recovery channel after breaking away from the old bearish structure.
The market has already shifted from accumulation into expansion, and price is now holding around 4,600.
The trend is clearly bullish.
But after a strong move, the best plan is still not to chase the candle.
The simple read
Gold is currently moving above the buy trendline area.
As long as price holds above the 4,535 - 4,550 support zone, buyers still have control.
The next imp
XAUUSD — 4,500 Is the Gate to 4,650?
Gold is showing a strong bullish structure after breaking above the previous resistance zone.
The market pushed sharply from the lower support area and is now trading around 4,480 - 4,500, right under the short-term breakout line.
This is where the chart becomes very interesting.
The trend is bullish.
But after a strong move, I still do not want to chase the candle.
I want to see if buyers can defend the new structure.
The simple read
4,500 is the first important gate today.
If gold br
National Industrialization (2060) : Resistance Ahed !!TADAWUL:2060
🚀 10 SAR: The Breakout Level That Could Unlock 12 → 15 → 20
The stock is approaching a critical breakout zone around 10 SAR.
A decisive breakout and sustained move above 10 could signal a shift in momentum and open the path toward the next resistance and profit-taking levels:
🎯 12 → 15 → 20
🔥 Longer-Term Fibonacci Targets
If the bullish structure remains intact and momentum continues to expand, the Fibonacci extension levels point toward potentially larger objectives:
🚀 27
SPCX: Bearish Sequence Unfolding Toward Downside Target CFollowing the completion of the prior bullish sequence into the overhead target zone near 150.00, NASDAQ:SPCX has shifted market structure to begin a corrective phase. Price action has formed a clear bearish sequence from the highs, defining an initial impulse into Point A followed by a corrective bounce to Point B.
The aggressive breakdown from the upper consolidation confirms active continuation toward the bearish Point C target. This projected target box sits between 125.50 and 129.00, rep
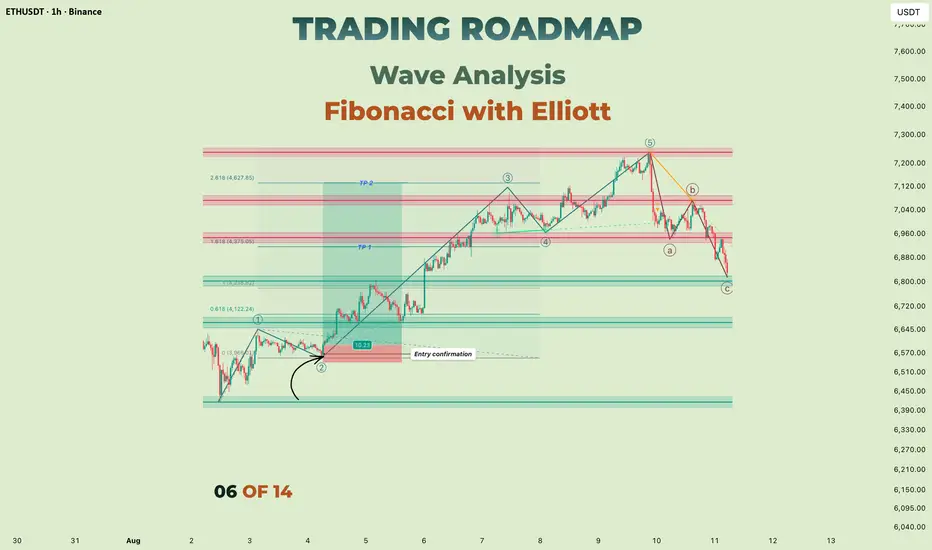
Trading Roadmap| Wave Analysis·Lesson 06— Fibonacci with ElliottLesson 6 - Fibonacci with Elliott
Difficulty: (Intermediate)
Wave counting tells you where you are in the structure. Fibonacci tells you how far the next leg might travel. On their own, each one leaves a gap — a count with no measurement, or a set of levels with no context. Used together, they answer two different questions at the same time.
A completed five-wave advance followed by an A-B-C correction. Before any measurement is added, the count has to survive the rules from Lesson
Ash-Sharqiyah Development : Bulls AliveTADAWUL:6060
🚀 13.4–13.8: Critical Retest Zone — Bulls Still Have a Chance
The stock is now sitting on a key technical confluence zone between 13.40–13.80.
This area combines two important signals:
📌 0.618 Fibonacci retracement support
📌 Trendline breakout–retest confirmation
As long as price sustains this zone, the bullish structure remains alive and buyers have a chance to push the stock toward:
🎯 17.00
🎯 19.44
🎯 22.00
📊 Key Levels
🛡️ 13.40–13.80: Critical support & breakout-retest z
Al Munajem Foods : Slow & SteadyTADAWUL:4162
📈 Slow & Steady Climb Toward a Weekly Breakout — Is the Next Major Rally Approaching? 🇸🇦
The weekly chart continues to paint a constructive bullish picture, with price steadily advancing toward a major breakout zone. Unlike explosive rallies, this gradual ascent reflects healthy accumulation, often laying the groundwork for a stronger and more sustainable uptrend.
The key now is confirmation above resistance.
🔍 Technical Outlook
The 67 price level is the most important resist
Price Confirms Further Extension After Reversal Pattern FormsOANDA:EURUSD on the Daily chart is getting ready to complete a favorable Confirmation Candlestick Pattern called the Three Inside Up at the 1 Fibonacci Extension Level and could be eyeing to head further!
- Last week ended with a Breakout of Previous Highs on Thursday, followed by an abrupt Retest on Friday.
- This week started with price making a decline back to the 1 Fibonacci Extension Level but found Support through Tuesday to where we can see price now is attempting another Breakout of
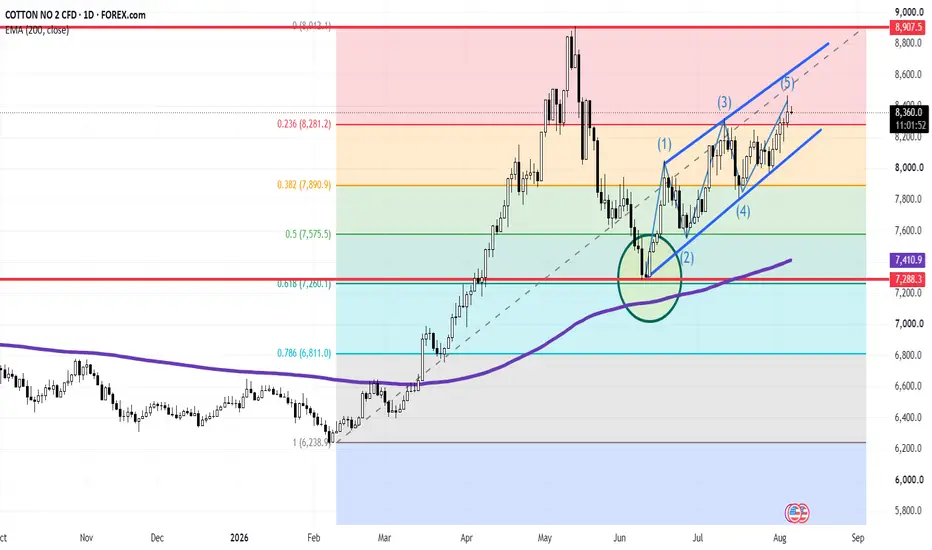
Cotton No. 2 ($COTTON) Daily: 5-Wave ElliottCotton No. 2 ( PEPPERSTONE:COTTON ) Daily: 5-Wave Elliott Impulse Advances Towards 8,907 Macro Ceiling Following 0.618 Fibo Rebound
### 🌾 Cotton No. 2 CFD ( PEPPERSTONE:COTTON ) Daily Technical Matrix (Ref: COTTON_2026-08-06_08-56-13.png)
We are releasing a Daily (1D) Elliott Wave structural framework on Cotton No. 2 ( PEPPERSTONE:COTTON ). Following a clean technical reaction off key multi-confluence support inside the highlighted green circle, price action has been executing a textbook 5-wave
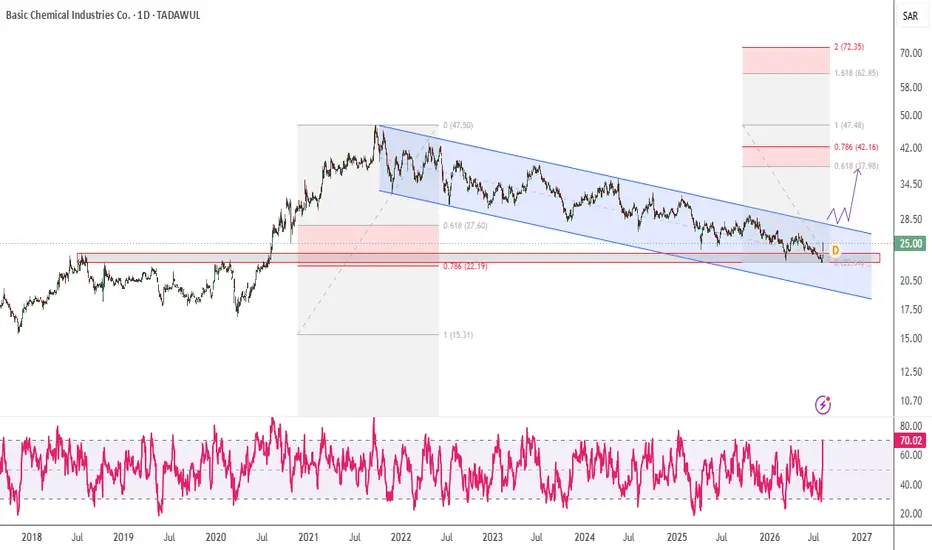
Basic Chemical : Triple Confluence for Upside !TADAWUL:1210
📈 Descending Channel Meets Triple Confluence — Is a Bullish Reversal Brewing? 🇸🇦
The stock continues to trade within a well-defined descending parallel channel, but several technical signals suggest that selling pressure may be fading and a reversal could be taking shape.
With multiple bullish confluences aligning, this is a setup worth keeping on your watchlist.
🔍 Why This Setup Stands Out
📌 1. Descending Parallel Channel
Price remains confined within a descending channel, w
AMZN – Repair Trigger Reclaimed, Add Watch Eligible | CSE OptionAmazon is currently one of the strongest live continuation cases inside my CSE Capital — Option Decision OS, also known as the Continuation Swing Engine.
The current CSE read is very clear: the underlying thesis is intact, the trend is bullish, and the tactical repair trigger has been reclaimed. This is an important shift, because AMZN is no longer in a “wait for repair” state. The stock has already moved above the key repair area and is now trading above the main CSE entry zones.
At the time