GOLD-XAUUSD | (4H) | Swing Analysis | Prof.TraderTilkiGuys, greetings,
This is my XAUUSD-Gold swing analysis — a long-term outlook. 📊
On the 4-hour chart, gold has been stuck between 4227 and 4063 for about 20 days.
I’ve been waiting for this breakout, which means a sharp move is coming.
In my view, it could break downwards, but nothing is certain. Only whales and big funds know the real direction, since they drive the market.
If 4063 breaks down with a candle close, I expect a drop toward 3950 on the 4-hour chart.
But if whales push
Fibonacci Retracement
CNERGY – Is a Bigger Bullish Move Ahead?📊 **CNERGY – Is a Bigger Bullish Move Ahead? 🚀**
**CMP: Rs. 13.82 | 30 October 2026 (12:20 PM)**
CNERGY is showing a potential **Bullish Flag Pattern**, with an estimated pattern target around **Rs. 21–22**.
However, the journey towards this target requires some important technical confirmations.
🔍 **Key Levels to Watch**
🚧 **Resistance Zones:**
- Rs. 14.30–14.50 – Immediate resistance.
- Rs. 15.80–16.00 – Major breakout zone.
A decisive breakout above Rs. 15.80–16.00, supported by strong
BITCOIN - Aggressive behavior of bulls in the 80000BINANCE:BTCUSDT.P during the Asian session is forming a local distribution toward support and testing the key liquidity zone. The bulls continue their aggressive play in the 80,000 zone.
Fundamentally, the market is waiting for a driver, but at the same time, within the counter-trend correction, it still looks confident, holding in the 79K–80K zone (the key level formed during the previous bearish cycle). Bitcoin is consolidating in the key support zone, and the bulls’ fight for control of
AMZN – Long-Term Uptrend Retest SetupAMZN remains in a long-term uptrend.
* Looking at the daily chart over the past two years, we can clearly identify a relatively strong ascending support trendline. More importantly, AMZN's major corrective waves during this period have consistently interacted with either this long-term uptrend support or the 200-day moving average (MA200).
This suggests that despite several significant corrections, the long-term bullish structure has remained intact.
* There is another important historical pat
#RESOLVUSDT #3D (Binance) Symmetrical triangle breakout [LONG]Vault Street (f.k.a. Resolv) regained 20EMA support printing an inverted hammer.
Now pulling back to Fib retracement 0.618, recovery seems around the corner.
⚡️⚡️ #RESOLV/USDT ⚡️⚡️
Exchanges: Binance Futures, Bitget Futures
Signal Type: Regular (LONG)
Leverage: Isolated (3.0X)
Amount: 4.8%
Entry Targets:
1) 0.01734 - 100.0%
Take-Profit Targets:
1) 0.03157 - 50.0%
2) 0.04408 - 50.0%
Stop Targets:
1) 0.01491 - 100.0%
Trailing Configuration:
Stop: Breakeven -
Trigger: Target (1)
Published By
Bitcoin Breaks Out Ahead of the FOMC — Is a Bull Trap Coming?Bitcoin recovered from around $79,000 toward $81,000 ahead of one of the most important macro events of the week.
Markets largely expect the Federal Reserve to keep rates unchanged, meaning the bigger catalyst may be Kevin Warsh’s tone on a possible December rate hike.
Can Bitcoin survive a hawkish Fed message, or will today’s volatility push BTC back below $80,000?
Macro Outlook
Today’s Federal Reserve decision, FOMC statement, and Warsh’s press conference could trigger significant volatil
GOLD - Bear Market. A Correction Before the Drop IC:XAUUSD tests the area of interest at 4070 and comes under a wave of selling during the Asian session, maintaining the bearish trend. The fundamental and technical backdrop is not on the metal's side...
The dollar remains in a bullish trend, and oil remains strong. The fundamental backdrop is weak. These factors are putting pressure on gold, which is already unattractive to investors. Gold remains under pressure ahead of the Fed decision. Warsh's rhetoric is of key importance. A hawkish
AUDNZD: Bearish Sequence ActivatedOANDA:AUDNZD completed its bullish expansion directly into the overhead target zone, meeting immediate rejection at the swing highs. This structural terminus marked clear buyer exhaustion, stalling upward momentum and shifting local order flow. The failure to sustain new highs marks the completion of the impulse and opens the path for a corrective cycle.
Sellers quickly carved an initial impulse low at Point A, followed by a corrective retracement into Point B within the internal BC correction
SKYUSDT: Final Shakeout Before a Major Rally?Yello Paradisers! Are you prepared for a potential explosive #SKY reversal, or will the current bearish pressure shake you out right before the next major bullish move begins?
💎#SKY is approaching a critical decision point on the 4-hour timeframe, and the current price structure suggests that the recent correction could be setting the stage for another significant bullish impulse.
💎After an impressive rally toward the $0.10 region, #SKY experienced a sharp rejection and entered a corrective ph
XAUUSD: Is Gold's Next Rebound a Bull Trap?
Gold is recovering from the 3,975 region, but the larger bearish structure remains intact. Could the next advance simply become another lower-high trap before sellers regain control?
Market Structure — The Bears Still Have the Advantage
Following repeated failures near the October highs, XAUUSD developed a sequence of lower highs and lower lows.
The descending trendline continues to limit bullish recovery attempts, while the breakdown below former support near 4,080 reinforced selling pressu
BITCOIN - Correction... A long squeeze will be the trigger BINANCE:BTCUSDT.P continues its correction within a bullish trend. The bulls are trying to hold in the 80K zone, which only increases the chances of a long squeeze before growth.
BTC is resisting the decline; so far, the liquidity zone is being tested. Selling and profit-taking in BTC have intensified. Demand in spot BTC ETFs has not recovered sufficiently. The volume of "leverage" in the market has not decreased as the price fell. Nevertheless, capital continues to flow into "fresh hands.
BTCUSD #4: Long While the Reclaimed Support Zone HoldsBitcoin may have begun a new uptrend from the mid-2026 low. I view the yellow area as a reclaimed support zone that can provide a base for this recovery. My bias remains Long as long as the zone holds.
In the third idea, the focus was daily closes above the 0.236 Fibonacci line at 81,581. The chart now shows bitcoin near 79,900, below that level, leaving room for a corrective pullback.
67,500 marks the upper edge of the support zone. A move below it would bring price back into the area, where
GOLD - A countertrend correction before a drop to 3,900IC:XAUUSD , after a strong decline last week, has moved into a consolidation phase below 4050. Focus on the key range of 4034–3975. The fundamental backdrop, like the technical one, remains negative.
Gold remains under pressure from negative factors: expensive oil, a strong dollar, the Fed’s hawkish stance, and geopolitics. The metal remains unattractive to investors. The key event is the Fed meeting on Wednesday. If the rhetoric turns out to be hawkish, the metal may test $3,950. For a su
Bitcoin is facing the fall to test Major supports The recent -3% dump on lower timeframes appears insignificant on the daily chart, but it may be an early signal of a larger move developing on higher timeframes. Fibonacci retracement levels show the first support near 77K$, which is still far from the current price of 81K$. If price reaches that zone, a breakout and further decline toward the major Fibonacci supports at 0.5 and 0.618 is expected. The market is then anticipated to turn bullish again after holding the support zone near 70K$ only.
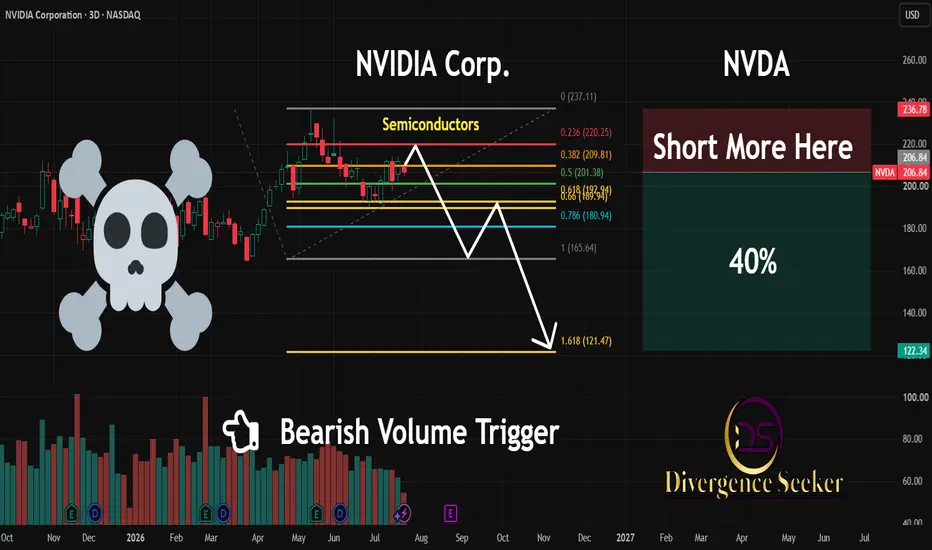
NVDA | Why the Rocket is Running Out of Fuel | SHORTNVIDIA (NVDA) stock has been going up like a rocket.
But today, I’m looking at the warning signs that it might take a big 40% drop.
If you are trying to explain to your family why everyone is so nervous about this computer chip company, and why it could actually hurt their retirement savings—here is what is going on in plain English.
1. The Rubber Band is Stretched Too Far
In stock charting, we use mathematical lines (called a Fibonacci channel) to find the "ceiling" and "floor" of a stock's
BTCUSD: Bullish Reversal Setup and Key Liquidity Targets.
Bitcoin is currently trading around $81,585 on the 4-hour timeframe, following a sharp rejection from the $84,500 region. Price is now consolidating near a potential support area, where the chart highlights a possible bullish reversal scenario. The key focus is whether buyers can defend the current region, regain short-term momentum, and push price toward the overhead Fair Value Gaps (FVGs), resistance zones, and buy-side liquidity.
1. Market Structure & Bullish Reversal
BTCUSD previously tra
XAUUSD: Wave C Ending at 3,945 or Extending Lower?
Gold has extended its bearish decline, breaking through former support and pushing deeper into a descending channel. But what if the next selloff represents the final stage of an Elliott Wave correction rather than the beginning of another major bearish cycle?
Elliott Wave — Is the Final Leg Developing?
XAUUSD continues to display a bearish sequence, with successive lower highs and renewed downward pressure.
One possible interpretation is that the market is developing the final leg of a bear
SOLUSDT - Countertrend correction to 100.0BINANCE:SOLUSDT.P is testing the support of the local flat formed within the global trading range of 95.0–125.0. A long squeeze of the key liquidity zone could restore the bullish impulse.
Technically, Bitcoin continues to consolidate above the 50-day moving average and above 80K — the key support zone. Against the backdrop of Bitcoin, SOLANA looks quite promising.
The correction associated with the difficult fundamental backdrop continues. Within the local decline, SOLANA may test the liq
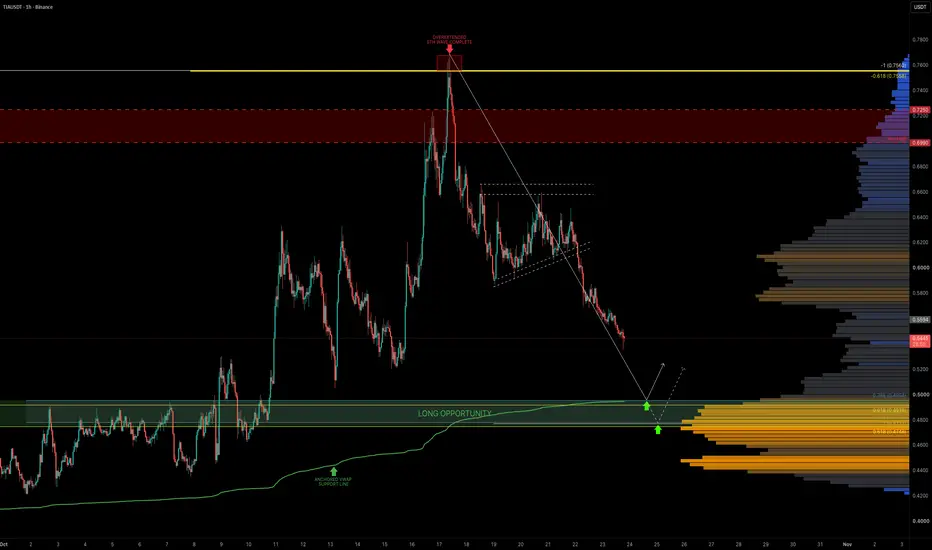
TIA — Let It DipTIA perfectly hit the -0.618 fib extension at $0.75, completing the 5th wave before getting hit with a sharp sell-off. Since then, we've been in a clear downtrend.
Now I'm watching the $0.5-0.47 zone for the next long entry. We've got some solid confluence stacking up here, with AVWAP, multiple EMAs/SMAs and fib levels all lining up nicely. On top of that, there's liquidity sitting in this zone too.
Plenty of reasons to keep this area on the radar, Now lets see how price reacts when we get t
XAUUSD: Wave C Ending at 4,067 or Breaking Lower?
Gold is approaching a critical structural boundary after extending its bearish decline. But what if the next test of support marks the final stage of an Elliott Wave correction rather than the beginning of another major selloff?
Elliott Wave — Is the Correction Nearing Completion?
XAUUSD has developed a descending channel, with successive lower highs and renewed selling pressure dominating the short-term structure.
The latest decline could represent the final stage of a developing bearish A-
ZEC — Golden PocketFor the next long setup, I'd love to see price dip into the golden pocket, where we also have some imbalance to fill 👀 we all love the golden pocket and price has a habit of revisiting these zones!
Quick educational note: The golden pocket sits between the 0.618 and 0.666 Fibonacci levels. It's a popular area to watch for potential reversals, especially when it lines up with other confluences like imbalances, support levels or AVWAPs.
Of course, we don't blindly long the golden pocket, we're l
BTCUSDT - Consolidation above 80K and the 50-day moving average
BINANCE:BTCUSDT.P continues its consolidation phase above 80K — the medium-term level formed during the previous bearish cycle. This could become a fairly important prerequisite for another rally.
The BTC network hashrate has resumed growth, which indicates confidence among large financial institutions in BTC’s prospects. Inflows into BTC ETFs continue. However, the market is awaiting the results of the US vote.
Technically, on D1–W1, Bitcoin is consolidating above the key support level