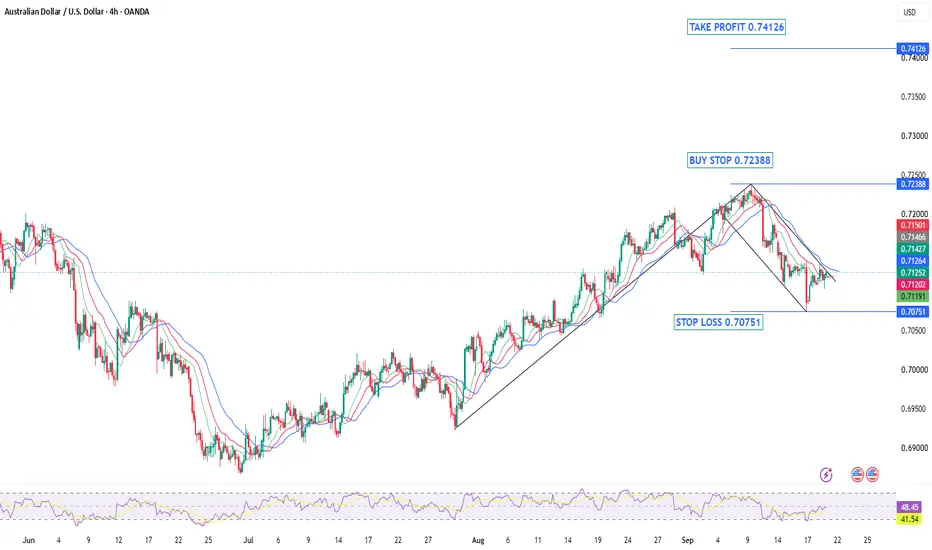
AUDUSD — Bullish Flag Breakout SetupAfter months of bearish pressure that dominated the first half of the year, AUDUSD has made a remarkable recovery. Since mid-July, the pair has been carving out a textbook bullish structure — printing a clean series of Higher Highs and Higher Lows — a classic sign that buyers are firmly in control and the market is in a healthy Advancing Phase.
The rally was strong and impulsive, with price gaining significant ground in a relatively short period of time. This kind of momentum tells us that ther
Flag
Bitcoin to $98,000? Daily Flag Breakout Puts BTC Back in Focus
Bitcoin is showing an interesting development on the daily chart.
After reclaiming the 200 EMA, BTC spent the following sessions consolidating inside a downward-sloping structure. Following the latest strong upward move, price now appears to be breaking above the upper boundary of that consolidation.
This raises an obvious question:
Could Bitcoin be preparing for a move toward $94,000–$98,000?
Possibly — but there are several important things to watch before getting too confident about tha
XRP Bullish +55 %XRP/USDT Technical Analysis (Daily Timeframe) – Preparing for the Next Move!
After a sharp and strong rally, the price has entered a consolidation and pullback phase, forming a Falling Channel (Bull Flag pattern). This behavior is completely natural and healthy for price stabilization before continuing its upward trend.
🔹 Current Status & Key Levels:
• Current Price: Around $1.41
• Key Resistance & Channel Top: $1.4550 - $1.5458 zone (Blue Line)
• Target: $2.2756 zone (Red Box - Next major res
APARINDS - Pole & Flag BreakoutAPAR Industries is one of India's largest manufacturers of conductors, cables, and specialty transformer oils — a direct beneficiary of India's accelerating power transmission and grid modernisation capex cycle.
📊 Key Numbers (TTM / Latest):
Revenue: ₹24,389 Cr (+24% YoY)
Net Profit: ₹1,182 Cr (+34% YoY)
Q1 FY27 PAT: ₹467 Cr (+77.8% YoY) ← accelerating
ROCE: ~29.8% | ROE: ~18.1%
Operating Margin: 8.85% (expanding)
Conductor Order Book: ₹10,190 Cr (strong revenue visibility)
💰 Valuation:
TTM P/E
USD/CAD: Bullish Flag After the NewsAfter last night’s news and speeches, FX:USDCAD USD/CAD continued its previous bullish trend.
The move was strong, but since the Asian session, price has entered a period of consolidation and is now forming a Bullish Flag on the M15 timeframe.
For me, this is an important part of the setup.
A strong move followed by a controlled correction can create the conditions for another continuation. But the flag itself is not an entry signal.
I want the market to prove that buyers are still in contro
Gold: H4 Head & Shoulders Is Now Becoming a Real Trading BiasTwo days ago, we published the H4 Head & Shoulders structure on Gold and highlighted the neckline breakdown as an important signal for the larger direction.
Now, after the Federal Reserve's decision and Chair Kevin Warsh's press conference, the setup deserves another look.
The Fed raised rates by 25 basis points to 3.75%–4.00%, while its latest projections pointed to the possibility of another hike this year.
Policymakers also raised their 2026 inflation projection to 3.7%, keeping the fo
The stage is set for xrp to break up from the bullflag Lots of bullish confluence at the moment on XRPUSD’s 1 day chart here. First off we just closed our 1st daily bullish candle above the top trendline of the bullflag. Secondly the stochrsi has been in the fully reset / oversold zone for over a week now and has just now dipped back up into the bullish zone. Thirdly, the golden cross is likely to occur sometime this week and price action is still relatively close to the 200ma which increases the probability of a sustained golden cross. Lastly tomor
INFY: The Flag Finally BrokeINFY's 210-minute chart has moved through a clean continuation sequence over the past two weeks. Here's the sequence, in order:
Impulse leg: price dropped from 1193.5 to 1107.2 in a single sharp decline — the "pole."
Consolidation: for roughly nine bars price coiled between a rising 1145–1161 ceiling and a flat 1108–1114 floor — the "flag," sloping gently against the prevailing decline rather than reversing it.
Breakdown: the flag floor gave way, and price dropped from 1125.4 to 1026.5, a
EURJPY: Selloff Continues 🇪🇺🇯🇵
EURJPY will likely continue falling as the market successfully completed a consolidation
within a bearish flag pattern on a 4H.
Its support breakout indicates a highly probable bearish continuation.
Next goal - 177.2
❤️Please, support my work with like, thank you!❤️
I am part of Trade Nation's Influencer program and receive a monthly fee for using their TradingView charts in my analysis.
Tesla inside a bull flag, if hold 400$ can go 500$NASDAQ:TSLA tesla has a daily bull flag (white lines). If breaks that trend line and stay above ema200 thats at 400$ which is very close to the bull flag resistance, measured move pattern break would be around all time high's if not bit higher.
That said it's also trading inside a big rectangle (yellow lines), if breaks 500$ I see it pump more, if breaks 500$ would break all time high's and create a pattern break (rectangle) with a possible target up to 760$!
First break and hold 400$ if it d
EURUSD Breakout Trade EUR/USD – Breakout Confirmation
🔹 Multi-Timeframe Bullish Setup by PULSETRADESFX
EUR/USD is showing a strong bullish shift after breaking out of a well-defined descending channel. Price reacted perfectly from the demand zone and is now pushing above descending trendline resistance across the 2H chart.
This signals early signs of trend reversal, backed by confluence across intraday and higher timeframes.
The structure is clean, the R:R is healthy, and momentum favors bulls after multiple re
USDJPY 4H – Is the Downtrend Coming to an End?
On the 4H chart, we can see the price trending steadily lower, forming a clear series of lower highs and lower lows.
But! The first move down (A) was -3.20%, while the following decline was weaker at -2.50%. This suggests that the downward momentum is losing strength, which is not surprising given that the 152 level is a support area on the Daily chart.
If the price reaches the 152 support area, we could potentially see an upward move develop
LITUSDT: Breakout Confirmed — Now We Wait for the PullbackLIT has broken above the descending pattern on the 4H timeframe after a strong move higher.
The important point now is not to chase the breakout.
Price may return toward the 4.55–4.75 support/pullback zone before continuing higher. A successful retest would give the bullish structure more confirmation.
Trade Setup
Timeframe: 4H
Pullback Zone: 4.55 – 4.75
Invalidation: 4.30
Pattern Target: 6.40
If the pullback holds and buyers defend the zone, the measured pattern target around 6.40 beco
MESU Sep 8: 7687 or 7725 — Which Liquidity Goes First?MESU is trading around 7,700 after overnight selling pressure, with liquidity sitting on both sides of the current price.
The first upside level I’m watching is around 7,725. A bounce could revisit this area before the market decides on its larger direction.
On the downside, the overnight low around 7,687 is the first liquidity target. If sellers push through that level with confirmation, the larger weekly support around 7,662 comes into focus.
The other major factor is the descending 4-hour