DLocal: The Perfect Storm of Hypergrowth and Mispricing📋 DLO — DLocal Limited
Current Price: ~$14.40–14.50 | Data as of early August 2026
🏢 FUNDAMENTAL ANALYSIS
Business
DLocal is a payments infrastructure company focused on cross-border commerce in emerging markets across Latin America, Africa, and Asia.
The company solves a specific pain point for large global merchants such as Amazon, Microsoft, Spotify, Uber, and similar platforms: enabling them to accept local payment methods, navigate currency controls, and repatriate funds in countries with complex financial and regulatory systems.
This is a relatively specialized but capital-intensive niche in which DLocal has established a strong position through direct integrations with local banks and payment networks rather than relying primarily on intermediaries.
Financial Position
DLocal generated approximately $1.21 billion in trailing twelve-month revenue and $192.15 million in net income, representing an 18% net profit margin.
In Q1 2026, revenue increased 55% year over year to $335.9 million. However, cost of revenue grew faster, increasing 65%, which compressed gross margin to approximately 35% and operating margin to 15.7%.
TPV (Total Payment Volume) increased an impressive 73% year over year to $14.1 billion. However, net income declined to $42 million as a result of margin pressure and a one-time tax impact.
The balance sheet remains healthy. The current ratio stands at 1.33, debt-to-equity is only 0.20, ROE is close to 35%, and ROIC is approximately 22%. This indicates that DLocal is generating strong returns on capital while maintaining very limited financial leverage.
Share dilution is also not currently a major concern. Shares outstanding actually declined slightly over the past year, by approximately 0.56%, supported by the company’s share repurchase program.
📰 RECENT DEVELOPMENTS
Management has provided 2026 guidance calling for:
TPV growth: +50% to +60%
Gross profit growth: +22.5% to +27.5%
Operating profit growth: +27.5% to +32.5%
The company has also announced a $300 million share buyback and introduced a dividend for the first time.
Combined, these shareholder-return initiatives represent approximately 9–10% in potential capital return at current valuation levels.
DLocal is also actively controlling operating expenses through hiring restrictions while expanding into higher-margin Tier 2 and Tier 3 markets in an effort to stabilize its take rate.
Negative Developments
The largest overhang on DLocal’s reputation dates back to 2022–2023.
In November 2022, Muddy Waters Research published a report explicitly alleging that “DLO is likely a fraud,” pointing to inconsistencies in the company’s disclosures regarding TPV and accounts receivable.
In May 2023, Argentine media reported that the Argentine government was investigating potential fraud involving approximately $400 million related to allegedly unauthorized currency transfers.
The news triggered a decline of more than 17% in the stock and was followed by a series of investor class-action lawsuits alleging insufficient disclosure of risks related to violations of Argentine currency regulations.
Some legal proceedings related to this period remain ongoing. However, there do not appear to be significant new fraud allegations or regulatory issues emerging in 2025–2026.
As a result, this is better viewed as a historical overhang rather than an active operational crisis. Nevertheless, it remains important because it helps explain the structural valuation discount assigned to DLocal relative to its growth rate.
⚖️ VALUATION — CHEAP OR EXPENSIVE?
DLocal currently trades at approximately:
Forward P/E: 12.96x
Trailing P/E: 19.13x
EV/EBITDA: 12.01x
EV/FCF: 6.79x
For a company growing revenue at more than 50% and TPV at more than 70%, these multiples appear unusually low.
Comparable high-growth fintech platforms typically trade at forward P/E multiples above 20x.
DLocal’s discount can largely be explained by three factors: margin compression, the historical legal overhang, and persistent investor skepticism surrounding the company’s financial disclosures following the Muddy Waters allegations.
One Seeking Alpha analyst estimates that DLocal is currently trading approximately 36–37% below fair value.
The conclusion is that DLocal appears structurally cheap relative to its growth profile. However, the discount is not necessarily irrational — it represents compensation for real legal, regulatory, and reputational risks.
That risk premium needs to be taken into account when determining position size.
💵 DIVIDENDS
DLocal currently pays an annual dividend of approximately $0.19 per share, representing a yield of around 1.58%.
The dividend is relatively new and was introduced alongside the 2026 guidance.
At this stage, the dividend should be viewed primarily as a signal of management’s confidence in the company’s free cash flow rather than as a standalone reason to own the stock.
With EV/FCF at approximately 6.8x, DLocal appears to have sufficient cash-generation capacity to support both the dividend and the announced share buyback.
At present, there is no obvious indication that the dividend is at significant risk of being reduced.
⚠️ TOP 3 RISKS
1. Take Rate Compression from Large Customers
Large enterprise merchants have significant bargaining power and can push for lower transaction fees as payment volumes increase.
This directly pressures DLocal’s gross and operating margins, and the effect is already visible in the company’s recent results.
If margins fail to stabilize at the levels implied by management’s guidance, the market could compress DLocal’s valuation multiple even further.
1. Regulatory and Legal Overhang in Latin America
The unresolved consequences of the 2023 Argentine investigation and the reputational damage following the Muddy Waters report continue to weigh on investor confidence.
Even if DLocal’s current operations remain fundamentally sound, any new regulatory incident in a key jurisdiction such as Brazil, Argentina, or Mexico could have a disproportionately negative impact on the stock because of its existing history.
1. Emerging-Market Currency and Macro Volatility
DLocal’s business model depends heavily on its ability to move money efficiently across countries with complex currency controls, high inflation, and changing financial regulations.
Any tightening of capital controls or payment regulations in a key market — such as Argentina or Nigeria — could directly affect DLocal’s ability to process transactions, repatriate profits, and serve its global merchant base.
🎯 BOTTOM LINE
Fundamentally, DLocal is one of the more interesting undervalued high-growth stories in the market.
The combination of 50%+ revenue growth, a clean balance sheet, share buybacks, a newly introduced dividend, and a forward P/E of approximately 13x is unusual.
However, the discount is not free.
It is compensation for a genuine legal and reputational overhang that could resurface through a regulatory headline from Argentina, Brazil, or another key market.
For a speculative position with a several-month horizon, the current valuation offers an interesting setup, with potential upside toward the $17–18 range, broadly in line with the current analyst consensus.
For a long-term position, DLocal can also be attractive, but it is better suited to investors who can tolerate significant volatility around regulatory and emerging-market headlines without being forced into panic selling.
In short:
“DLO is a rapidly growing business trading at a significant valuation discount, with a real but largely historical legal overhang. It offers potential both as a re-rating trade and as a gradual accumulation opportunity, but it is not a stock for investors who are uncomfortable with headline-driven volatility in Latin America.”
📈 TECHNICAL ANALYSIS
On the weekly timeframe, DLocal has completed a bullish flag pattern and subsequently broken out to the upside.
Following the breakout, the preferred scenario is a corrective pullback and a retest of the breakout zone from above. This type of retest would allow the market to confirm the former resistance area as new support before potentially continuing higher.
What makes the setup particularly interesting is the confluence of several technical factors within the same zone.
The potential entry area around $12.90–13.90 combines:
• The bullish flag breakout and potential retest zone
• A Fair Value Gap (FVG)
• The 50-day, 150-day, and 200-day SMAs
• The 50-week, 150-week, and 200-week SMAs
• A major Point of Control (POC) zone that has been active since the beginning of 2025
The simultaneous interaction with the major moving averages across both the daily and weekly timeframes is relatively uncommon and creates a particularly strong area of technical confluence.
At the same time, a Golden Cross is forming on both the daily and weekly timeframes, further strengthening the bullish structure.
The POC is especially important because it represents a significant concentration of historical traded volume. This suggests that the $12.90–13.90 area has acted as an important zone of accumulation and acceptance, potentially making it an attractive risk-defined entry area if the breakout retest holds.
Momentum indicators are also supportive.
The RSI remains neutral, meaning there is still room for the stock to move higher without entering an obviously overbought condition.
The ADX is beginning to strengthen, suggesting that a directional trend may be developing.
Importantly, the breakout above the bullish flag occurred on elevated volume, which adds credibility to the move and suggests that the breakout was supported by meaningful market participation rather than occurring on weak liquidity.
The technical setup can therefore be summarized as:
Entry Zone: $12.90–13.90
Pattern: Bullish Flag
Breakout: Confirmed with Elevated Volume
Key Confluence: FVG + 50/150/200 SMA + POC
Timeframes: Daily + Weekly
Momentum: RSI Neutral
Trend Strength: ADX Strengthening
Additional Confirmation: Golden Cross forming on both Daily and Weekly timeframes
🎯 PRICE TARGET
The primary technical target is derived from the measured move of the bullish flag pattern.
Target: $22.80
This represents the projected upside objective if the breakout remains valid and the price completes the expected measured move.
🛑 STOP LOSS / TRADE INVALIDATION
The bullish thesis is invalidated if DLO breaks below and establishes itself beneath the most recent major swing low at $10.40.
A sustained move below $10.40 would invalidate the bullish flag structure and indicate that the breakout has failed.
Therefore:
Bullish above: $10.40
Entry Zone: $12.90–13.90
Target: $22.80
Invalidation: Sustained break below $10.40
Overall, the technical setup offers an attractive risk/reward profile if the $12.90–13.90 retest zone holds and the stock maintains the bullish structure established by the flag breakout.  Long
Long


 Long
Long
 Short
Short
 Long
Long
Silver (XAG)- The Setup That Could Lead to a New All Time HighUsing the 4H chart we see the price has formed a six-month descending wedge since late January, during which it experienced a significant 55% correction.
What stands out as a potential sign of bottoming is the basing price action forming a symmetrical triangle. After a prolonged decline, the price is stabilizing, suggesting that selling pressure is fading and a potential trend reversal is developing.
Zooming in the triangle:
Using the classic symmetrical triangle method to calculate the post-breakout targets, we can see that the price has already reached Target 1 at $63.78. The next target is $68.45, which is particularly interesting because it lines up almost perfectly with the upper trendline of the descending wedge. This creates an important confluence zone and could be a key test for the continuation of the bullish reversal.
Back to the 4H chart:
As mentioned, the triangle’s second target lines up almost perfectly with the “ceiling” of the wedge, creating a strong area of confluence. Another bullish signal is that the price has now reclaimed the 4H 200-period moving average, which it had remained below for more than two months.
Additionally, the RSI has broken above its own symmetrical triangle structure after consolidating for nearly two months. The longer a pattern takes to develop, the more significant the eventual breakout tends to be, as it reflects a longer period of momentum buildup before the next directional move.
Zooming out to the daily chart:
The entire structure is starting to resemble a bull flag pattern, where the strong impulsive move higher represents the flagpole, while the descending wedge that followed acts as the consolidation phase. A breakout above the upper boundary of the wedge would confirm the continuation pattern and could signal the next leg higher.
When analyzing silver, I also pay close attention to the gold-to-silver ratio XAU/XAG, as it helps identify the relative strength between the two metals. By tracking whether the ratio is rising or falling, we can get a better understanding of whether gold or silver is likely to lead the next move in the precious metals market.
XAU/XAG Chart:
On the chart, the double top formation is clearly visible. Historically, this pattern often signals a potential reversal and is usually followed by a meaningful decline. My expectation is that the price could continue lower toward the trendline, which currently sits around 5% below current levels, before finding support and potentially reversing higher.
If this scenario plays out, it would suggest that the XAU/XAG ratio declines, meaning silver could outperform gold over the coming days or weeks.
Conclusion-
I remain bullish on both silver and gold, expecting another leg higher that could push both metals to new all-time highs. In the short to medium term, the gold/silver ratio suggests that silver has the potential to outperform gold in the next move.
The key area to watch for silver is the $68.5–$71 zone, which represents the upper boundary of the wedge structure. This area also aligns with the 200-day moving average, creating a strong resistance zone that could determine whether the bullish move continues or faces a pullback.
 Long
Long
 Long
Long

Crude Oil: A Potential Reversal Setup Is Taking ShapeAfter a 14.5% drop this week, oil appears to have found a bottom. The decline was largely driven by easing geopolitical tensions, which removed much of the risk premium from crude prices.
From a technical perspective, the price found support at a major demand zone (green box). A demand zone is an area where strong buying interest previously entered the market, making it a level traders watch closely for potential rebounds. As shown by the blue circles, the price has bounced from this zone many times over the past few months, reinforcing it as a key support level.
Additionally, the bounce occurred around the 0.618 Fibonacci retracement of the July 2–July 23 move. Although the reversal wasn't triggered precisely at the 61.8% level, the surrounding area is considered a high-probability support zone where buyers frequently step in.
Zooming in to the 4H chart:
Another bullish signal comes from the 4-hour RSI, which has broken above its descending trendline. This breakout hints that bearish momentum is fading and adds confidence that the recent downtrend may have come to an end.
The entire structure starts to look to me like a bull flag:
From here, the next key test is the upper trendline of the flag. A move toward that resistance zone is the most logical next step, and the reaction there will likely determine whether this is just a bounce or the start of a larger move towards the 90’s and even above.
 Long
Long

 Long
Long
 Long
Long
 Long
Long
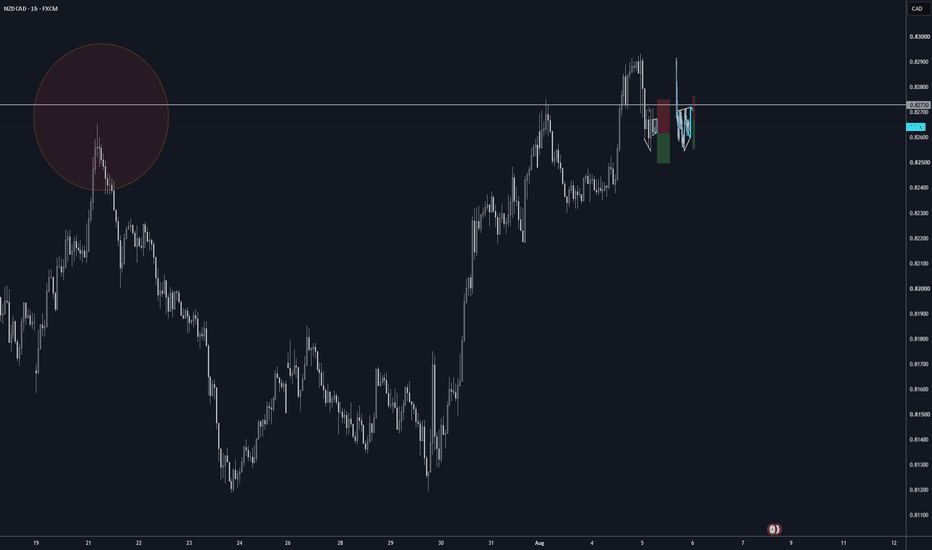
DDS – Bull Flag Breakout: Is the Next Leg Higher Underway?Sometimes the strongest stocks don't reverse—they simply pause before continuing higher.
After an impressive long-term rally, DDS entered a healthy correction, carving out a bull flag rather than breaking its primary uptrend. Instead of aggressive selling, price gradually drifted lower within a controlled channel—a textbook continuation pattern.
Now, that correction appears to be ending.
What stands out?
✅ Bull Flag breakout ongoing on the weekly timeframe.
✅ Correction remained orderly, preserving the long-term bullish structure.
✅ RSI is curling higher, suggesting momentum is returning.
✅ The breakout indicates buyers may be preparing for the next expansion phase.
Bullish Scenario
The first objective is straightforward:
🎯 Retest the all-time high around $704.
A successful breakout above this major resistance would likely trigger the next leg of the secular uptrend.
If that happens, the larger measured move from the bull flag projects a long-term target near:
🚀 $1,000+
While this is a long-term projection, it aligns well with the continuation structure that has been developing over the past several months.
Invalidation
As long as price holds above the bull flag breakout zone, the bullish continuation thesis remains intact. A sustained move back inside the flag would weaken the breakout and delay the next advance.
Every chart tells a story.
This one doesn't look like a trend reversal—it looks like a healthy correction within a powerful long-term uptrend. If the breakout holds, the next chapter could begin with a retest of the all-time high... and eventually, the psychological $1,000 milestone.  Long
Long
 Long
Long