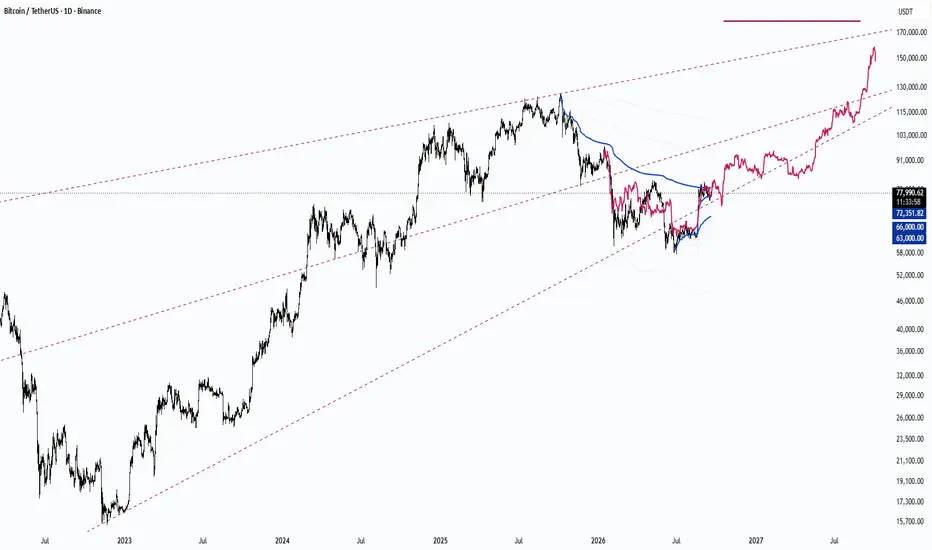
$BTC $92K Soon? The Weekly Downtrend Is Technically BrokenCRYPTOCAP:BTC : $92,000 soon?
I'm writing an update on my long-term thoughts about Bitcoin. In my previous post I clearly said:
"BTC makes a move up and closes above 82859. That would mean a CHoCH on the 1w timeframe. A close specifically, not a sweep, and preferably higher, somewhere near 85-87k.
And one more thing as a sub point. The 87-90k zone has a fairly big volume that could potentially slow the move up a little."
Along with that, I also mentioned VWAP, specifically price holding above it. ⤴️
Both factors came together successfully. BTC tested the value area low (VAL) of the previous range (around 87k), which ran from mid-November to the end of January. Price hasn't fully entered the value area of that period yet, but the VAL test is done.
Now there's a probability of the same kind of range forming for a couple of months. After that, there's a chance of seeing a move out to the downside: an impulsive, fast move out of the range into the zone around VWAP that gets a reaction or can't find continuation and comes back into the range. In that scenario, the probability of a subsequent move out to the upside (continuation) is higher. The main thing is for the move to VWAP to be impulsive with a failed continuation. In that case, I'm in.
Maybe there will still be a black swan somewhere down the line, but here and now, the previous downtrend is technically broken.  Long
Long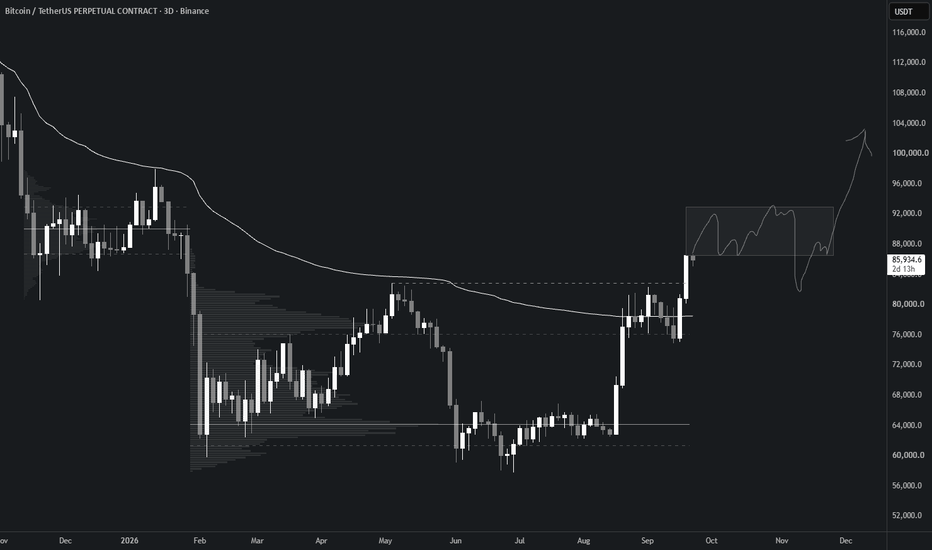
Long 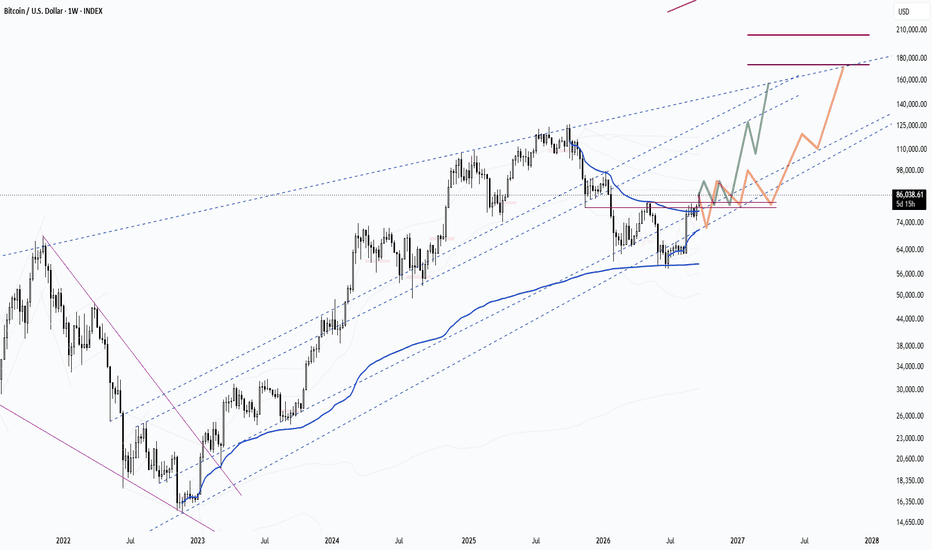
Long 
XAU/USD 22 September 2026 Intraday AnalysisH4 Analysis:
-> Swing: Bullish.
-> Internal: Bearish.
Bias and analysis to remain the same as analysis dated 30 June 2026.
Price did not print bullish CHoCH to indicate bullish pullback phase initiation. Price instead printed a new low followed by a bullish CHoCH
Price is currently trading within and established internal range, however, I will continue to monitor price with respect to depth of pullback.
Intraday expectation:
Price to trade up to either premium of internal 50% EQ, or H4 demand zone before targeting weak internal low, currently priced at 3,942.100.
Note:
Gold remains volatile as tensions between the US, Israel, and Iran keep safe‑haven demand elevated.
Markets are reacting quickly to every headline, while uncertainty around the Fed’s easing path and shifting U.S. policy under President Trump, especially tariffs continues to fuel choppy price action.
For newer traders, the key is simple, stay flexible and manage risk carefully, as fast spikes and sudden reversals are a normal part of the current XAU/USD environment.
H4 Chart:
M15 Analysis:
-> Swing: Bearish.
-> Internal: Bullish.
Analysis and bias to remain the same as yesterday's analysis dated 21 September 2026.
Price has printed according to analysis dated 17 September 2026 whereby I mentioned, in intraday analysis, due to the narrowing of the internal range, price could potentially strong internal high and print a bullish iBOS as we are also seeing a drastic reduction in the depth of the internal range.
Price has printed a bearish CHoCH to indicate bearish pullback phase initiation.
Price is now trading within an established internal range. CHoCH positioning is denoted with a blue dotted horizontal dotted line.
Intraday expectation:
Price to trade down to either discount of internal 50% EQ, or M15 supply zone before targeting weak internal high, currently priced at 4,399.670.
Note:
Gold remains highly reactive on M15 as geopolitical risk continues to drive quick, headline‑led moves.
The tension between the US, Israel, and Iran is keeping safe‑haven demand elevated, with markets still sensitive to any sign of escalation.
At the same time, shifting US tariff policy under President Trump is adding extra uncertainty, fuelling sharp intraday swings and increasing the likelihood of sudden sentiment flips. Liquidity pockets and whipsaws remain common, making disciplined risk management essential.
Gold’s geopolitical premium is still firmly in place, and until tensions ease, short‑term volatility is likely to stay front‑loaded.
M15 Chart: Episode 08 — The Architecture Behind the Waves🎬 Mr. Nobody’s Chronicle
Season I — The History of Elliott Wave Principle
Episode 08 — The Architecture Behind the Waves
⏱️ Reading time: ~3 minutes
“When we discover the language of a pattern, the next question is: How is it built?”
In the previous episode, we reached one of the most recognizable ideas behind the Wave Principle:
Five waves in the direction of the main movement...
and three waves in the corrective direction.
But one important question remained.
Do all waves have the same character?
Does every five-wave movement develop in exactly the same way?
Or is there a deeper architecture behind this seemingly simple count?
Elliott gradually realized that waves could not be identified simply by their direction or their length.
Every wave has its own behavior and structure.
In his framework, market movements could be divided into two broad families:
Motive Waves
and
Corrective Waves.
Motive waves move in the direction of the larger trend.
Corrective waves move against it.
But here, an important point must be understood.
The fact that a motive wave appears stronger or longer is not, by itself, enough to identify it.
For example, Wave 3 is not always the longest wave.
What matters in the Wave Principle is the complete set of structural rules and relationships.
In an impulse, Wave 3 cannot be the shortest of Waves 1, 3, and 5.
But the lengths of the waves can still vary.
Sometimes Wave 1 extends.
Sometimes Wave 3.
And sometimes even Wave 5.
This is what Elliott described as an Extension.
When an extension occurs, what initially appears to be a simple five-wave movement can contain a much more complex structure within it.
A wave may appear as only one wave at a higher degree...
but when we look closer, we may discover that it is composed of a series of smaller movements.
Five movements...
containing even more structure within them.
And here, we return once again to the idea we explored in Episode 05:
A pattern within the pattern.
So, to understand a wave, we should not look only at the number of movements.
We should ask:
How is this movement built?
What is its degree?
What does its internal structure look like?
And does that structure remain consistent with the rules that apply to it?
This is where an important difference appears between the appearance of a wave and its actual structure.
Two movements may look similar at first glance...
but when we examine their internal structure, we may discover that their character is completely different.
And perhaps this is where one of the most important lessons of the Wave Principle begins to reveal itself:
The wave count tells only part of the story.
The structure tells the rest.
The deeper we go into the world of waves, the more important this becomes.
Because to understand what a structure truly is, we need to know what is allowed...
and what is not allowed.
And this is exactly where the Wave Principle begins to move beyond simple market observation...
and becomes a structural framework.
A framework in which rules protect the pattern.
But alongside the rules, there are also guidelines that help us recognize and interpret possible structures.
So now that we have a broader view of the architecture of waves...
it is time to enter a more sensitive part of the story.
The rules that prevent us from calling every structure an Elliott Wave pattern.
Because in the next episode...
we are going to ask:
What makes a pattern valid?
And what can invalidate it?
To be continued...
Narrated by Mr. Nobody 🎧📊
Research & Market Studies
Mehdi & Rana
 Education
🇪🇺🇺🇸 EUR/USD 3H | When Structure Gets Complex🇪🇺🇺🇸 EUR/USD 3H | When Structure Gets Complex, the Path Is Not Always Straight 🌀
⏱️ Reading time: about 3 minutes
Following our weekly EUR/USD analysis, we are now moving closer to the 3-hour chart to examine what the current structure may be building at the lower degree.
At this stage, the bearish scenario carries more weight, and a continuation of the downward move remains one of the important structural possibilities.
Within this scenario, the current structure may be developing as a Leading Diagonal, particularly considering the internal wave subdivisions and the channels marked on the chart. If this interpretation is correct, once the bearish structure is completed, the market could enter a corrective phase before another downward wave develops.
But there is an important point here.
The market does not always move in a straight line toward the expected scenario.
If the current structure proves to be more complex than what we can see at this stage, the market may move higher once again before continuing lower.
That upward move could become part of a more complex corrective structure—for example, a sideways structure, a Double Zigzag, or even a Triple Zigzag. Therefore, another move higher, by itself, would not invalidate the bearish scenario.
For us, what matters is the internal structure of the move.
If the next upward move remains corrective and fails to develop a valid motive structure at the higher degree, it could ultimately lead to another continuation of the bearish scenario.
On the other hand, if the market develops a valid and coherent bullish structure and moves through the confirmation levels marked on the chart, then we would need to reassess the wave count.
🌍 The Bigger Picture
Alongside the technical structure, I always pay attention to the behavior of other markets as well.
At the moment, U.S. dollar strength is one factor that may be relevant to EUR/USD. The relationship between the dollar and markets such as cryptocurrencies, oil, and gas can also change over time; sometimes we see positive correlation and sometimes negative correlation. Therefore, I view these relationships mainly as clues for understanding market behavior, rather than as fixed or permanent relationships.
From my personal perspective, large market structures are not only about price. They can also reflect decisions, policies, choices, and even collective mistakes within the global economy.
The future may continue to present challenges in terms of living costs and resources, but at the same time, technological progress—especially artificial intelligence—could increase productivity and potentially improve living conditions in some areas.
I also believe, personally, that the cryptocurrency market could become one of the potential paths toward wealth creation for some people in the future. But this is simply my personal view—not a guarantee or a certain prediction.
Ultimately, as we always say:
We do not decide the future; we observe and interpret the structure the market is building in the present.
For now, the bearish continuation remains the more likely structural path in this analysis, while another upward move as part of a complex corrective structure remains entirely possible.
So, we let the market make the decision.
Structure First. Scenario Second.
Patterns whisper. I listen.
— Mr. Nobody
Euro / U.S. Dollar
4 days ago
EUR/USD — Larger Correction or the Continuation of the Bullish T
 Long
Long
Silver | One Structure, Two Possible Paths⏱️ Reading time: about 3 minutes
Following our previous Silver analyses, this time we are looking at the chart from the perspective of the previous high, allowing the relationship between the larger historical structure and the current movement to become clearer.
In this view, we have been tracking a larger corrective structure from the previous high, with the possibility of a Wave IV developing. In the lower part of the chart, a Leading Diagonal followed by a Simple Zigzag has also been identified as a structure worth monitoring.
The key point is that both current scenarios begin from the same interpretation of the previous structure. The main difference is what the market may build from here.
🟦 Scenario 1 | Bullish Case
In the bullish scenario, the structure developing from the recent low could be the beginning of a new motive wave.
The current advance could be developing as a 1–2 structure followed by Wave 3, or, at a higher degree, it could be part of a larger motive structure.
If price continues to advance with strength and then produces clean corrections proportional to the degree of each wave, the bullish structure will gradually begin to prove itself.
For us, simply reaching a higher price is not enough. What matters is whether each advance is followed by corrective behavior that matches the wave's degree and character.
If this behavior continues, the possibility of a developing Wave 3 — or a larger motive structure — becomes increasingly relevant.
⬛ Scenario 2 | Bearish Case
In the bearish scenario, the same current advance could still be part of a larger corrective structure.
In this case, the current rise may develop as a three-wave structure — for example, part of a B wave or a connecting structure within a more complex correction.
If this advance completes as a corrective three-wave structure rather than developing into a valid motive pattern, and the market then turns lower again, we could see a C wave decline that eventually completes the larger Wave IV — the structure shown on the chart as a Classic Zigzag.
🔎 What This Chart Is Telling Us
So, the difference between these two scenarios is not really about direction; it is about the character of the future structure.
In the bullish case, we expect the advances to develop into a valid motive structure.
In the bearish case, the same advance could simply be part of a larger correction, leaving another downward wave to complete the structure.
That is why there is no need to rush into changing the count.
The market has to show us the next structure.
We have studied the structure that came before; now it is up to price to show us what is actually developing from this point.
Patterns whisper. I listen.
— Mr. Nobody 🎧📊
Silver / U.S. Dollar
Sep 6
Silver 4H | The Structure Is Speaking — Elliott Wave Update
 Long
Long
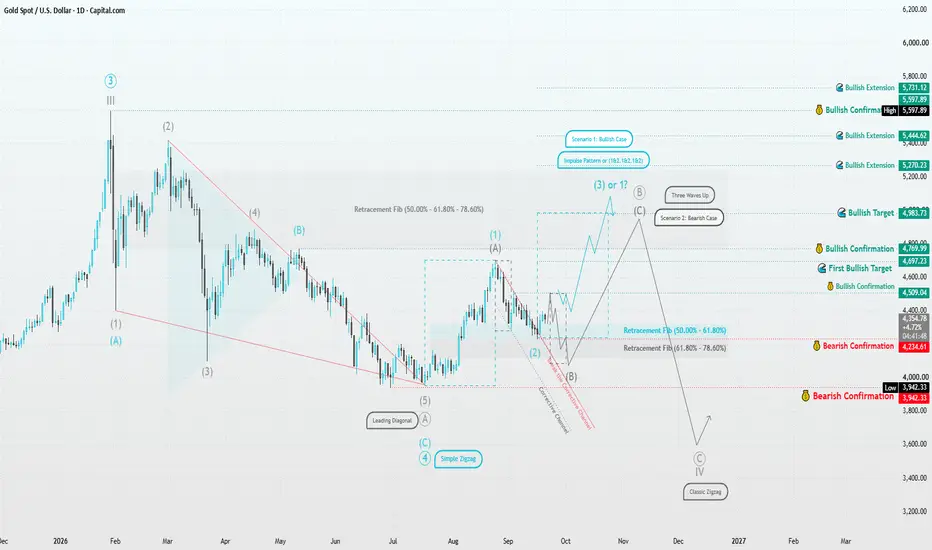
Gold | Structure Before Direction⏱️ Reading Time: ~2 minutes
In the daily timeframe, Gold’s current structure can be viewed from two perspectives. The recent move from around 3,942 may represent the beginning of a new bullish motive structure, while the current decline could potentially be Wave (2) if the 4,234–4,509 area continues to hold.
🔵 Bullish Scenario
What matters is not simply whether price rises, but whether the market develops a valid five-wave motive structure from this area. A move above 4,697, followed by 4,769, would provide stronger structural evidence for continuation toward 4,983 and potentially higher levels.
⚫ Bearish Scenario
If the next advance remains corrective and unfolds in three waves, the current rise may be only part of a larger correction. In that case, the 4,769–4,983 zone could become an area where the corrective advance ends, opening the possibility of another decline toward 4,234, 3,942, and even 3,600.
For me, the key question is not simply whether Gold is bullish or bearish.
The real question is: will the next structure be motive or corrective?
The Wave Principle allows the market itself to reveal which scenario is developing.
– Patterns whisper. I listen.
Mr. Nobody 🎧📊
Gold Spot
Sep 5
Gold’s Structural Crossroad
 Long
Long
Long 
XAU/USD 21 September 2026 Intraday AnalysisH4 Analysis:
-> Swing: Bullish.
-> Internal: Bearish.
Bias and analysis to remain the same as analysis dated 30 June 2026.
Price did not print bullish CHoCH to indicate bullish pullback phase initiation. Price instead printed a new low followed by a bullish CHoCH
Price is currently trading within and established internal range, however, I will continue to monitor price with respect to depth of pullback.
Intraday expectation:
Price to trade up to either premium of internal 50% EQ, or H4 demand zone before targeting weak internal low, currently priced at 3,942.100.
Note:
Gold remains volatile as tensions between the US, Israel, and Iran keep safe‑haven demand elevated.
Markets are reacting quickly to every headline, while uncertainty around the Fed’s easing path and shifting U.S. policy under President Trump, especially tariffs continues to fuel choppy price action.
For newer traders, the key is simple, stay flexible and manage risk carefully, as fast spikes and sudden reversals are a normal part of the current XAU/USD environment.
H4 Chart:
M15 Analysis:
-> Swing: Bearish.
-> Internal: Bullish.
Price has printed according to analysis dated 17 September 2026 whereby I mentioned, in intraday analysis, due to the narrowing of the internal range, price could potentially strong internal high and print a bullish iBOS as we are also seeing a drastic reduction in the depth of the internal range.
Price has printed a bearish CHoCH to indicate bearish pullback phase initiation.
Price is now trading within an established internal range. CHoCH positioning is denoted with a blue dotted horizontal dotted line.
Intraday expectation:
Price to trade down to either discount of internal 50% EQ, or M15 supply zone before targeting weak internal high, currently priced at 4,399.670.
Note:
Gold remains highly reactive on M15 as geopolitical risk continues to drive quick, headline‑led moves.
The tension between the US, Israel, and Iran is keeping safe‑haven demand elevated, with markets still sensitive to any sign of escalation.
At the same time, shifting US tariff policy under President Trump is adding extra uncertainty, fuelling sharp intraday swings and increasing the likelihood of sudden sentiment flips. Liquidity pockets and whipsaws remain common, making disciplined risk management essential.
Gold’s geopolitical premium is still firmly in place, and until tensions ease, short‑term volatility is likely to stay front‑loaded.
M15 Chart: Crude Oil | What Is the Current Wave Structure Telling Us?⏱️ Reading time: about 2 minutes
In our previous oil analysis, the main question was:
What structure is the market building?
Now, after a few more days of price action, the internal structure is giving us more information.
In the previous analysis, we looked at the advance as a possible part of a higher-degree Wave III, with 105.80 as an important confirmation level.
In this update, the internal structure is becoming more detailed.
The recent move can now be viewed as a sequence of Wave 1 and Wave 2, followed by the development of Wave 3. The latest correction is also showing the characteristics of a three-wave corrective structure.
In the bullish scenario, holding this structure could keep the path open for further development of Wave 3.
For now, 102.996 is the current confirmation level, while 104.753 is the first important structural target.
If the bullish structure continues, 127.970, 142.314, 151.066, and 165.653 can be monitored as the next reference areas.
But there is another important point.
If the market moves into a deeper decline, a three-cycle structure could become relevant again. However, for that scenario to develop into a larger-degree bearish structure, the market would need to decline much further.
In that case, 79.347 and then 72.423 become important levels to watch, while 54.877 remains a major boundary for the larger bullish structure.
So compared with the previous analysis, the main question has not changed:
“Where is the market going?” is still not the question we are trying to answer.
The real question is:
“What is the current structure developing into?”
A few days of price action do not necessarily change the larger scenario.
Sometimes, they simply help us see what is happening inside the structure more clearly.
We don't follow predictions.
We follow structure.
Patterns whisper, and I listen.
— Mr. Nobody 🎧📊
Brent Crude Oil
4 days ago
Brent Crude Oil | Is Wave III Expanding?
WTI Crude OIL vs US Dollar
3 days ago
Crude Oil | Is Wave 3 Expanding?
🇪🇺🇺🇸 EUR/USD | When Structure Reveals the Next Path⏱️ Reading time: about 3 minutes
In this analysis, we are taking a closer look at the EUR/USD structure—especially the movement that developed after the recent historical low, and what price may currently be building at the lower degrees.
From an Elliott Wave perspective, it is not enough for us to simply ask whether price will ultimately move higher or lower. The more important question is:
What structure is the market building right now?
From the major market low, a significant upward move developed, followed by a corrective phase. In the bullish scenario, this correction may still be part of a larger corrective structure. Therefore, we do not want to make the decision before the market itself gives us enough structural evidence.
🟦 Scenario 1 — Bullish Case
In the bullish scenario, if the current correction can complete as a three-wave structure, we would expect price to break out of the marked area and develop a valid motive structure to the upside.
The first important area for this scenario is 1.20818, marked on the chart as Bullish Confirmation.
However, simply moving above this level is not enough for us.
If price breaks above this area and then develops a valid bullish structure, we can give greater weight to the possibility of further upside and the development of Five Waves Up.
Along this path, the 1.20, 1.24, and then approximately 1.26–1.27 areas can become important zones to monitor for price reaction.
The key point is that even if five waves develop to the upside, we still need to observe the correction that follows. The structure will help us determine the degree we are actually dealing with.
⬛ Scenario 2 — Bearish Case
The bearish scenario has not been removed from the chart yet.
If price fails to develop a valid bullish motive structure and instead turns lower again, the possibility of a deeper correction becomes more important.
In that case, a break of the Corrective Channel and the development of a valid bearish structure would become particularly important.
The 1.15833 area is also marked as an important level for monitoring the bearish scenario.
If this path continues, the structure could become more complex and deeper, potentially developing into a larger corrective pattern.
🌀 What Matters Most Right Now
At this stage, we do not want to force the market to follow either scenario.
Scenarios are the map; price structure must reveal the actual path.
If price breaks above the bullish area and develops a valid motive structure, the bullish scenario will gain more weight.
If the upward move fails to produce the required structure and the market returns to a bearish structure, the possibility of a deeper correction will become important again.
Finally, 1.01771 remains marked on the chart as an important Invalidation level.
For us, even a large bullish or bearish move by itself is not enough.
We are waiting for structure.
Structure First. Scenario Second.
Patterns whisper. I listen.
— Mr. Nobody
Euro / U.S. Dollar
2 days ago
EUR/USD — Larger Correction or the Continuation of the Bullish T
Euro / U.S. Dollar
Jun 20
EURUSD: Grand Supercycle Perspective & Structural Outlook
Ethereum Weekly | One Larger Structure, Two Scenarios⏱️ Reading time: About 3 minutes
On the Ethereum Weekly chart, it helps to step back from the short-term price movements and focus on the larger market structure.
From the beginning of the chart, we can follow a larger impulsive structure, where waves I, II, and III are marked at their respective degree.
After the formation of III, the market entered a more complex corrective period, with several swings developing along the way. The main question now is whether this larger correction is approaching completion or still needs more time and structure to develop.
At this point, we are following two scenarios.
Scenario 1: Bullish Case
In the bullish scenario, the larger corrective structure may be approaching completion, and after (IV) is complete, the market could begin a larger upward move.
The first thing we want to see is an Impulse Pattern — Five Waves Up.
In other words, the market needs to develop a valid five-wave structure from the current area.
In this scenario, the initial move could be only the beginning of a larger structure, followed by intermediate corrections before the upward movement continues.
The 2,597.17 area is important as our Bullish Confirmation level. Holding the structure above this area could provide additional evidence for the bullish scenario.
If this structure continues to develop, the potential targets shown on the chart are:
19,534 → 39,407 → 96,606
These are not guaranteed price predictions. They are potential structural targets based on the wave relationships within this scenario.
Scenario 2: Bearish Case
The bearish scenario remains on the table as well.
If the current move fails to develop into a valid impulsive structure and the market enters another Big Correction, the larger corrective structure may still need more time to develop.
In that case, the current count could still represent only part of the larger correction, meaning the market may need additional time and price movement before a larger bullish cycle begins.
For us, reaching a specific price level is not the only thing that matters.
How price reaches that level matters even more.
If the market develops five waves upward, followed by a proportional correction, and then forms another impulsive structure, that sequence could provide important evidence for the bullish scenario.
But if the structure remains corrective, we will reassess the count based on the new market evidence.
Another important point on this chart is wave degree.
For example, I, II, and III belong to one degree, while (III) and (IV) represent a higher degree within the larger structure.
Therefore, we should not compare waves simply by their visual appearance. Degree, proportion, time, and internal structure all matter.
Ultimately, this is what matters most in our analysis:
We don't try to predict the path. We follow the structure.
If the bullish structure is confirmed, the turquoise scenario shows one possible path.
If the corrective structure continues, the black scenario remains under consideration.
In the end, the market itself will tell us which structure is developing.
Patterns whisper. I listen.
— Mr. Nobody 🎧📊
Ethereum
7 days ago
ETH/USD | The Hidden Structure of Wave V
Ethereum
Jul 11
Ethereum | Is the Largest Corrective Cycle Nearing Completion?
 Long
Long
 Long
Long
 Short
Short
Bitcoin Daily | The Structure Is Still the Story⏱️ Reading time: About 3 minutes
On the Bitcoin Daily chart, the main question for us is not simply whether price is going up or down.
The more important question is:
What is the current structure telling us?
From the major low marked on the chart, Bitcoin has developed a significant upward move. Now, we are watching one of the most important structural decision points in the market.
Scenario 1: Bullish Case
In the bullish scenario, the current upward move could be part of a larger impulsive structure.
First, we want to see this current structure develop and eventually complete. After that, a correction would be normal.
A correction does not automatically mean that the bullish structure has failed.
If the correction is followed by another impulsive move, a Leading Diagonal, or even a smaller nested 1–2 structure, that could provide important evidence for further upside.
The area around $126,255–$126,272 is especially important.
A valid break above this area could provide the first meaningful confirmation of the bullish scenario.
If the structure continues to support this scenario, the next structural targets shown on the chart are:
$168,628 → $195,184 → $237,116
These are not predictions or guarantees.
They are simply potential structural targets based on the current Elliott Wave scenario.
Scenario 2: Bearish Case
The bearish scenario is still possible.
If the current upward move fails to develop into a valid impulsive structure, and price begins forming another corrective structure, this could mean that the current rally is only part of a larger correction.
In that case, the 50%–61.8% retracement area becomes important, followed by the 61.8%–78.6% zone.
And there is one important point to remember:
One five-wave move alone is not enough to confirm a bullish trend.
For us, the sequence is more important:
Impulse → Correction → New Impulse
If this sequence develops according to Elliott Wave rules and guidelines, the bullish scenario becomes stronger.
If it doesn't, we simply reassess the structure and allow the market to show us what comes next.
The $15,479 level remains our major bullish invalidation level on this chart.
So as long as the larger structure continues to respect this level, the broader bullish possibility remains structurally valid.
And perhaps the most important idea is this:
We don't try to force the market to fit our count.
We adjust our count to fit the market.
Patterns whisper. I listen.
— Mr. Nobody 🎧📊
Bitcoin
Jun 22, 2023
Strong bullish cryptocurrency market???YES
Long 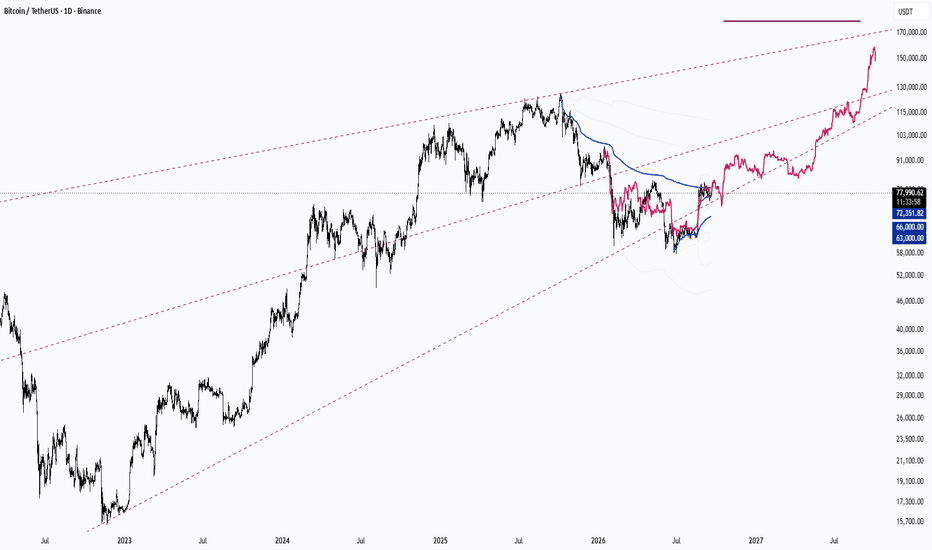
XAU/USD 18 September 2026 Intraday AnalysisH4 Analysis:
-> Swing: Bullish.
-> Internal: Bearish.
Bias and analysis to remain the same as analysis dated 30 June 2026.
Price did not print bullish CHoCH to indicate bullish pullback phase initiation. Price instead printed a new low followed by a bullish CHoCH
Price is currently trading within and established internal range, however, I will continue to monitor price with respect to depth of pullback.
Intraday expectation:
Price to trade up to either premium of internal 50% EQ, or H4 demand zone before targeting weak internal low, currently priced at 3,942.100.
Note:
Gold remains volatile as tensions between the US, Israel, and Iran keep safe‑haven demand elevated.
Markets are reacting quickly to every headline, while uncertainty around the Fed’s easing path and shifting U.S. policy under President Trump, especially tariffs continues to fuel choppy price action.
For newer traders, the key is simple, stay flexible and manage risk carefully, as fast spikes and sudden reversals are a normal part of the current XAU/USD environment.
H4 Chart:
M15 Analysis:
-> Swing: Bearish.
-> Internal: Bullish.
Price has printed according to yesterday's analysis dated 17 September 2026 whereby I mentioned, in intraday analysis, due to the narrowing of the internal range, price could potentially strong internal high and print a bullish iBOS as we are also seeing a drastic reduction in the depth of the internal range.
Price is currently trading within an internal low and fractal high. CHoCH positioning is the same as the fractal high. CHoCH positioning is denoted with a blue dotted horizontal dotted line.
Intraday expectation:
Price to trade down to either discount of internal 50% EQ, or M15 supply zone before targeting weak internal high, currently priced at 4,399.670.
Note:
Gold remains highly reactive on M15 as geopolitical risk continues to drive quick, headline‑led moves.
The tension between the US, Israel, and Iran is keeping safe‑haven demand elevated, with markets still sensitive to any sign of escalation.
At the same time, shifting US tariff policy under President Trump is adding extra uncertainty, fuelling sharp intraday swings and increasing the likelihood of sudden sentiment flips. Liquidity pockets and whipsaws remain common, making disciplined risk management essential.
Gold’s geopolitical premium is still firmly in place, and until tensions ease, short‑term volatility is likely to stay front‑loaded.
M15 Chart: ARB: Is History About to Repeat? +120% SetupARB | Daily
I’ve been looking at ARB and the current structure is getting very interesting.
1. Descending channel
ARB has been moving inside a very clear descending channel, which has been remarkably consistent.
2. 2023 price pattern
I took the price action pattern from 2023 and projected it onto the current structure. The match with the previous movement is surprisingly close.
3. RSI
RSI is now sitting at almost exactly the same levels as it was back in 2023.
4. Open Interest
OI is slightly lower, but that’s not surprising after such a long bearish period. More importantly, we’re starting to see OI increase, just like in 2023.
5. VDS
I pushed VDS to its maximum sensitivity to find the strongest historical entries. Over the last few months, it has now triggered its **4th BUY**.
Price bounced after each signal, then moved lower again. But the declines are becoming relatively minor.
That tells me something important:
ARB doesn’t seem particularly interested in falling further.
### The setup
A pullback toward $0.088 , followed by a move toward the upper boundary of the channel around $0.19 .
That would be roughly +120% .
Of course, there are major risks.
The broader bearish market structure is still intact, and ARB has essentially been trading in a downtrend throughout its history.
So for now, the trend still gives shorts the priority .
But when the price pattern, RSI, OI and VDS start telling a very similar story…
What if the next move is simply history repeating itself?
 Long
Long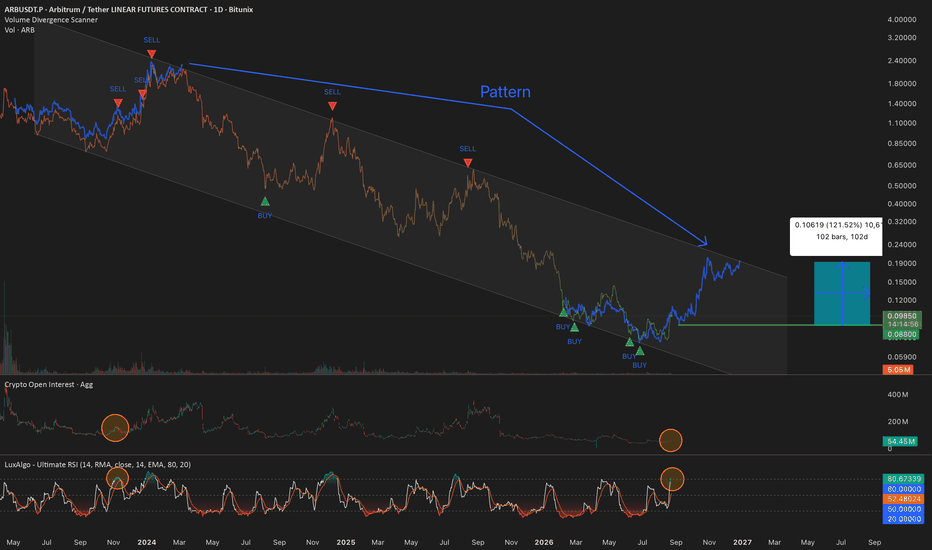
EUR/USD — Larger Correction or the Continuation of the Bullish T⏱️ Reading Time: ~4 minutes
On the EUR/USD chart, price is currently at an important point within the larger-term structure.
From the 1.60360 peak, a major bearish structure developed into the 0.95356 low. Since then, EUR/USD has produced a significant recovery.
The key question now is whether this recovery is still part of a larger correction, or whether it is developing into the beginning of a larger bullish trend.
🟦 Bullish Scenario — A Larger Uptrend
In the turquoise scenario, the advance from the 2022 low still has room to develop further to the upside.
The larger structure can potentially be interpreted as:
(W) – (X) – (Y)
Wave (W) is considered a Simple Zigzag, followed by corrective Wave (X).
The current X-Wave may still need more time and price development before it is complete. Therefore, the current fluctuations do not necessarily invalidate the larger bullish structure.
If Wave (X) completes and price develops the next bullish structure clearly, Wave (Y) could produce another significant advance.
In that case, the structure could eventually open the path toward higher levels, including the 1.30–1.35 area shown on the chart.
However, this scenario still needs confirmation from the internal price structure rather than simply reaching a target.
⚫ Bearish Scenario — A Larger and Deeper Correction
The black scenario presents a different interpretation.
Under this view, the entire recovery from 0.95356 may still be part of a much larger correction against the previous bearish structure.
If the recovery develops as a Double or Triple Zigzag, some of the strong rallies along the way can still remain corrective in the larger degree.
Even a five-wave advance on a lower degree would not automatically mean that the larger correction is finished.
Under this interpretation, another major bearish leg could eventually develop.
The lower areas marked on the chart, including:
1.01765–1.03575
0.92853
0.86220
would then become important areas for monitoring the larger bearish structure.
🔎 The Key Structural Question
The real difference between these two scenarios is not simply the next direction of price.
It is the degree and character of the advance from the 2022 low.
If EUR/USD continues to develop clear impulsive five-wave structures on the upside, followed by proportional corrections, the bullish scenario gains structural support.
But if the market continues producing overlapping three-wave structures, the possibility remains that the entire recovery is still part of a larger corrective sequence.
This is where the Double Zigzag / Triple Zigzag interpretation becomes particularly important.
🌍 EUR/USD & DXY
The EUR/USD structure can also be monitored alongside DXY.
Dollar weakness can generally support EUR/USD strength, but the two markets do not need to move as perfect wave-by-wave mirrors.
DXY can provide useful intermarket confirmation, while the EUR/USD count still needs to prove itself through its own price structure.
Conclusion
For now, the 🟦 turquoise scenario considers the possibility of a larger bullish continuation. If Wave (X) completes, the next bullish leg could develop as Wave (Y) and potentially become part of a much larger bullish structure.
Meanwhile, the ⚫ black scenario considers the possibility that the recovery from 2022 is still part of a larger Double or Triple Zigzag, leaving room for another significant bearish leg.
So the key question is:
Is EUR/USD building a larger bullish trend, or is the recovery still part of a larger corrective structure?
We don't need to force the answer.
Price will build the structure, and the structure will tell us which scenario remains valid.
Best Regards,
Mr. Nobody
Elliott Wave Analyst & Financial Researcher
– Patterns whisper. I listen. – Mr. Nobody 🎧📊
Euro / U.S. Dollar
Feb 6, 2025
EUR/USD – Bullish Wave & Invalidation Zone
British Pound / U.S. Dollar
Feb 6, 2025
GBP/USD Elliott Wave Analysis – Major Breakout Ahead?
XAU/USD 17 September 2026 Intraday AnalysisH4 Analysis:
-> Swing: Bullish.
-> Internal: Bearish.
Bias and analysis to remain the same as analysis dated 30 June 2026.
Price did not print bullish CHoCH to indicate bullish pullback phase initiation. Price instead printed a new low followed by a bullish CHoCH
Price is currently trading within and established internal range, however, I will continue to monitor price with respect to depth of pullback.
Intraday expectation:
Price to trade up to either premium of internal 50% EQ, or H4 demand zone before targeting weak internal low, currently priced at 3,942.100.
Note:
Gold remains volatile as tensions between the US, Israel, and Iran keep safe‑haven demand elevated.
Markets are reacting quickly to every headline, while uncertainty around the Fed’s easing path and shifting U.S. policy under President Trump, especially tariffs continues to fuel choppy price action.
For newer traders, the key is simple, stay flexible and manage risk carefully, as fast spikes and sudden reversals are a normal part of the current XAU/USD environment.
H4 Chart:
M15 Analysis:
-> Swing: Bearish.
-> Internal: Bearish.
Price has printed according to analysis dated 14 September 2026 whereby I mentioned price to target weak internal low priced at 4,282.625. However, I am not entirely convinced at the nature of the iBOS as the break was minimal and was caused by last night's FED interest rate decision.
We are also seeing a drastic reduction in the depth of the internal range.
Price is currently trading within an internal low and fractal high. CHoCH positioning is the same as the fractal high.
Intraday expectation:
Price to trade up to either premium of internal 50% EQ, or M15 demand zone before targeting weak internal low, currently priced at 4,235.165.
Alternative Scenario:
Due to the narrowing of the internal range, price could potentially strong internal high and print a bullish iBOS.
Note:
Gold remains highly reactive on M15 as geopolitical risk continues to drive quick, headline‑led moves.
The tension between the US, Israel, and Iran is keeping safe‑haven demand elevated, with markets still sensitive to any sign of escalation.
At the same time, shifting US tariff policy under President Trump is adding extra uncertainty, fuelling sharp intraday swings and increasing the likelihood of sudden sentiment flips. Liquidity pockets and whipsaws remain common, making disciplined risk management essential.
Gold’s geopolitical premium is still firmly in place, and until tensions ease, short‑term volatility is likely to stay front‑loaded.
M15 Chart: Crude Oil | Is Wave 3 Expanding?⏱️ Reading time: about 2 minutes
In the previous Crude Oil analysis, the main question was:
What kind of structure is the market building?
On this 2-hour chart, the move up from the major low still shows characteristics of an impulsive structure.
In the bullish scenario, this move could be part of a higher-degree Wave 3, and its internal structure is now giving us more clues.
Price is developing a five-wave structure. If this structure continues to unfold as expected and the internal Wave 4 completes, the next move could be Wave 5 of this structure.
103.558 is the first key level I’m watching for confirmation that this scenario is still developing.
If the bullish structure remains intact, 108.618, 111.148, and 114.431 can be used as the next reference areas.
And if the higher-degree Wave 3 is truly expanding, then 118.055, 120.244, and 123.868 come into focus as additional reference levels.
These are not fixed price predictions.
They simply help us track how the structure is developing.
On the other hand, if the current move fails to maintain its impulsive structure and instead develops into a larger correction, another scenario becomes relevant again.
94.199 is the first level I’m watching for invalidation in that scenario, while 66.980 remains the invalidation level for the larger bullish structure.
So the main question is still not:
“Is Crude Oil going up or down?”
The real question is:
“What will the next structure tell us?”
We don’t always need to predict the future.
Sometimes, it’s enough to let the structure reveal itself, one step at a time.
Patterns whisper, and I listen.
— Mr. Nobody 🎧📊
Brent Crude Oil
7 hours ago
Brent Crude Oil | Is Wave III Expanding?
 Long
Long