DJI H1: Bearish Structure Awaiting Confirmation Below 51,556.80The Dow Jones Industrial Average remains under short-term bearish pressure, while the broader D1 structure is approaching an important technical decision point.
On H1 and H4, price continues to form lower highs and lower lows. The recent recovery from the 51,556.80 support area currently appears corrective rather than a confirmed bullish reversal. Momentum has improved slightly, but price remains below a broad cascade of resistance levels.
RSI analysis:
On H1, RSI has recovered toward the neu
Federal Reserve Economic Data
DXY H1: Directional Confirmation Between 100.044 and 100.331The U.S. Dollar Index is currently trading inside a key decision range between 100.044 support and 100.331 resistance.
The broader D1 structure remains bearish-to-neutral, while H4 still retains a short-term bullish structure. However, momentum has weakened after rejection from the 100.496–100.573 resistance area. On H1, price has returned below 100.331, leaving the immediate direction unconfirmed.
Bullish scenario:
A sustained H1/H4 close above 100.331 would support a recovery toward 100.496
$FRED Technical Analysis – Crucial Zone ApproachingAQUISEU:FRED is currently approaching a major decision point on the chart. After consolidating for weeks in a tight range, the price is now testing the key descending trendline and breakout/resistance zone near $0.0048–$0.0060.
This level has historically acted as a rejection point, making it a critical area to watch. A clean breakout above the resistance zone, especially with a strong daily candle close, could trigger a short-term bullish move toward the next target at $0.013.
However, failu
F
Could South Korea's Currency Crisis Signal a New Economic ParadiIn a dramatic turn of events that echoes the turbulence of 2009, the South Korean won has plummeted to historic lows, breaching the critical KRW1,450 threshold against the US dollar. This seismic shift in currency markets isn't merely a numerical milestone—it represents a complex interplay of global monetary policy shifts and domestic political dynamics that could reshape our understanding of emerging market vulnerabilities in an interconnected world.
The Federal Reserve's recent "hawkish cut"
Yield curve Before Hyperinflation (QE US BONDS) BTC & SPY
The global bond market is what dictates the liquidity to stocks, its what dictates the world its what starts wars and its what ends wars.
Currently I see many post focused on "recession" "market crash" when the giant elephant in the room is the global bond market and the US reserve dollar that is currently in danger.
Why must we start foreign sanctions and battles with a country beginning with R? its very simple. There's a fight for the dollars survival. Covid 19 pushed the FRED past the poin
THREE WORDS THAT YOU SHOULD KNOW — TNX GOES NUTS!Bank of America says the recession and credit crunch could lead to large corporate defaults.
Credit strategists at Bank of America note that the fallout from the recession and credit crunch could see $1 trillion in corporate debt eventually become insolvent.
This is largely due to the fact that banks have already begun to refuse lending conditions after the collapse of Silicon Valley Bank. US debt growth has also slowed in recent years, and a "full blown" recession has yet to be officially dec
SPX | Of Course I'm Lying (?)I am not lying.
I am completely disproving my latest idea, on how to short SPX. That idea went on Editors' Picks. And I am now killing it.
I am not kidding, April Fools is for fools. I don't consider me or you a fool. So I am being serious.
Chart analysis is not always straightforward. Pinpointing tops and bottoms is the ultimate bet for a trader. As most of you know, this is very hard sometimes.
In 99% of a chart's movement, the trend is continuing. A significant trend change is very rare.
SPX | Spaaace!!!Spaaaaaaaaaaace!
Let's make a quick party, also bring a cake to celebrate! Make it quick, because it's late and I am tired and I should be sleeping by now.
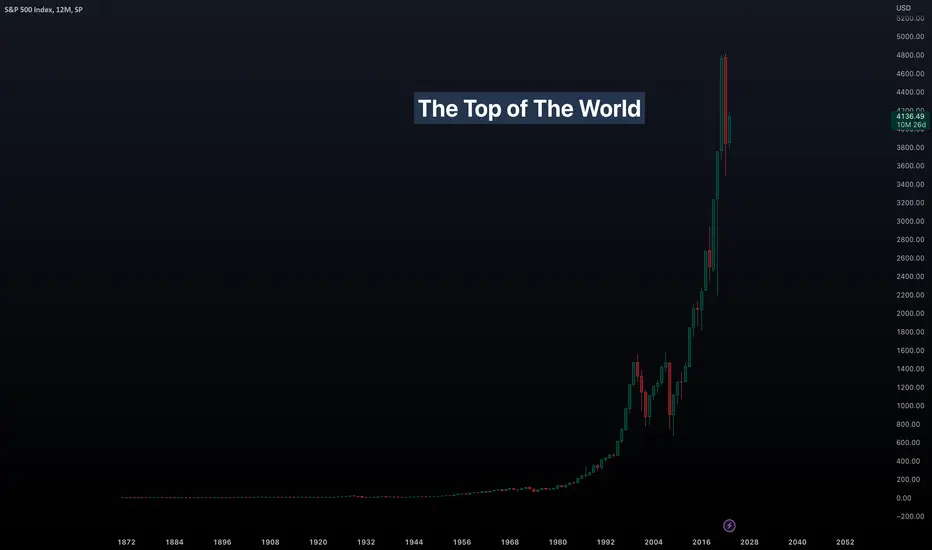
We have reached the top of the world. Well, equities have. It is time for them to lose value big time. Their successor is here, bonds. I have talked about it extensively in my last idea.
This is an urgent idea I wanted to post. It seems that day-by-day we might be witnessing the peak in equity price.
And this idea is dedicated to the pers
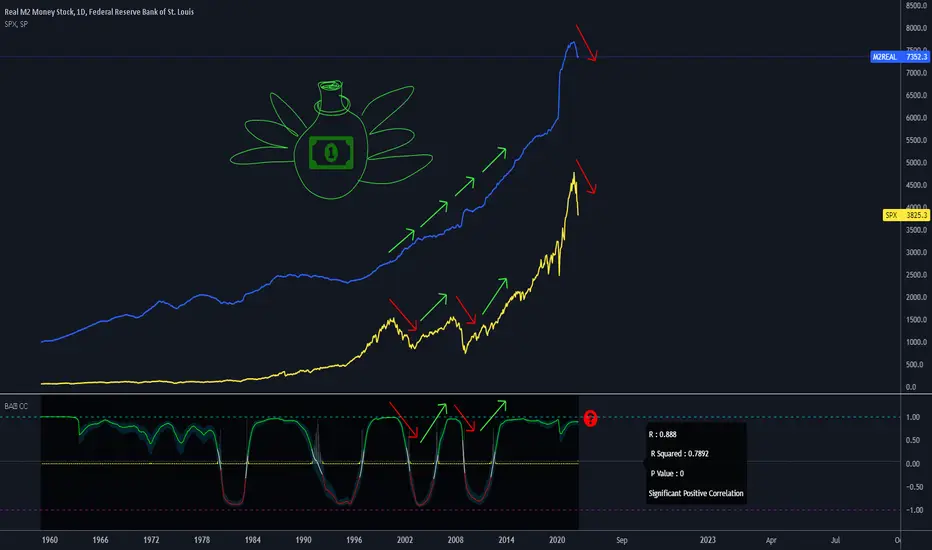
Working Money vs Stock MarketM2 is the money in circulation issued by the government.
(fred.stlouisfed.org)
M2REAL is the real value of M2 deflated by the CPIAUCSL (Consumer Price Index for All Urban Consumers).
(fred.stlouisfed.org)
M2REAL is in an infinite uptrend, with a downward correction now.
The correlation with SPX is positive as both are falling.
A change in correlation, either up or down, could indicate a move in SPX.
Scenarios:
1. M2REAL falling, SPX falling: positive correlation
2. M2RE
Inflation Higher Tomorrow? They changed their Calculation!Yeah, you heard that right. The Bureau of Labor Statistics has an announcement on their site saying, " Starting in January 2022, weights for the Consumer Price Index will be calculated based on consumer expenditure data from 2019-2020. The BLS considered interventions, but decided to maintain normal procedures. " They are changing their weighting. Does this raise inflation or lower it? Well, that depends. Based on the year-over-year percentage of change they are going back to 2019-2020 numbers w
Bitcoin Breaks Resistance and Government Loses Their MindsBitcoin breaks above old support at $40,000 and is holding. This is showing that it may be ready to make another run for it. $53k is real resistance and we need to be watching that. If we break hard to the downside off $53k then we may have just triggered our next huge sell-off into that $30k range. The best thing would be $40k remains as support and I don't think it would be long before $53k is broken with our high $60k becoming the realistic resistance before we head to new highs.
The govern
Hyperinflation coming by 2030 in the US. Can it be true? Who does it benefit? Check out the M2 money supply vs the S&P 500. Clearly, the more that is printed the more assets increase. Owning assets is your best bet of financial survival. The poor will be crushed but being wealthy in that time is not pretty either. This has been talked about for years by people like Robert Kiyosaki, Peter Schiff, Mike Maloney, and so many more. Milton Friedmans Free To Choose on YT has a great explanation about inflation I recommend everyone look at. Th
Fed Rate Increase, its relation to BTC price and rounded cyclesHello Traders,
I just wanted to put some visuals together as I am seeing a lot of banks making statements regarding the FED rate increases affecting the price of Bitcoin and other crypto assets negatively. I am not saying that this will not end up being the case but, I wanted to show what happened the last time the FED decided to increase rates compared to what happened with Bitcoin price action.
As you can see around Oct 31st (the first red vertical line) of 2015 the fed stated to gradually
░▒₿▒░ SATOSHI VS FRED ░▒₿▒░ INDEX:BTCUSD
FRED:CPIAUCSL
Bitcoin vs USD FRED.
35-50% on any given area, already. Hyper-Inflation is akin to the frog in the boiling water. . . As soon as you realize you are being cooked, it's too late! Venezuela dropping zeros (moving decimal places) due to inflation. Now they are backing 70% USD. LLLUUUUULLLLZZZZZZ
i.pinimg.com
Bonds Vs BTC and Equities What does everyone think about this?
This is the conclusion forecast of all the previous ideas I've been working up to
I don't see many people talking about the bigger picture of what is actually happening with Smart Money VS Retail
TNX and BTC show the correlation
TLT and the NDX show a similar but opposite correlation
Bonds lead then Risk assets follow accordingly
Wouldnt this make sense fundamentally?
BTC Is a hedge against inflation so it copies the 10-year bond outpacing inflation
Equit
The Roadmap to Bitcoin and the NASDAQ 100 My observations:
The 10-year Treasury bond is a leading indicator to show where smart money hedges its bets. The 10-year treasury bond is also perfectly correlated to Bitcoin. When this moves up, Bitcoin goes up. When this moves down, Bitcoin goes down. The NASDAQ 100 on the other hand has a lagging inverse correlation to the 10-year Treasury bond. The 10-year Treasury bond is currently taking the shape of an inverse head and shoulders and also is in an uptrend. We also have the Federal Reserv
Plan B - Well Plan A. Linear thinking.Let's start with inflation;
I recently wrote an article on Inflation - here's a little extra info to follow on from that.
This seems insane!!! And it is!!!
Stimulus - hype, FOMO, institutional adoption and so on.
What does this mean in terms of the charts?
Well some good news and some bad news - first of all, many people have now hears about Stock - to - flow made popular by a guy called plan B. Truth is, this technique has been around for a while and has been used in other instrum
M2 Money Supply in TV!Quick update:
We can now see the M2 Money supply in Trading View. Just type 'FRED:' as the search term as the symbol.
There was a TV notice about this, but I wanted to store it here too, because it's really helpful :)
Here's the notice:
www.tradingview.com
Also see these other instruments that are available now too via FRED:
tvblog-static.tradingview.com
Correlation between ON RRP and GoldHello Traders,
I hope you all are safe and good.
I wanted to show an interesting negative correlation between Fed's Overnight Reverse Repurchase Agreements and Gold Price.
You may also see a FRED GRAPH about that on below,
fred.stlouisfed.org
Question is ; Will there be much more weakness on Gold Price?
I guess we'll see that soon.
Share your ideas and comment below about that,
Have a good evening,
Stay safe.