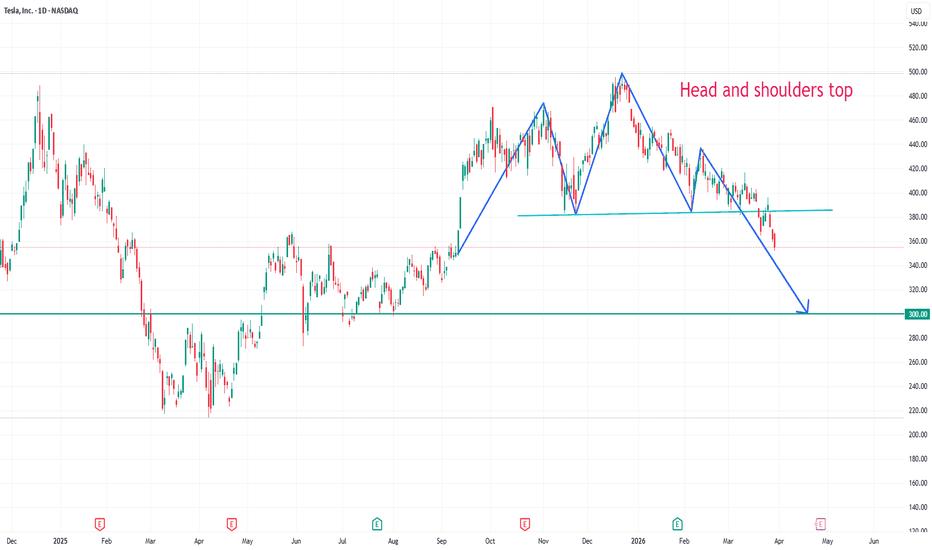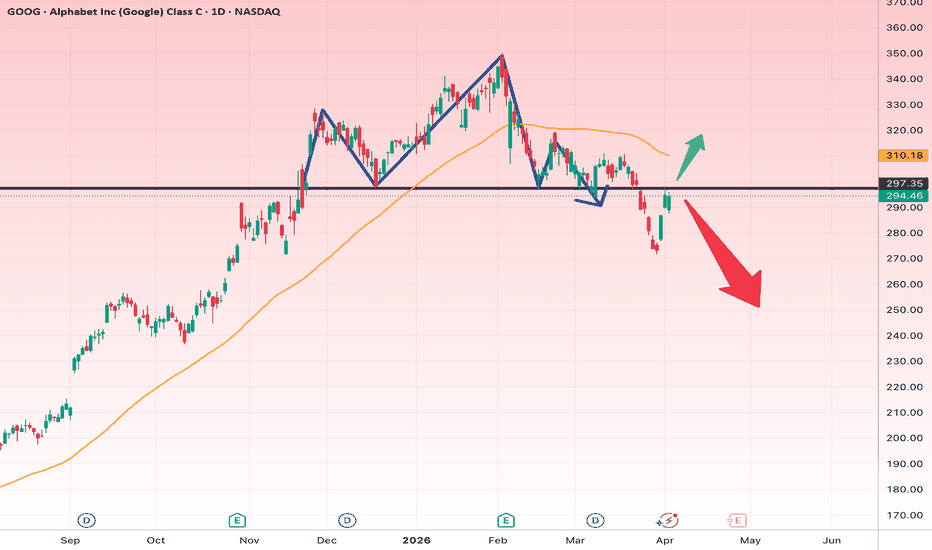
Head and Shoulders
GOOGL – Breakdown or Reversal at Key Support?Trend Overview:
The chart shows a clear shift from an uptrend into a bearish structure. After forming a lower high, price broke down aggressively and is now reacting around a key horizontal support zone near $295.
Key Technical Points:
1. Support Zone (~$295):
• This level previously acted as strong support.
• Price is currently testing it again after a sharp drop.
• Reaction here is critical for next direction.
2. Moving Average (Orange Line):
• Price is trading below the MA, confirming short-term bearish momentum.
• The MA is now acting as dynamic resistance.
3. Market Structure:
• Formation of lower highs and lower lows → bearish trend.
• The recent bounce looks like a weak pullback, not a confirmed reversal yet.
Scenarios:
Bullish Scenario (Green Path):
• If price holds above $295 and reclaims it strongly
• Break above ~$310 (MA resistance)
→ Potential move toward $320–330
Bearish Scenario (Red Path – More Likely):
• If price fails to hold $295
→ Breakdown continuation toward $270–250 zone
Conclusion:
The market is at a decision point. However, based on structure and momentum, the bias remains bearish unless strong confirmation of reversal appears.
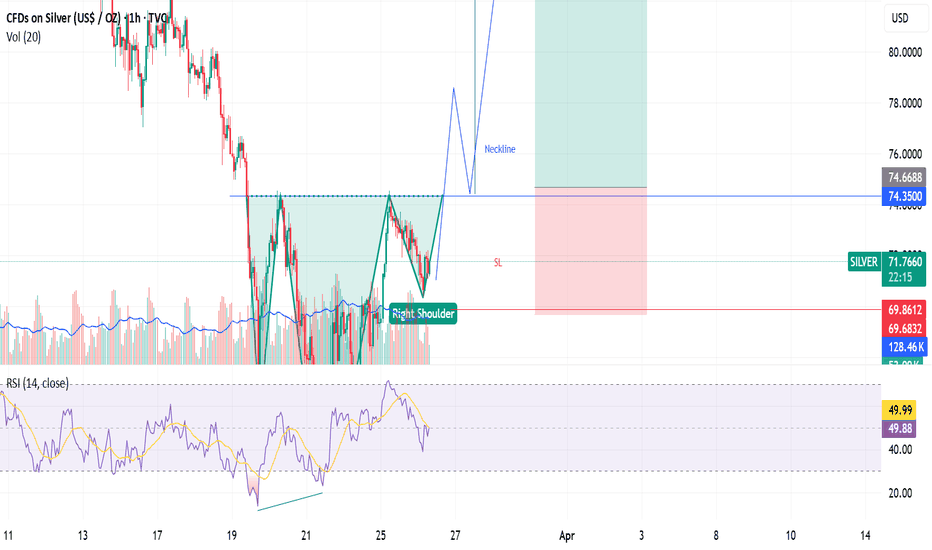
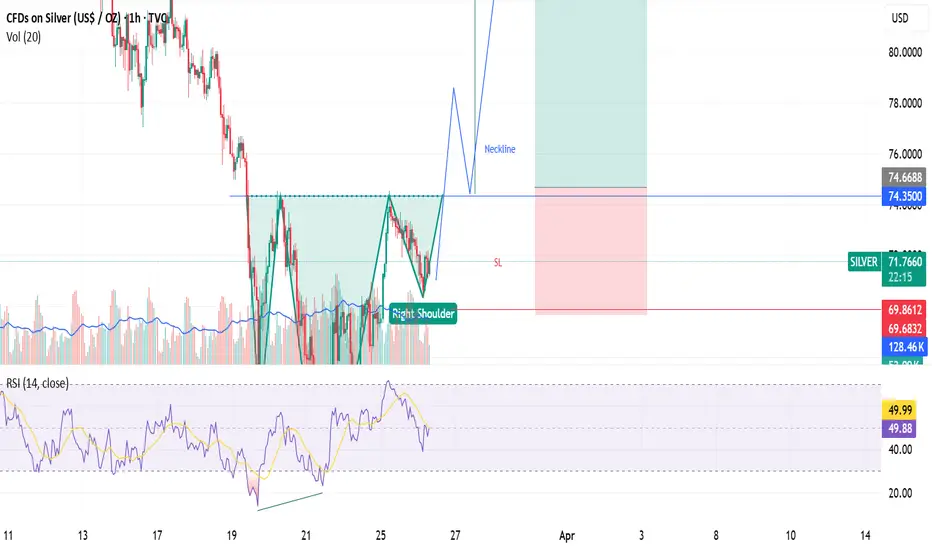
Possible Silver Long TradeA prominent inverse head and shoulder pattern is forming on one hour timeframe which can result in reversal from current downtrend. Another bullish indication is bullish divergence forming on left shoulder and head. Only enter trade if neckline is broken so a buy stop order can be placed.
Entry: 74.6968
TP: 87.8122
SL: 69.8632
Risk: 0.4%
RR: 2.64
Disclaimer: Trade as per your own risk appetite and ensure risk management, this is not financial advice.
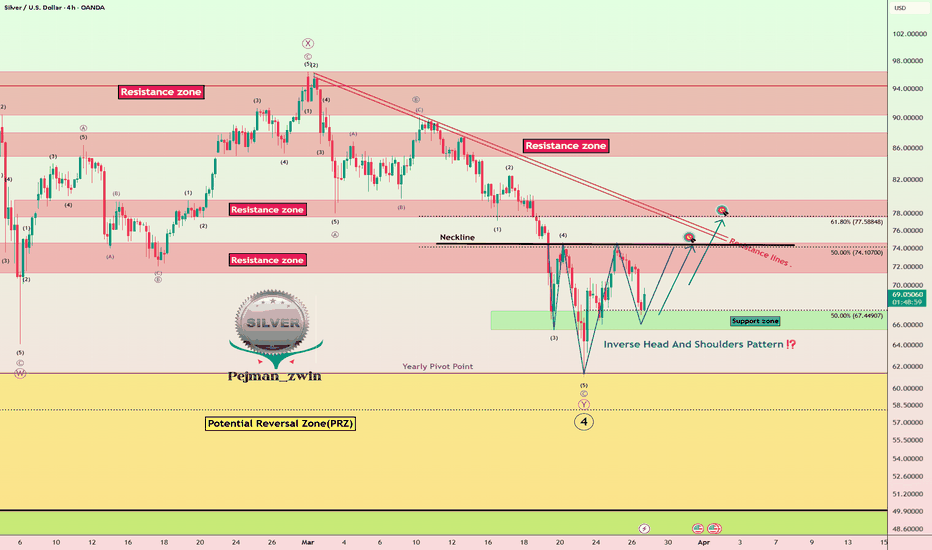
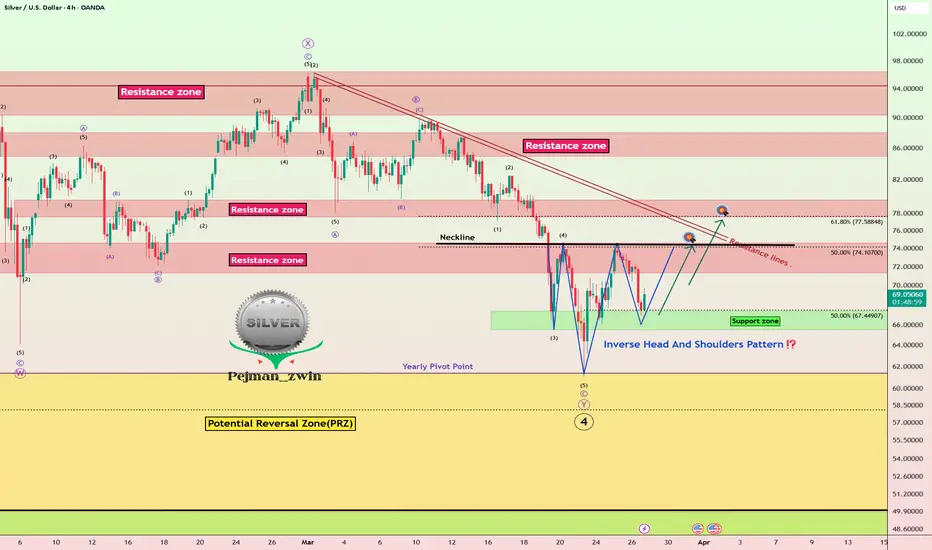
Silver Roadmap: Inverse H&S in the Making?Silver ( OANDA:XAGUSD ), as I expected in my previous updates, reacted well at the Potential Reversal Zone(PRZ) and started to rise right near this PRZ.
In general, precious metals, especially Gold( OANDA:XAUUSD ) and Silver, are currently sensitive to news and Middle East tensions. Any news about rising tensions or even a ceasefire in the conflict can quickly alter the market trajectory. So, it’s essential to manage your risk carefully these days, as the market can be heavily influenced by sudden, high-momentum moves.
From a classic technical analysis perspective, there’s a likelihood of forming an Inverse Head and Shoulders Pattern on silver in the 4-hour timeframe. If this pattern is completed and the neckline is broken with strong momentum, we can hope for further gains.
From the Elliott Wave theory, it seems that silver has completed wave 4 near the PRZ.
I expect that in the coming hours, silver will rise once again and potentially reach $73.47.
First Target: $73.47
Second Target: $77.140
Stop Loss(SL): $65.17
Points may shift as the market evolves
What do you think about silver—do you believe it can form this Inverse Head and Shoulders Pattern, or will it continue its decline in the coming days?
💡 Please respect each other's opinions and express agreement or disagreement politely.
📌 Silver/ U.S. Dollar Analyze (XAGUSD), 4-hour time frame.
🛑 Always set a Stop Loss(SL) for every position you open.
✅ This is just my idea; I’d love to see your thoughts too!
🔥 If you find it helpful, please BOOST this post and share it with your friends.
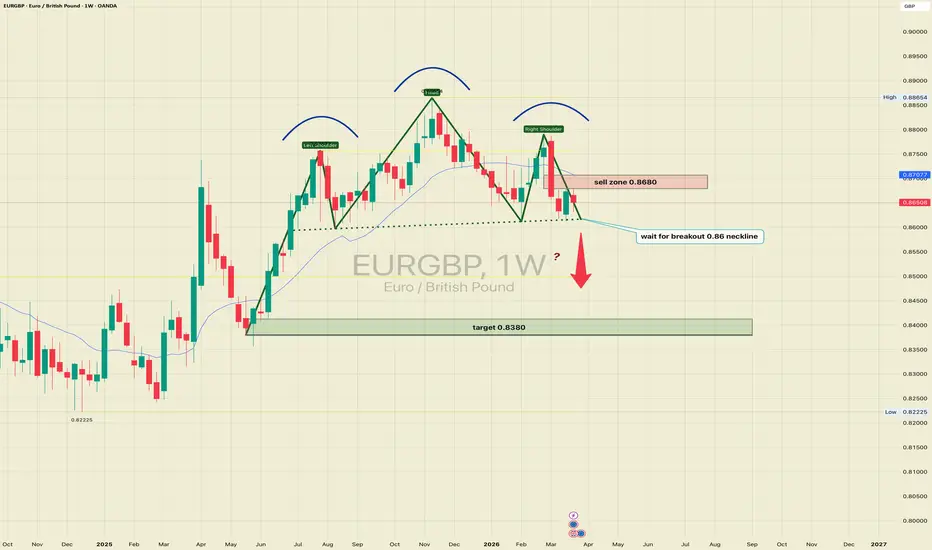
EURGBP 1W: the market just drew the textbookEURGBP is currently one of those rare charts where the market is doing exactly what classical technical analysis says it should do. On the weekly timeframe, a clean head and shoulders structure is already in place and this is not a case for interpretation, it is a case for execution.
The left shoulder, the head, and the right shoulder are all clearly formed. Price pushed into the 0.8680 sell zone, found supply again, and rolled over. That rejection matters. It confirms that sellers are still defending higher liquidity and that this zone is not decorative - it is active.
Now the entire setup narrows down to one level: the 0.8600 neckline.
That is the decision point.
As long as price remains above it, the pattern is only pressure. Once price breaks and confirms below it, the structure becomes active - and the downside opens toward 0.8380, which is the projected move of the pattern and also aligns with a broader historical demand zone.
This is what makes the setup clean: pattern, rejection, neckline pressure, and target all line up without needing extra narrative.
Structurally, the chart is already showing deterioration:
lower highs, rejection from supply, and repeated pressure into support. This is not emotional selling - it is controlled distribution.
The trading logic here is straightforward.
If EURGBP confirms a break below 0.8600, the path toward 0.8380 becomes the primary scenario. If the break fails, price may still rotate higher into liquidity before the structure completes. That is why this is not a guessing game. It is a confirmation trade.
Sometimes the market does not need complexity.
It simply prints the textbook.
And this is one of those times.
AXISCADES TECHNOLOGIESAxiscades Technologies Ltd. (NSE: AXISCADES) is a mid‑cap company in the aerospace, defense, and engineering services sector, providing product engineering, digital transformation, and technology solutions to global OEMs. Headquartered in Bengaluru, it serves industries including aerospace, defense, heavy engineering, automotive, and energy.
Promoter: Promoter Group (Minda Family & Associates) – 58.05% holding (Dec 2025)
FY22–FY26 Snapshot
Revenue Growth: CAGR ~12–13% over FY22–FY26, driven by aerospace and defense contracts. → Good
Net Profit: FY26 PAT ~₹185 Cr, reflecting strong growth. → Good
Operating Margin: Maintained ~11–12%, showing efficiency in engineering services. → Neutral
Equity Capital: Stable, no major dilution. → Good
Dividend Policy: Yield ~0.6% (FY26), conservative payouts. → Neutral
Asset Building: Expansion of design centers and offshore delivery hubs. → Good
Sales: FY26 revenue crossed ₹1,550 Cr. → Good
Expense: High employee and technology costs. → Neutral
EPS: ~₹12.8 in FY26, reflecting consistent profitability. → Good
Institutional Interest & Ownership Trends (Dec 2025)
Promoter Holding: 58.05% (pledged ~0.02%)
FII Holding: 1.45%
DII Holding: 0.94%
Retail & Others: ~39.56%
Strategic Moves & Innovations
Expansion into defense engineering and aerospace design services.
Focus on digital transformation, AI, and Industry 4.0 solutions.
Investment in cybersecurity and simulation technologies.
Strengthening global partnerships with OEMs in aerospace and defense.
Cash Flow & Balance Sheet Strength
Operating cash flows supported by long‑term contracts.
Debt levels moderate, manageable with steady profits.
Profit growth supports reinvestment in R&D and delivery centers.
Risk Factors
Dependence on aerospace and defense demand cycles.
Margin sensitivity to employee and technology costs.
Competition from global engineering service providers.
Exposure to geopolitical risks affecting defense contracts.
Investor Takeaway
Axiscades Technologies Ltd., backed by the Minda Family & Associates, is a specialized engineering services provider with strong promoter holding and high retail participation. With most snapshot parameters rated Good, the company shows consistent EPS growth, robust asset building, and strong sales momentum. Investors should monitor defense contract cycles and cost pressures, but overall the outlook remains positive for long‑term holders.
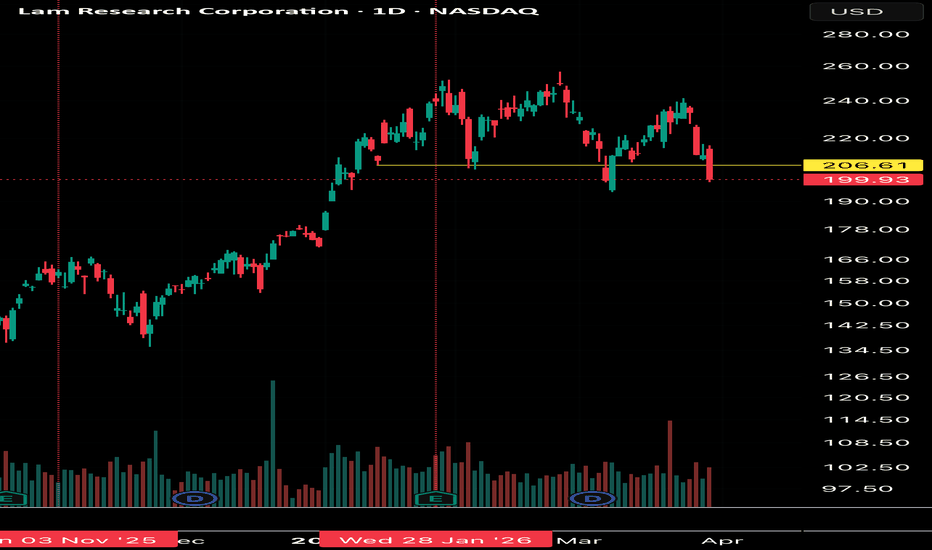
LRCX - looking for deep discount under $80I posted notes about GOOGL, ASML and AGX. LRCX completely slipped my watchlist until I was reviewing today’s sell off in Semi’s.
This stock is very volatile, but overall trend is up to the right. it sells and services equipment to chip making companies, “computers brain making hardware”
Stock went up 4.5x since April ‘25 lows to Feb ‘26 high. Since I am expecting huge sell off in the market, this is another prime candidate to buy on the huge discount.
Why I think it will be a no brainer buy: SPY essentially topped back in Oct 29, and made marginally higher highs since then until actual top on Jan 28. LRCX? Went up over 50% between Nov 3 and peak in late FEB! What does that mean? While smart money was rotating out of risk assets before SPY actual top they also were buying LRCX.
I am expecting stock drop due to “temporary”global meltdown, not due to actual business deterioration. Demand for semis while cyclical is not going away long term.
If supply chain is distorted enough and global economy sees meltdown due to political instability + high oil prices/recession + security concerns semis will be taking a big hit.
How far can stock drop? Far. If we truly see Covid like sell off in markets, LRCX could potentially go below $80.
Also daily chart clearly shows head and shoulders structure. Since SPY topped in Jan 28, LRCX has seen higher volumes on bearish candles and light volumes on bullish days. That alone signals near future lower prices, obviously not $80 low, but low enough (~$140) that it could overshot in case of panic to $80.
I am looking forward to buy it on sale.
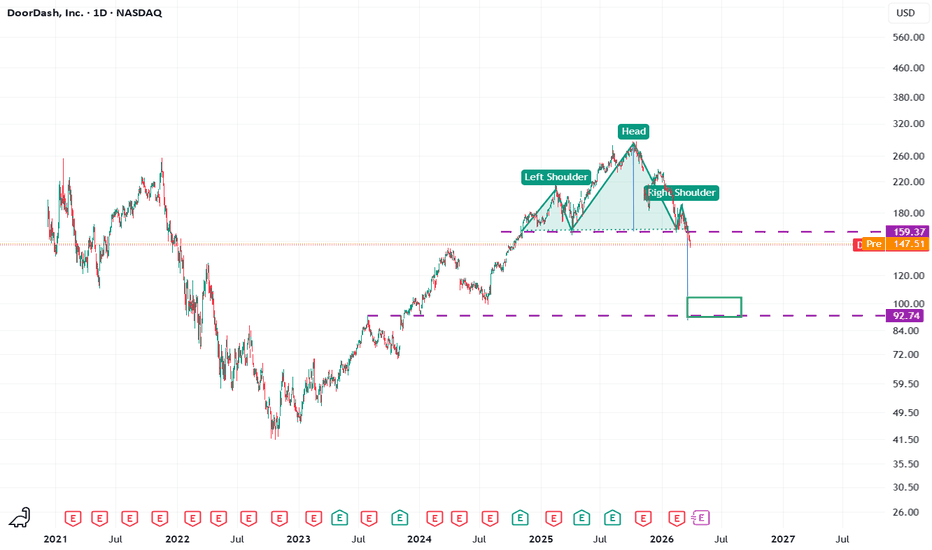
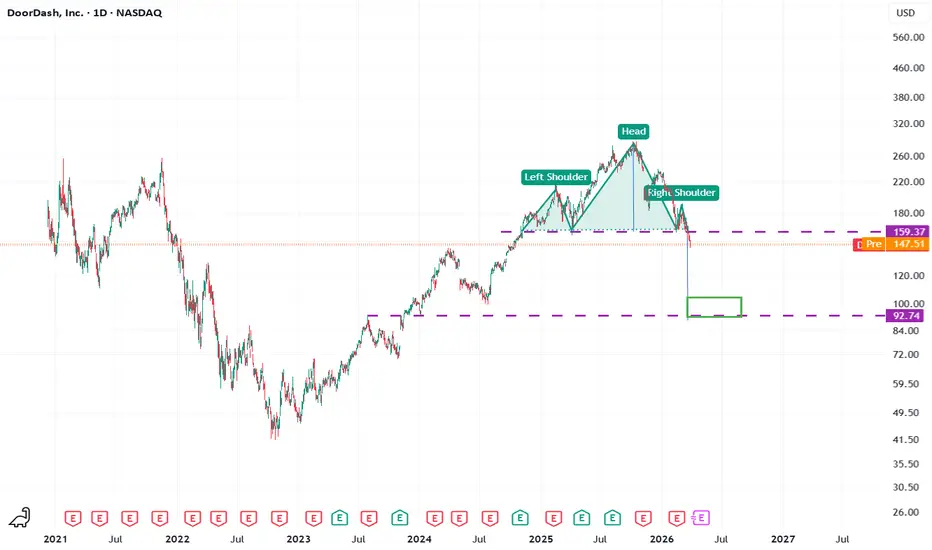
DASH H&S Bearish set up on the H&S its close to reaching round number target of say $100
reasons why share price of DASH could fall
1. Extremely high valuation (biggest risk)
Trading at ~130+ P/E, far above most peers
➡️ This means:
Expectations are very high
Any slowdown in growth or margins → sharp multiple compression
2. Profitability still relatively thin vs valuation
EPS is still modest relative to market cap (~$116B)
➡️ Risk:
If margins don’t scale as expected → valuation looks stretched quickly
Investors may re-rate it closer to a lower-growth service business
3. Competition intensifying (core structural risk)
Competing with:
Uber Eats
Deliveroo
local players globally
➡️ Risk:
Price wars
higher incentives for drivers/customers
→ margin pressure
4. Consumer spending sensitivity
Food delivery is discretionary spend
➡️ If:
inflation rises
recession hits
→ people cut takeaways first
5. Dependence on promotions and incentives
Growth partly driven by:
discounts
free delivery offers
➡️ Risk:
Pulling back incentives slows growth
Keeping them → hurts profitability
6. Regulatory risk (ongoing global issue)
Governments targeting:
gig worker classification
minimum pay rules
➡️ Risk:
Higher labour costs
reduced flexibility → lower margins
7. Slowing order growth / market saturation
Core markets (US) becoming more mature
➡️ Risk:
Growth shifts from high growth → steady growth
Market may reprice it accordingly
8. Insider selling (notable signal)
Significant insider selling relative to ownership (as you flagged earlier)
➡️ Risk:
Signals management taking profits at current valuation
Can pressure sentiment
9. Weak recent price momentum
Stock down significantly from highs (~$280 → ~$140 range)
➡️ Risk:
Downtrend attracts:
short sellers
institutional rotation out
10. Expansion execution risk
Moving into:
grocery
international markets
➡️ Risk:
lower margins
operational complexity
failure to replicate US success
Bottom line (what matters most for DASH)
The key downside drivers are:
Very high valuation vs profits
Margins not scaling as expected
Competitive + regulatory pressure
Consumer demand sensitivity
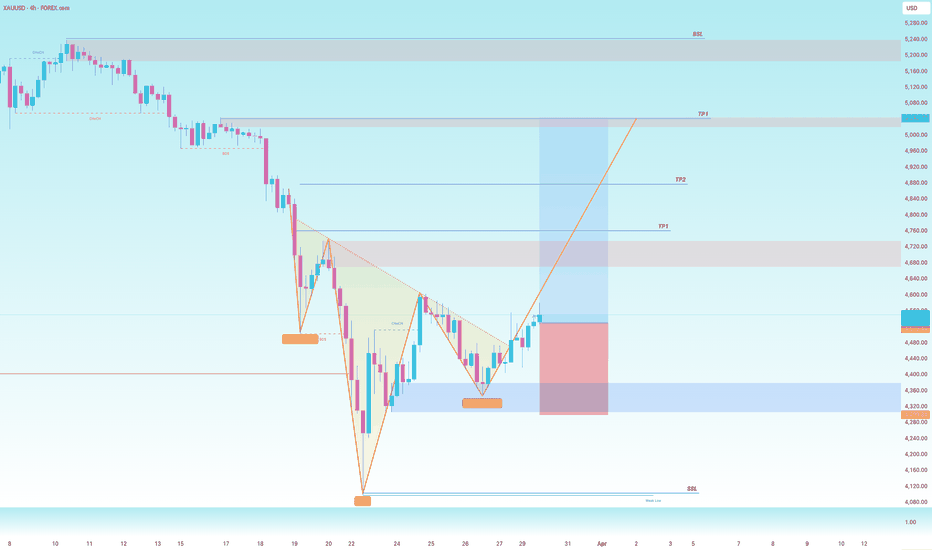
XAUUSD (Gold) – Technical Outlook📊 XAUUSD is showing a bullish reversal setup on the 4H timeframe, with an inverse head & shoulders pattern forming and price currently testing the neckline around 4,570–4,600. 🚀 A confirmed breakout and hold above this zone suggests a shift in momentum, opening the door for an impulsive move toward 4,750 → 4,880 → 5,040, with potential to reach higher liquidity near 5,200+.
⚠️ However, if price fails to hold above the neckline and rejects this zone, the move could turn into a fake breakout, sending gold back down toward 4,430 → 4,340, and possibly retesting the 4,100 liquidity zone. 📉 Overall bias remains cautiously bullish, but confirmation is key at the current resistance level.
PUB H&S bearish view Bearish ideas to meet the H&S target
but in past the H&S target was just missed in the green box full target then later much stronger down trend in place - so will it be short to target again better be on safe side
Also used the Head max to the neck line skewed to RHS which gives lower target, may have been better to draw top of the head in this position but I got bored now, to modify it.
So maybe take position off a bit early here level with prior KLOS/R point first target as shown by purple line
We have a confirmed breakdown in mid bearish trend
reasons to be bearish
1. AI disruption risk (biggest current driver)
The advertising industry is being directly disrupted by AI tools.
PUB shares recently fell ~8% in a single day after outlook failed to ease AI concerns.
➡️ Risk:
Clients may:
spend less on agencies
bring work in-house using AI
Long-term threat to the entire business model
2. Weak / conservative growth outlook
Publicis guided ~4–5% organic growth for 2026, seen as modest.
➡️ Risk:
Even if realistic, markets may view it as:
slowing growth
lack of upside
This already triggered a sharp sell-off
3. Stock already in a downtrend
Share price:
near 52-week lows (~€68)
down ~23% over 1 year
➡️ Risk:
Weak momentum → continued selling
Institutions may rotate out
4. Cyclical exposure to advertising spend
Publicis relies on marketing and advertising budgets
➡️ These are:
one of the first things companies cut in downturns
➡️ Risk:
recession or slowdown → immediate revenue pressure
5. Industry-wide pressure (not just Publicis)
Entire sector facing:
restructuring
cost cuts
AI-driven disruption (e.g. WPP restructuring)
➡️ Risk:
Structural decline in traditional agency model
Lower long-term valuation multiples
6. Earnings stagnation despite revenue growth
Revenue growing (~+8.5%) but:
net income slightly declined (~-0.4%)
➡️ Risk:
Indicates:
margin pressure
costs rising faster than profits
7. Analyst sentiment weakening
Analyst price targets have been revised downward recently
➡️ Risk:
Signals reduced confidence
Can trigger institutional selling
8. Competitive pressure from global peers
Competes with:
WPP
Omnicom
Dentsu
➡️ Risk:
Pricing pressure
Losing major accounts impacts revenue quickly
9. Reliance on large clients
Big agency model = dependence on large contracts
➡️ Risk:
Losing a few major clients → disproportionate impact
10. Despite “cheap” valuation, sentiment is weak
PUB trades at ~10x earnings (relatively low)
➡️ Normally bullish, BUT:
Market may be pricing in:
structural decline
AI disruption risk
Bottom line (what matters most for PUB)
The key downside drivers are:
AI threatening the ad agency model
Low growth outlook
Weak price momentum
Economic sensitivity (ad spending cuts first)
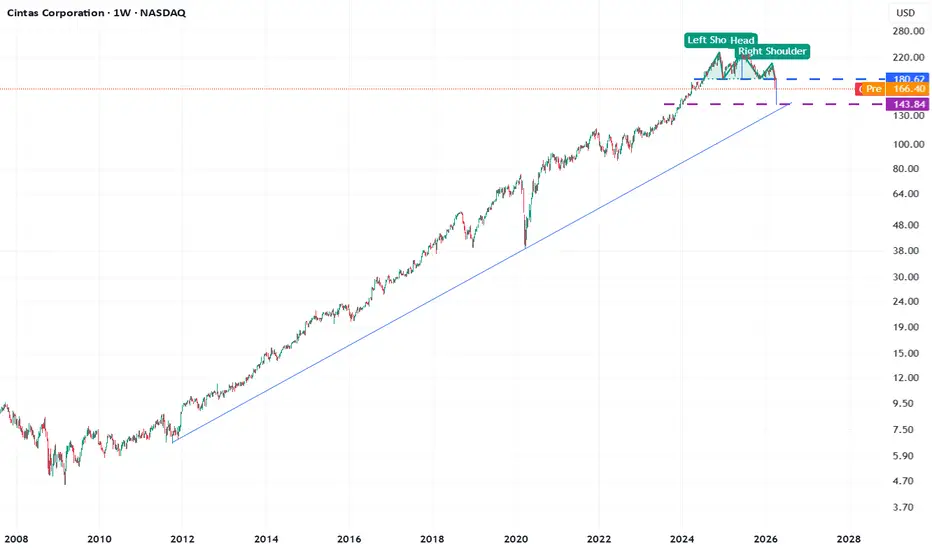
CTAS H&S chart Bearish already breaking down
Looks like support is back at H&S target and long term up trendline
Reasons to be bearish
1. Premium valuation (biggest risk)
CTAS trades at ~34–42x earnings, well above market averages.
Metrics like:
Price-to-book ~13x
EV/Sales ~6x (vs ~2x sector)
➡️ This means:
The stock is priced for near-perfect execution
Any disappointment → sharp downside
2. Growth expectations already “priced in”
Analysts expect steady growth (~8–11% revenue/EPS).
➡️ Risk:
If growth slows even slightly → valuation compresses
Hard to outperform when expectations are already high
3. Earnings sensitivity (near-term catalyst risk)
Stock is currently under scrutiny due to recent earnings releases and guidance updates.
➡️ If:
margins slip
guidance weakens
→ stock likely reacts negatively
4. Cyclical exposure to business activity
Cintas provides uniforms, cleaning, and workplace services.
➡️ Highly linked to:
employment levels
business activity
hospitality / airlines / industrial demand
If the economy slows → demand drops.
5. Evidence of “lumpy” revenue segments
Uniform direct sales have already shown declines and unpredictability.
➡️ This segment:
can swing results unexpectedly
has previously triggered sharp stock drops (~10%)
6. Pricing power may weaken
Management has warned price increases are getting harder as inflation falls.
➡️ Risk:
Slower pricing growth → margin pressure
7. M&A execution risk (UniFirst deal)
Ongoing attempts to acquire UniFirst.
➡️ Risks:
Overpaying
integration issues
deal falling through → wasted time / costs
8. Slower organic growth vs valuation
Business is stable but not high-growth (~single-digit revenue growth).
➡️ Mismatch:
“steady business” vs “growth stock valuation”
9. Margin pressure from costs
Labour, logistics, and materials costs matter heavily in service businesses
➡️ If costs rise faster than pricing → margins shrink
10. Low dividend yield (less downside support)
Yield is ~0.9–1%
➡️ Investors aren’t paid much to hold during downturns
→ easier for money to rotate out
Bottom line (what matters most for CTAS)
The biggest downside drivers are:
Overvaluation vs moderate growth
Sensitivity to earnings / guidance
Exposure to economic slowdown
Weakening pricing power
29-03-26 1000RatsThe charts show that sellers are already dominating. In this situation, it's quite difficult to wait for a pullback because buyers have lost their dominance.
1Short
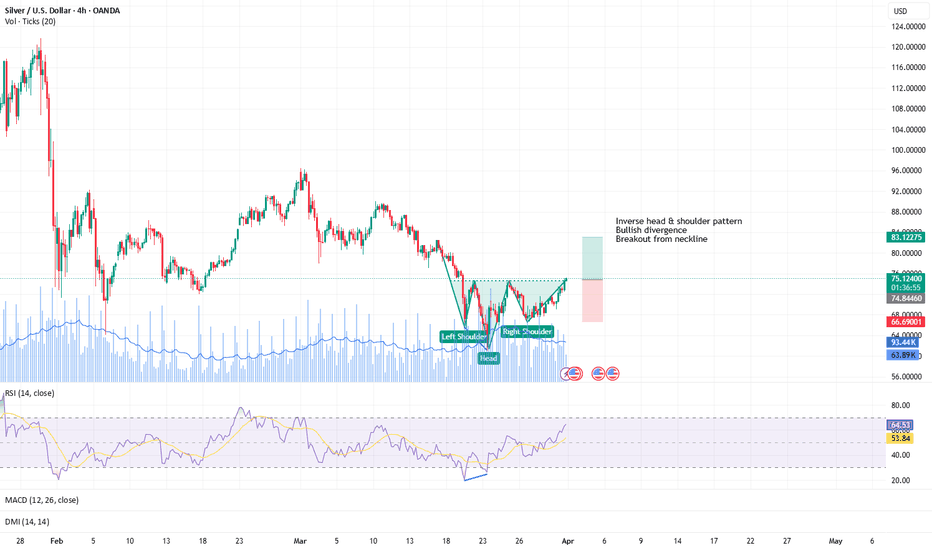
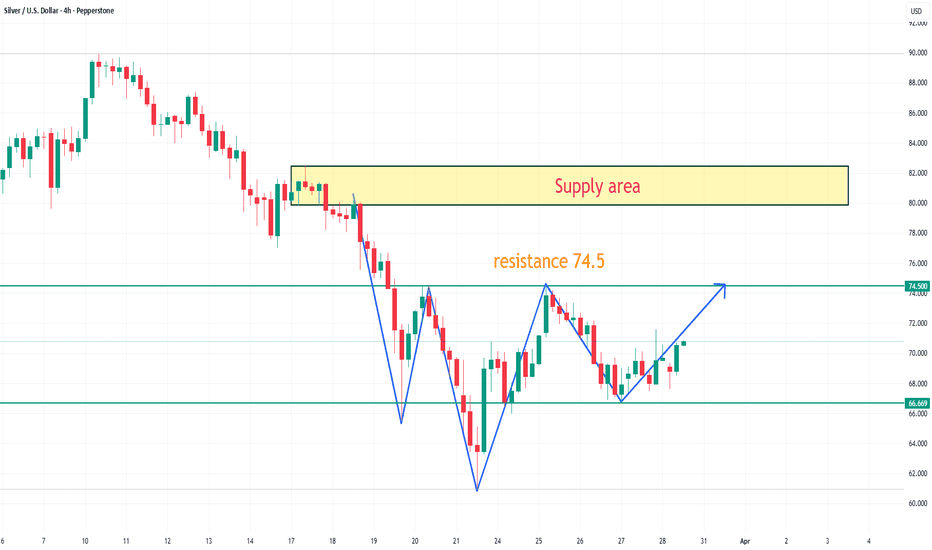
XAGUSD has formed a potential head and shoulders bottom pattern.On the 4-hour chart, XAGUSD has formed a potential head and shoulders bottom pattern. Currently, attention should be paid to the resistance around 74.5; a break above this level could trigger an upward move, targeting the 79.8-82.5 area.
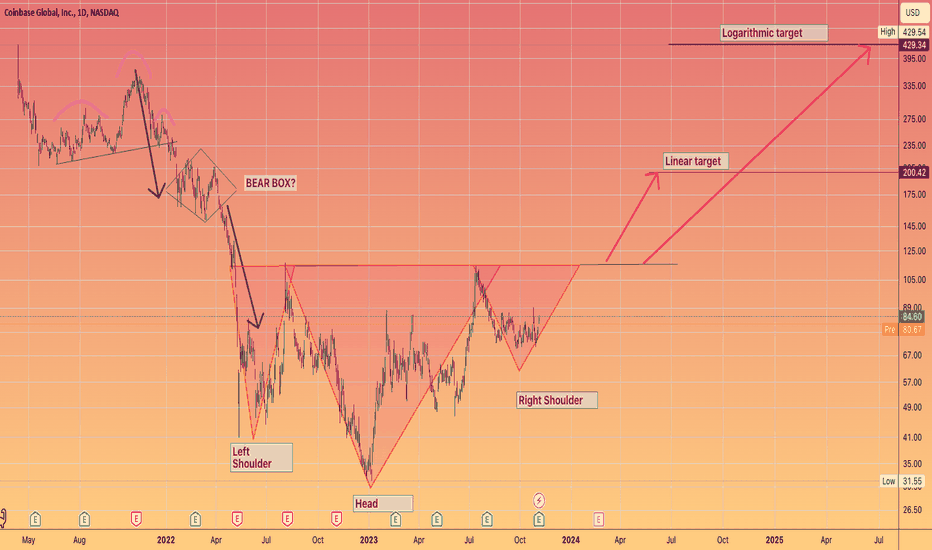
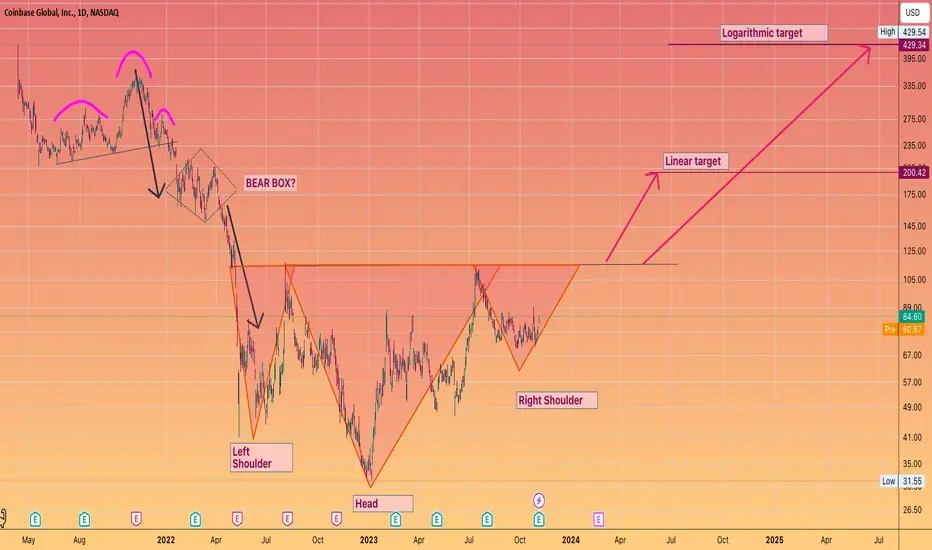
COINBASE - #COIN massive Inverse Head & ShouldersTwo targets
Linear and Log projections
Both are juicy obviously
Brian Armstrong timed their IPO perfectly and extracted billions of dollars kudos to them
Wouldn't it be something if Coinbase was to return back it's #IPO price this coming bull , seems like destiny
$Safari Industries – Baggage stock can be claimed at lower price
📉🧳
The market is finally "unpacking" the truth about Safari Industries.
Despite 20% volume growth, the company is trapped in a margin death spiral, with EBITDA margins crashing from 15% to 10.9% in just two quarters due to aggressive discounting.
Margin Compression: Operating margins collapsed by 416 basis points in just two quarters (from 15.02% to 10.86%).
Expensive Valuation: Even after the crash, it trades at a 52x P/E, a 33% premium to its sector, despite "poor" growth scores.
Management Shakeup: The recent resignation of the Company Secretary and changes in management have added to the uncertainty.
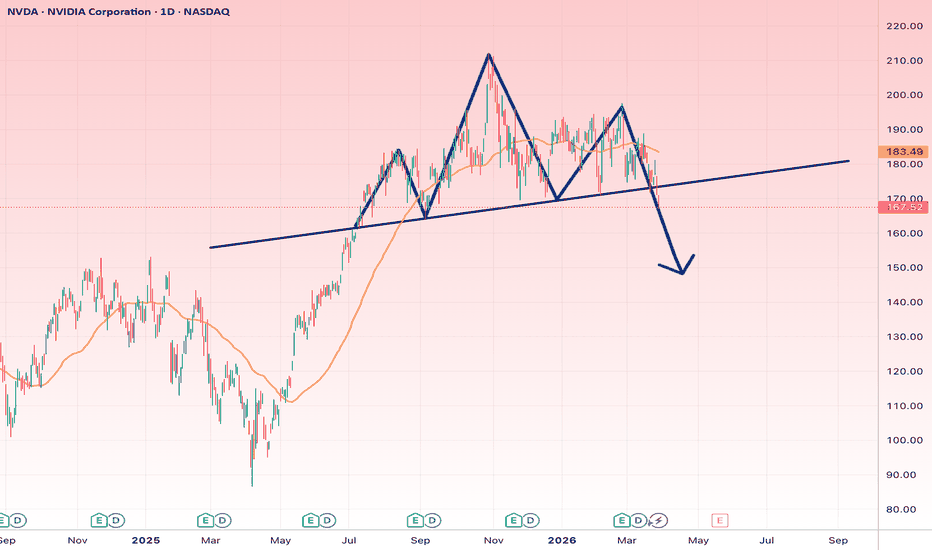
NVIDIA (NVDA) – Daily Timeframe AnalysisOverall Structure
• The market is forming a distribution structure
• Your marked pattern resembles a Head & Shoulders / Lower High sequence
• Price is breaking or about to break the ascending trendline
👉 This is a major potential trend shift signal
Bearish Scenario (Primary Bias)
• Formation of lower highs
• Breakdown of bullish structure
• Price trading below the MA
📉 Targets:
• 155 (first support)
• 150 (key level)
• 140 (extended target)
👉 Confirmation:
• Daily close below trendline
• Strong continuation bearish candles
Bullish Scenario (Less likely)
If this turns into a fake breakdown:
📈 Targets:
• 180 (first resistance)
• 190–200 (supply zone)
👉 Confirmation:
• Strong reclaim of the trendline
• Holding above the MA
Professional Summary
• Structure: Distribution → Potential Downtrend
• This setup is often seen before larger corrections
• If breakdown confirms → broader risk-off sentiment may follow
Strategy Insight:
• Short: After confirmed breakdown (best setup)
• Long: Only on strong reclaim
• No Trade: If price stays choppy between levels
Important Insight:
NVDA is a market leader in AI, so if it drops, it often impacts:
• Apple
• Meta Platforms
• Microsoft
👉 Meaning: This could be a broader market move, not just one stock.